

Key Insights
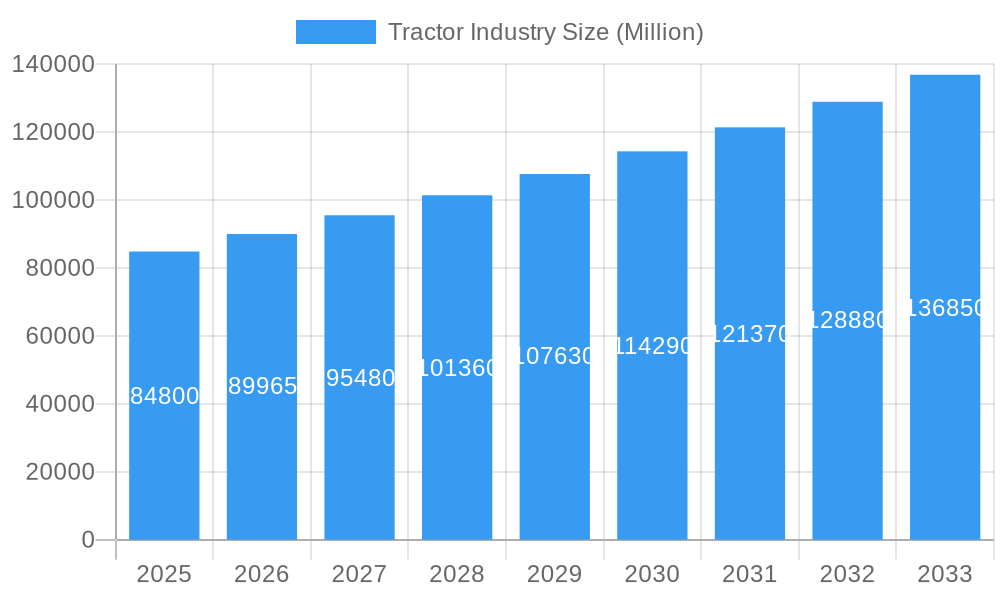
The global tractor market, valued at $84.80 billion in 2025, is projected to experience robust growth, driven by a compound annual growth rate (CAGR) of 5.90% from 2025 to 2033. This expansion is fueled by several key factors. Increasing agricultural productivity demands in developing economies, particularly in Asia-Pacific and regions like South America and Africa, are stimulating high demand for modern, efficient tractors. Furthermore, technological advancements, such as the incorporation of precision farming technologies (GPS-guided systems, automated steering, etc.), are enhancing operational efficiency and yield, making tractors a more attractive investment for farmers of all scales. Government initiatives promoting agricultural modernization and mechanization in many countries further bolster market growth. The market segmentation reveals significant opportunities across different horsepower ranges, with the 40-100 HP segment likely dominating due to its suitability for a wide range of farming operations. Similarly, the four-wheel-drive/all-wheel-drive segment is expected to grow faster than two-wheel drive due to its superior traction and capabilities in diverse terrains. Key players like Escorts Limited, Deere & Company, and Kubota Corporation are actively investing in research and development, expanding their product portfolios, and engaging in strategic partnerships to maintain their competitive edge and capitalize on this growth trajectory.
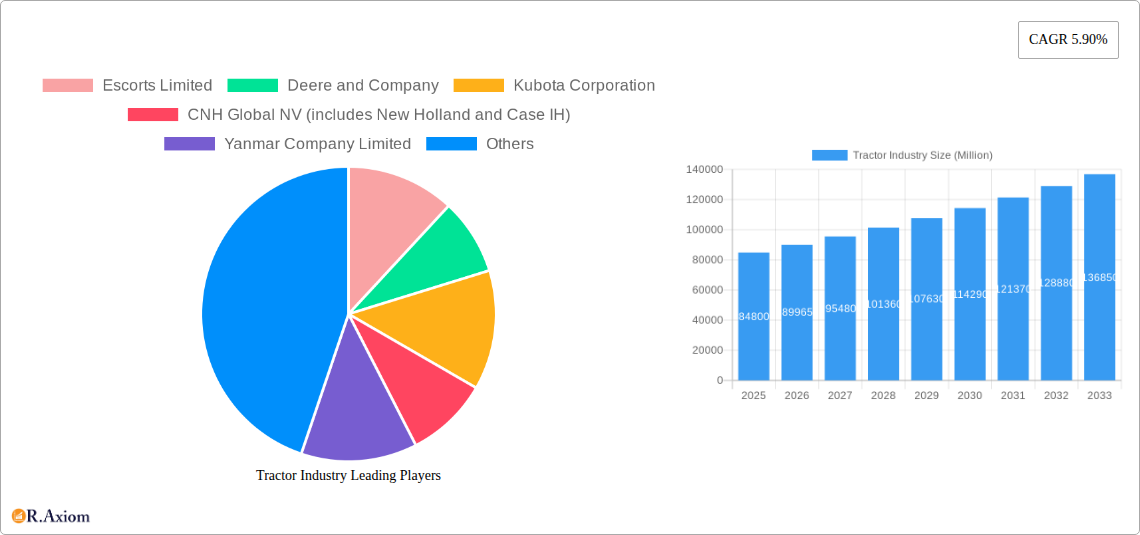
Tractor Industry Market Size (In Billion)
The competitive landscape is characterized by both established multinational corporations and regional players. While established companies benefit from brand recognition and global distribution networks, regional manufacturers are increasingly competitive through localized production and cost advantages. The market's regional distribution reflects the concentration of agricultural activities, with North America, Europe, and Asia Pacific expected to hold the largest market shares. However, significant untapped potential exists in emerging markets, particularly in Africa and parts of South America, which are poised for considerable growth as agricultural practices modernize. The restraints on market growth could include fluctuating fuel prices, economic downturns impacting farmer investment, and concerns regarding the environmental impact of agricultural machinery. However, the increasing adoption of fuel-efficient and environmentally friendly technologies is mitigating some of these concerns.
Tractor Industry Company Market Share
Tractor Industry Market Report: 2019-2033
This comprehensive report provides a detailed analysis of the global tractor industry, encompassing market size, segmentation, competitive landscape, and future growth prospects. The study period covers 2019-2033, with 2025 as the base and estimated year, and a forecast period of 2025-2033. The report leverages extensive data analysis from the historical period (2019-2024) to provide actionable insights for industry stakeholders. Key players such as Escorts Limited, Deere & Company, Kubota Corporation, and Mahindra & Mahindra are analyzed in detail.
Tractor Industry Market Concentration & Innovation
The global tractor industry is characterized by a moderately concentrated market structure, with a few major players holding significant market share. However, the presence of numerous regional and niche players creates a dynamic competitive landscape. Innovation is a key driver, with companies investing heavily in technological advancements such as automation, electrification, and precision farming technologies. Stringent emission regulations are shaping product development, pushing manufacturers towards cleaner and more efficient machines. Furthermore, the increasing demand for high-horsepower tractors from large-scale farms is influencing market dynamics.
- Market Share Concentration: The top 5 players hold approximately xx% of the global market share (2024 data).
- Innovation Drivers: Automation, AI, precision agriculture, electrification, and alternative fuel technologies.
- Regulatory Frameworks: Emission standards (Tier 4/Stage V) are driving the adoption of cleaner technologies.
- Product Substitutes: Limited direct substitutes exist, but alternative farming practices and mechanization methods could pose indirect competition.
- End-User Trends: Growing demand for high-efficiency, technologically advanced tractors, particularly in developing economies.
- M&A Activities: Significant M&A activity was observed during the historical period, with deal values totaling approximately USD xx Million (2019-2024). These mergers often involved smaller companies being acquired by larger corporations looking to broaden their product offerings or expand into new markets.
Tractor Industry Industry Trends & Insights
The global tractor market is experiencing robust and dynamic growth, propelled by accelerating agricultural mechanization, the imperative to meet escalating global food demand, and supportive government policies fostering agricultural modernization. Projections indicate a Compound Annual Growth Rate (CAGR) of **XX%** for the forecast period (2025-2033), signaling substantial market expansion. Technological innovations, particularly in autonomous tractors and precision farming tools, are revolutionizing traditional agricultural practices, leading to enhanced yields and significant efficiency improvements. Consumer preferences are increasingly leaning towards tractors equipped with advanced technological features, superior fuel efficiency, and enhanced operator comfort. The competitive landscape is characterized by fierce rivalry among key industry players, fostering continuous product innovation and strategic alliances. The penetration of technologically advanced tractors is anticipated to rise from approximately **XX%** in 2024 to an estimated **XX%** by 2033.
Dominant Markets & Segments in Tractor Industry
The North American and Indian markets are currently the most dominant regions globally in the tractor industry, followed by China and Europe. The higher horsepower segment (above 100 HP) and four-wheel drive/all-wheel drive tractors are dominant segments due to increased demand for efficient large-scale farming and improved traction capabilities in varying terrains.
Key Drivers for Dominant Regions:
- North America: High agricultural output, advanced farming practices, and strong government support.
- India: Large agricultural sector, growing farmer incomes, and government initiatives to promote mechanization.
- China: Extensive agricultural land, increasing mechanization rate, and government policies supporting agricultural modernization.
- Europe: Intensive farming practices, high adoption of advanced technologies, and favorable regulatory environment.
Dominant Segments:
- By Horsepower: Above 100 HP shows faster growth due to large-scale farming operations.
- By Drive Type: Four-wheel drive/all-wheel drive is preferred for superior traction and maneuverability.
Tractor Industry Product Developments
Recent product developments underscore a pronounced shift towards autonomous tractors, electric tractors, and sophisticated precision agriculture technologies. Manufacturers are actively integrating advanced solutions like GPS, intelligent sensors, and artificial intelligence (AI) to optimize farm operations and boost overall efficiency. This strong emphasis on automation and sustainability directly addresses the growing demand for environmentally conscious farming methods that simultaneously achieve higher yields. The introduction of electric tractors, exemplified by ITL's Solis electric tractor, signifies a strategic pivot towards sustainable agriculture. These innovations provide substantial competitive advantages, including improved fuel economy, reduced environmental impact through lower emissions, and enhanced operational accuracy.
Report Scope & Segmentation Analysis
This report segments the tractor market by horsepower (below 40 HP, 40 HP - 100 HP, above 100 HP) and drive type (two-wheel drive, four-wheel drive/all-wheel drive). Each segment is analyzed in detail, including market size, growth projections, and competitive dynamics. The higher horsepower segments are expected to experience faster growth, driven by large-scale farming operations and increased efficiency needs. Similarly, four-wheel drive tractors are expected to witness higher adoption rates due to better traction and handling in diverse farming conditions. Market size projections indicate a significant expansion in all segments during the forecast period.
Key Drivers of Tractor Industry Growth
Several factors are driving the growth of the tractor industry. These include:
- Technological advancements: Automation, precision agriculture, and the emergence of electric and autonomous tractors are improving efficiency and productivity.
- Economic growth: Rising disposable incomes in developing countries are fueling the demand for agricultural mechanization.
- Favorable government policies: Subsidies and incentives for agricultural modernization are promoting tractor adoption. Example: Indian government schemes to incentivize farmers for tractor purchases.
Challenges in the Tractor Industry Sector
The tractor industry faces several challenges, including:
- High initial investment costs: The cost of purchasing advanced tractors can be prohibitive for small farmers.
- Supply chain disruptions: Global supply chain issues affect the availability of components and increase production costs.
- Intense competition: The industry is characterized by strong competition among major players, putting pressure on profit margins.
Emerging Opportunities in Tractor Industry
The tractor industry presents several promising opportunities:
- Expansion in emerging markets: Growing agricultural sectors in developing countries provide significant growth potential.
- Development of sustainable tractors: Electric and alternative fuel tractors are gaining traction, creating new market opportunities.
- Increased adoption of precision farming technologies: Growing demand for efficient and data-driven farming practices opens avenues for technology providers.
Leading Players in the Tractor Industry Market
- Escorts Limited
- Deere and Company
- Kubota Corporation
- CNH Global NV
- Yanmar Company Limited
- Kuhn Group (Subsidiary of Bucher Industries)
- Deutz-Fahr
- Mahindra and Mahindra Corporation
- CLAAS KGaA mbH
- Tractors and Farm Equipment Limited (TAFE)
- AGCO Corporation
Key Developments in Tractor Industry Industry
- March 2024: Hyster Company's significant agreement with APM Terminals for the supply of 10 battery-powered terminal tractors highlights the accelerating adoption of electric vehicles within specialized tractor segments. This substantial USD 60 Million investment underscores the industry-wide trend towards electrification in heavy-duty equipment.
- October 2023: ITL's successful launch of three new Solis tractor series, including the innovative SV Solis electric tractor, represents a major stride towards developing sustainable and technologically advanced agricultural machinery. Its impressive rapid charging capability (3-3.5 hours) provides a distinct competitive edge in the market.
- May 2023: CNH's strategic USD 50 Million investment in India's farm machinery sector demonstrates a strong commitment to this vital market. The introduction of a new 105HP tractor directly addresses the increasing demand for higher horsepower machinery.
- September 2022: KAMAZ PJSC's expansion of its gas vehicle range signals a clear strategic focus on developing and promoting alternative fuel technologies. This initiative reflects the growing imperative to reduce emissions and enhance sustainability across the broader transportation sector, which inherently includes agricultural machinery.
- August 2022: Foxconn's contract manufacturing agreement with Monarch Tractor for the production of autonomous tractors and battery packs underscores the increasing influence of cutting-edge technology in modern agricultural machinery. This development emphasizes the critical role of strategic partnerships and seamless technology integration in this rapidly evolving industry.
- July 2022: Ashok Leyland's introduction of the AVTR 4220 and AVTR 4420 tractors in the 4x2 segment illustrates a strategic approach to product diversification within a specific market niche, offering customers a broader spectrum of choices and enhanced solutions.
Strategic Outlook for Tractor Industry Market
The tractor industry is on a trajectory for sustained and significant growth, propelled by relentless technological innovation, the ongoing expansion of agricultural mechanization globally, and the persistent rise in demand for food. The increasing emphasis on sustainable practices and the development of technologically advanced tractors present compelling opportunities for manufacturers. Emerging markets in developing economies, coupled with the transformative shift towards precision agriculture and automation, are set to profoundly shape future market dynamics. Companies that demonstrate agility in adapting to these evolving trends and make substantial investments in research and development will be strategically positioned for enduring success in this dynamic industry.
Tractor Industry Segmentation
-
1. Horsepower
- 1.1. Below 40 HP
- 1.2. 40 HP - 100 HP
- 1.3. Above 100 HP
-
2. Drive Type
- 2.1. Two-wheel Drive
- 2.2. Four-wheel Drive/All-wheel Drive
Tractor Industry Segmentation By Geography
-
1. North America
- 1.1. United States
- 1.2. Canada
- 1.3. Rest of North America
-
2. Europe
- 2.1. Germany
- 2.2. United Kingdom
- 2.3. France
- 2.4. Spain
- 2.5. Italy
- 2.6. Rest of Europe
-
3. Asia Pacific
- 3.1. China
- 3.2. Japan
- 3.3. India
- 3.4. South Korea
- 3.5. Rest of Asia Pacific
-
4. Rest of the World
- 4.1. South America
- 4.2. Middle East and Africa
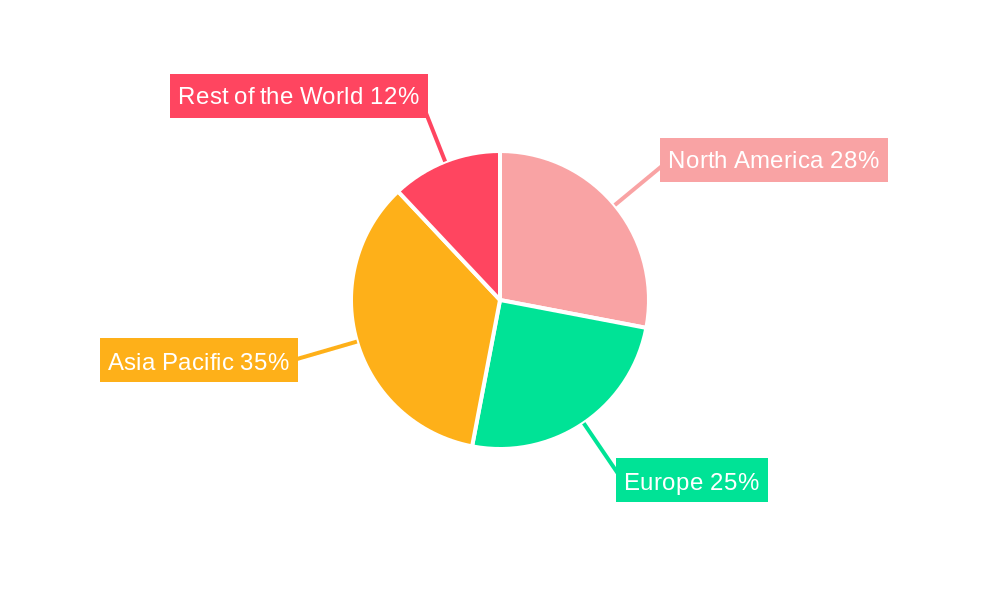
Tractor Industry Regional Market Share
Geographic Coverage of Tractor Industry
Tractor Industry REPORT HIGHLIGHTS
| Aspects | Details |
|---|---|
| Study Period | 2020-2034 |
| Base Year | 2025 |
| Estimated Year | 2026 |
| Forecast Period | 2026-2034 |
| Historical Period | 2020-2025 |
| Growth Rate | CAGR of 5.90% from 2020-2034 |
| Segmentation |
|
Table of Contents
- 1. Introduction
- 1.1. Research Scope
- 1.2. Market Segmentation
- 1.3. Research Objective
- 1.4. Definitions and Assumptions
- 2. Executive Summary
- 2.1. Market Snapshot
- 3. Market Dynamics
- 3.1. Market Drivers
- 3.2. Market Restrains
- 3.3. Market Trends
- 3.4. Market Opportunities
- 4. Market Factor Analysis
- 4.1. Porters Five Forces
- 4.1.1. Bargaining Power of Suppliers
- 4.1.2. Bargaining Power of Buyers
- 4.1.3. Threat of New Entrants
- 4.1.4. Threat of Substitutes
- 4.1.5. Competitive Rivalry
- 4.2. PESTEL analysis
- 4.3. BCG Analysis
- 4.3.1. Stars (High Growth, High Market Share)
- 4.3.2. Cash Cows (Low Growth, High Market Share)
- 4.3.3. Question Mark (High Growth, Low Market Share)
- 4.3.4. Dogs (Low Growth, Low Market Share)
- 4.4. Ansoff Matrix Analysis
- 4.5. Supply Chain Analysis
- 4.6. Regulatory Landscape
- 4.7. Current Market Potential and Opportunity Assessment (TAM–SAM–SOM Framework)
- 4.8. RAX Analyst Note
- 4.1. Porters Five Forces
- 5. Market Analysis, Insights and Forecast 2021-2033
- 5.1. Market Analysis, Insights and Forecast - by Horsepower
- 5.1.1. Below 40 HP
- 5.1.2. 40 HP - 100 HP
- 5.1.3. Above 100 HP
- 5.2. Market Analysis, Insights and Forecast - by Drive Type
- 5.2.1. Two-wheel Drive
- 5.2.2. Four-wheel Drive/All-wheel Drive
- 5.3. Market Analysis, Insights and Forecast - by Region
- 5.3.1. North America
- 5.3.2. Europe
- 5.3.3. Asia Pacific
- 5.3.4. Rest of the World
- 5.1. Market Analysis, Insights and Forecast - by Horsepower
- 6. Global Tractor Industry Analysis, Insights and Forecast, 2021-2033
- 6.1. Market Analysis, Insights and Forecast - by Horsepower
- 6.1.1. Below 40 HP
- 6.1.2. 40 HP - 100 HP
- 6.1.3. Above 100 HP
- 6.2. Market Analysis, Insights and Forecast - by Drive Type
- 6.2.1. Two-wheel Drive
- 6.2.2. Four-wheel Drive/All-wheel Drive
- 6.1. Market Analysis, Insights and Forecast - by Horsepower
- 7. North America Tractor Industry Analysis, Insights and Forecast, 2020-2032
- 7.1. Market Analysis, Insights and Forecast - by Horsepower
- 7.1.1. Below 40 HP
- 7.1.2. 40 HP - 100 HP
- 7.1.3. Above 100 HP
- 7.2. Market Analysis, Insights and Forecast - by Drive Type
- 7.2.1. Two-wheel Drive
- 7.2.2. Four-wheel Drive/All-wheel Drive
- 7.1. Market Analysis, Insights and Forecast - by Horsepower
- 8. Europe Tractor Industry Analysis, Insights and Forecast, 2020-2032
- 8.1. Market Analysis, Insights and Forecast - by Horsepower
- 8.1.1. Below 40 HP
- 8.1.2. 40 HP - 100 HP
- 8.1.3. Above 100 HP
- 8.2. Market Analysis, Insights and Forecast - by Drive Type
- 8.2.1. Two-wheel Drive
- 8.2.2. Four-wheel Drive/All-wheel Drive
- 8.1. Market Analysis, Insights and Forecast - by Horsepower
- 9. Asia Pacific Tractor Industry Analysis, Insights and Forecast, 2020-2032
- 9.1. Market Analysis, Insights and Forecast - by Horsepower
- 9.1.1. Below 40 HP
- 9.1.2. 40 HP - 100 HP
- 9.1.3. Above 100 HP
- 9.2. Market Analysis, Insights and Forecast - by Drive Type
- 9.2.1. Two-wheel Drive
- 9.2.2. Four-wheel Drive/All-wheel Drive
- 9.1. Market Analysis, Insights and Forecast - by Horsepower
- 10. Rest of the World Tractor Industry Analysis, Insights and Forecast, 2020-2032
- 10.1. Market Analysis, Insights and Forecast - by Horsepower
- 10.1.1. Below 40 HP
- 10.1.2. 40 HP - 100 HP
- 10.1.3. Above 100 HP
- 10.2. Market Analysis, Insights and Forecast - by Drive Type
- 10.2.1. Two-wheel Drive
- 10.2.2. Four-wheel Drive/All-wheel Drive
- 10.1. Market Analysis, Insights and Forecast - by Horsepower
- 11. Competitive Analysis
- 11.1. Company Profiles
- 11.1.1 Escorts Limited
- 11.1.1.1. Company Overview
- 11.1.1.2. Products
- 11.1.1.3. Company Financials
- 11.1.1.4. SWOT Analysis
- 11.1.2 Deere and Company
- 11.1.2.1. Company Overview
- 11.1.2.2. Products
- 11.1.2.3. Company Financials
- 11.1.2.4. SWOT Analysis
- 11.1.3 Kubota Corporation
- 11.1.3.1. Company Overview
- 11.1.3.2. Products
- 11.1.3.3. Company Financials
- 11.1.3.4. SWOT Analysis
- 11.1.4 CNH Global NV (includes New Holland and Case IH)
- 11.1.4.1. Company Overview
- 11.1.4.2. Products
- 11.1.4.3. Company Financials
- 11.1.4.4. SWOT Analysis
- 11.1.5 Yanmar Company Limited
- 11.1.5.1. Company Overview
- 11.1.5.2. Products
- 11.1.5.3. Company Financials
- 11.1.5.4. SWOT Analysis
- 11.1.6 Kuhn Group (Subsidiary of Bucher Industries)
- 11.1.6.1. Company Overview
- 11.1.6.2. Products
- 11.1.6.3. Company Financials
- 11.1.6.4. SWOT Analysis
- 11.1.7 Deutz-Fah
- 11.1.7.1. Company Overview
- 11.1.7.2. Products
- 11.1.7.3. Company Financials
- 11.1.7.4. SWOT Analysis
- 11.1.8 Mahindra and Mahindra Corporation
- 11.1.8.1. Company Overview
- 11.1.8.2. Products
- 11.1.8.3. Company Financials
- 11.1.8.4. SWOT Analysis
- 11.1.9 CLAAS KGaA mbH
- 11.1.9.1. Company Overview
- 11.1.9.2. Products
- 11.1.9.3. Company Financials
- 11.1.9.4. SWOT Analysis
- 11.1.10 Tractors and Farm Equipment Limited (TAFE)
- 11.1.10.1. Company Overview
- 11.1.10.2. Products
- 11.1.10.3. Company Financials
- 11.1.10.4. SWOT Analysis
- 11.1.11 AGCO Corporation (includes Massey Ferguson Valtra Fendt and Challenger)
- 11.1.11.1. Company Overview
- 11.1.11.2. Products
- 11.1.11.3. Company Financials
- 11.1.11.4. SWOT Analysis
- 11.1.1 Escorts Limited
- 11.2. Market Entropy
- 11.2.1 Company's Key Areas Served
- 11.2.2 Recent Developments
- 11.3. Company Market Share Analysis 2025
- 11.3.1 Top 5 Companies Market Share Analysis
- 11.3.2 Top 3 Companies Market Share Analysis
- 11.4. List of Potential Customers
- 12. Research Methodology
List of Figures
- Figure 1: Global Tractor Industry Revenue Breakdown (Million, %) by Region 2025 & 2033
- Figure 2: North America Tractor Industry Revenue (Million), by Horsepower 2025 & 2033
- Figure 3: North America Tractor Industry Revenue Share (%), by Horsepower 2025 & 2033
- Figure 4: North America Tractor Industry Revenue (Million), by Drive Type 2025 & 2033
- Figure 5: North America Tractor Industry Revenue Share (%), by Drive Type 2025 & 2033
- Figure 6: North America Tractor Industry Revenue (Million), by Country 2025 & 2033
- Figure 7: North America Tractor Industry Revenue Share (%), by Country 2025 & 2033
- Figure 8: Europe Tractor Industry Revenue (Million), by Horsepower 2025 & 2033
- Figure 9: Europe Tractor Industry Revenue Share (%), by Horsepower 2025 & 2033
- Figure 10: Europe Tractor Industry Revenue (Million), by Drive Type 2025 & 2033
- Figure 11: Europe Tractor Industry Revenue Share (%), by Drive Type 2025 & 2033
- Figure 12: Europe Tractor Industry Revenue (Million), by Country 2025 & 2033
- Figure 13: Europe Tractor Industry Revenue Share (%), by Country 2025 & 2033
- Figure 14: Asia Pacific Tractor Industry Revenue (Million), by Horsepower 2025 & 2033
- Figure 15: Asia Pacific Tractor Industry Revenue Share (%), by Horsepower 2025 & 2033
- Figure 16: Asia Pacific Tractor Industry Revenue (Million), by Drive Type 2025 & 2033
- Figure 17: Asia Pacific Tractor Industry Revenue Share (%), by Drive Type 2025 & 2033
- Figure 18: Asia Pacific Tractor Industry Revenue (Million), by Country 2025 & 2033
- Figure 19: Asia Pacific Tractor Industry Revenue Share (%), by Country 2025 & 2033
- Figure 20: Rest of the World Tractor Industry Revenue (Million), by Horsepower 2025 & 2033
- Figure 21: Rest of the World Tractor Industry Revenue Share (%), by Horsepower 2025 & 2033
- Figure 22: Rest of the World Tractor Industry Revenue (Million), by Drive Type 2025 & 2033
- Figure 23: Rest of the World Tractor Industry Revenue Share (%), by Drive Type 2025 & 2033
- Figure 24: Rest of the World Tractor Industry Revenue (Million), by Country 2025 & 2033
- Figure 25: Rest of the World Tractor Industry Revenue Share (%), by Country 2025 & 2033
List of Tables
- Table 1: Global Tractor Industry Revenue Million Forecast, by Horsepower 2020 & 2033
- Table 2: Global Tractor Industry Revenue Million Forecast, by Drive Type 2020 & 2033
- Table 3: Global Tractor Industry Revenue Million Forecast, by Region 2020 & 2033
- Table 4: Global Tractor Industry Revenue Million Forecast, by Horsepower 2020 & 2033
- Table 5: Global Tractor Industry Revenue Million Forecast, by Drive Type 2020 & 2033
- Table 6: Global Tractor Industry Revenue Million Forecast, by Country 2020 & 2033
- Table 7: United States Tractor Industry Revenue (Million) Forecast, by Application 2020 & 2033
- Table 8: Canada Tractor Industry Revenue (Million) Forecast, by Application 2020 & 2033
- Table 9: Rest of North America Tractor Industry Revenue (Million) Forecast, by Application 2020 & 2033
- Table 10: Global Tractor Industry Revenue Million Forecast, by Horsepower 2020 & 2033
- Table 11: Global Tractor Industry Revenue Million Forecast, by Drive Type 2020 & 2033
- Table 12: Global Tractor Industry Revenue Million Forecast, by Country 2020 & 2033
- Table 13: Germany Tractor Industry Revenue (Million) Forecast, by Application 2020 & 2033
- Table 14: United Kingdom Tractor Industry Revenue (Million) Forecast, by Application 2020 & 2033
- Table 15: France Tractor Industry Revenue (Million) Forecast, by Application 2020 & 2033
- Table 16: Spain Tractor Industry Revenue (Million) Forecast, by Application 2020 & 2033
- Table 17: Italy Tractor Industry Revenue (Million) Forecast, by Application 2020 & 2033
- Table 18: Rest of Europe Tractor Industry Revenue (Million) Forecast, by Application 2020 & 2033
- Table 19: Global Tractor Industry Revenue Million Forecast, by Horsepower 2020 & 2033
- Table 20: Global Tractor Industry Revenue Million Forecast, by Drive Type 2020 & 2033
- Table 21: Global Tractor Industry Revenue Million Forecast, by Country 2020 & 2033
- Table 22: China Tractor Industry Revenue (Million) Forecast, by Application 2020 & 2033
- Table 23: Japan Tractor Industry Revenue (Million) Forecast, by Application 2020 & 2033
- Table 24: India Tractor Industry Revenue (Million) Forecast, by Application 2020 & 2033
- Table 25: South Korea Tractor Industry Revenue (Million) Forecast, by Application 2020 & 2033
- Table 26: Rest of Asia Pacific Tractor Industry Revenue (Million) Forecast, by Application 2020 & 2033
- Table 27: Global Tractor Industry Revenue Million Forecast, by Horsepower 2020 & 2033
- Table 28: Global Tractor Industry Revenue Million Forecast, by Drive Type 2020 & 2033
- Table 29: Global Tractor Industry Revenue Million Forecast, by Country 2020 & 2033
- Table 30: South America Tractor Industry Revenue (Million) Forecast, by Application 2020 & 2033
- Table 31: Middle East and Africa Tractor Industry Revenue (Million) Forecast, by Application 2020 & 2033
Frequently Asked Questions
1. What is the projected Compound Annual Growth Rate (CAGR) of the Tractor Industry?
The projected CAGR is approximately 5.90%.
2. Which companies are prominent players in the Tractor Industry?
Key companies in the market include Escorts Limited, Deere and Company, Kubota Corporation, CNH Global NV (includes New Holland and Case IH), Yanmar Company Limited, Kuhn Group (Subsidiary of Bucher Industries), Deutz-Fah, Mahindra and Mahindra Corporation, CLAAS KGaA mbH, Tractors and Farm Equipment Limited (TAFE), AGCO Corporation (includes Massey Ferguson Valtra Fendt and Challenger).
3. What are the main segments of the Tractor Industry?
The market segments include Horsepower, Drive Type.
4. Can you provide details about the market size?
The market size is estimated to be USD 84.80 Million as of 2022.
5. What are some drivers contributing to market growth?
Rising Residential Activities in Addition to Consumer Spending to Enhance Market Demand.
6. What are the notable trends driving market growth?
The Below 40 HP Tractors Segment's Growth is Expected to be Bolstered over the Next Five Years.
7. Are there any restraints impacting market growth?
Rising Electric Vehicle Adoption to Hinder Market Growth in the Long Run.
8. Can you provide examples of recent developments in the market?
March 2024: Hyster Company announced an agreement to provide APM Terminals with 10 battery-powered terminal tractors for their location at the Port of Mobile in Alabama. The electric terminal tractors, which are scheduled to be delivered in 2024, are part of a USD 60 million investment in port equipment electrification pilots by APM Terminals.
9. What pricing options are available for accessing the report?
Pricing options include single-user, multi-user, and enterprise licenses priced at USD 4750, USD 5250, and USD 8750 respectively.
10. Is the market size provided in terms of value or volume?
The market size is provided in terms of value, measured in Million.
11. Are there any specific market keywords associated with the report?
Yes, the market keyword associated with the report is "Tractor Industry," which aids in identifying and referencing the specific market segment covered.
12. How do I determine which pricing option suits my needs best?
The pricing options vary based on user requirements and access needs. Individual users may opt for single-user licenses, while businesses requiring broader access may choose multi-user or enterprise licenses for cost-effective access to the report.
13. Are there any additional resources or data provided in the Tractor Industry report?
While the report offers comprehensive insights, it's advisable to review the specific contents or supplementary materials provided to ascertain if additional resources or data are available.
14. How can I stay updated on further developments or reports in the Tractor Industry?
To stay informed about further developments, trends, and reports in the Tractor Industry, consider subscribing to industry newsletters, following relevant companies and organizations, or regularly checking reputable industry news sources and publications.
Methodology
Step 1 - Identification of Relevant Samples Size from Population Database


Step 2 - Approaches for Defining Global Market Size (Value, Volume* & Price*)

Note*: In applicable scenarios
Step 3 - Data Sources
Primary Research
- Web Analytics
- Survey Reports
- Research Institute
- Latest Research Reports
- Opinion Leaders
Secondary Research
- Annual Reports
- White Paper
- Latest Press Release
- Industry Association
- Paid Database
- Investor Presentations

Step 4 - Data Triangulation
Involves using different sources of information in order to increase the validity of a study
These sources are likely to be stakeholders in a program - participants, other researchers, program staff, other community members, and so on.
Then we put all data in single framework & apply various statistical tools to find out the dynamic on the market.
During the analysis stage, feedback from the stakeholder groups would be compared to determine areas of agreement as well as areas of divergence