

Key Insights
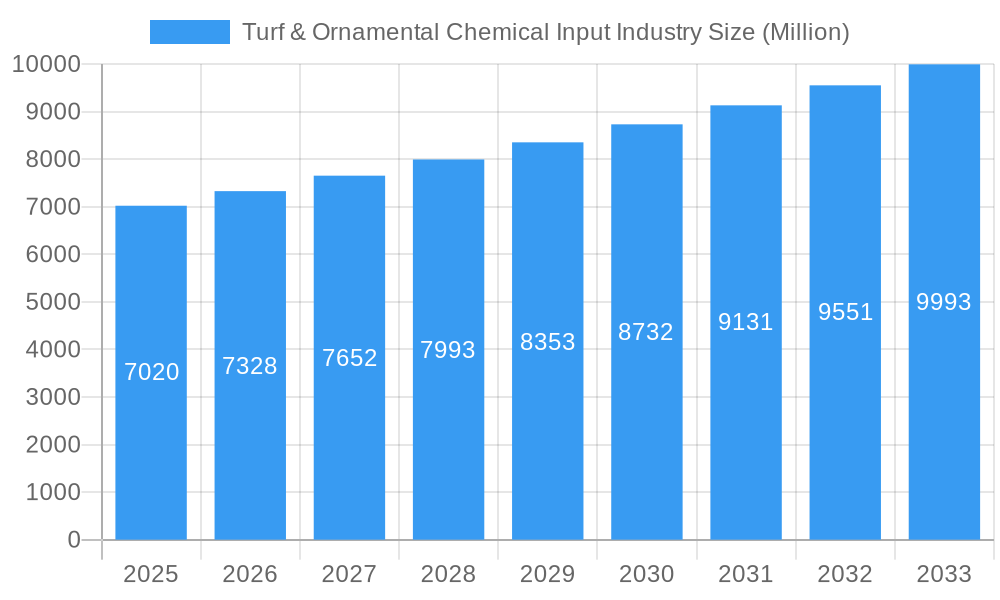
The Turf & Ornamental Chemical Input market, valued at $7.02 billion in 2025, is projected to experience robust growth, driven by increasing urbanization, landscaping trends, and the rising demand for aesthetically pleasing green spaces in both residential and commercial sectors. The market's Compound Annual Growth Rate (CAGR) of 4.34% from 2025 to 2033 indicates a steady expansion, fueled by advancements in chemical formulations offering improved efficacy, reduced environmental impact, and targeted application methods. Key segments contributing significantly to this growth include pesticides for disease and pest control, fertilizers for enhanced nutrient uptake and turf health, and plant growth regulators for optimized plant development. The diverse range of turf grasses, encompassing Bermuda, Zoysia, and Kentucky Bluegrass, along with the varied ornamental grasses like feather reed grass and fountain grass, further diversify the market and fuel demand for specialized chemical inputs. North America and Europe currently hold substantial market shares, while the Asia-Pacific region is poised for significant growth due to rapid economic development and rising disposable incomes. Competition among major players such as FMC Corporation, Bayer Crop Sciences, and Syngenta is intense, driving innovation and the development of more sustainable and efficient products.
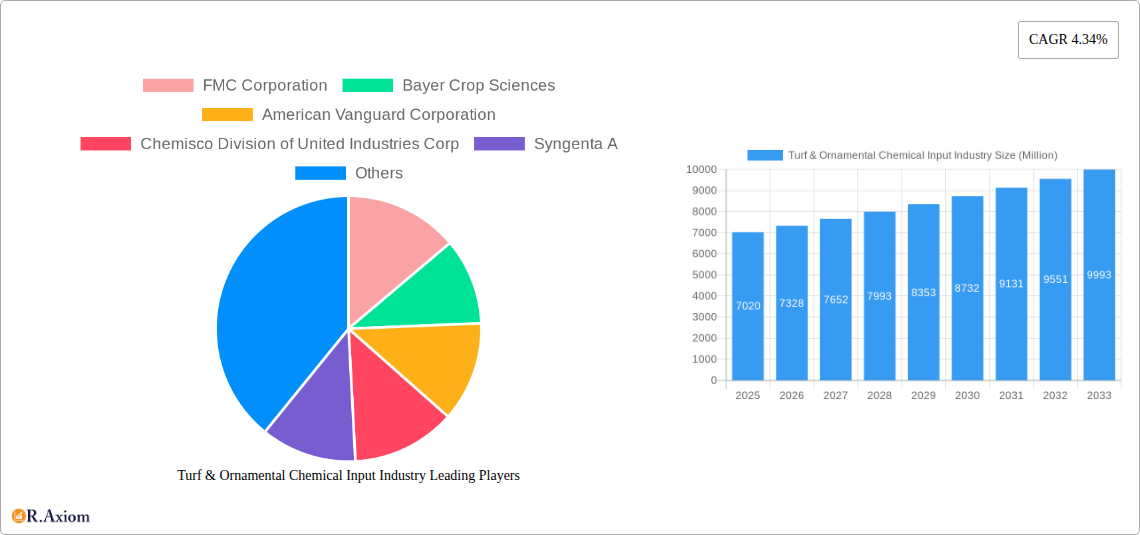
Turf & Ornamental Chemical Input Industry Market Size (In Billion)
The market faces some restraints, primarily related to environmental concerns surrounding pesticide use and increasing regulatory scrutiny. However, the industry is actively responding through the development of bio-pesticides and other eco-friendly alternatives, mitigating these challenges. Furthermore, technological advancements in precision agriculture, including drone-based spraying and sensor-based monitoring, offer opportunities for improved efficiency and reduced chemical input usage. The continued emphasis on sustainable landscaping practices and the growing awareness of turf and ornamental plant health will be crucial drivers of future market expansion, contributing to the overall positive growth trajectory predicted for the coming decade.
Turf & Ornamental Chemical Input Industry Company Market Share
Turf & Ornamental Chemical Input Industry: A Comprehensive Market Report (2019-2033)
This comprehensive report provides an in-depth analysis of the Turf & Ornamental Chemical Input industry, covering market size, segmentation, growth drivers, challenges, and key players. The study period spans from 2019 to 2033, with 2025 serving as the base and estimated year. The forecast period extends from 2025 to 2033, while the historical period encompasses 2019-2024. This report is essential for industry stakeholders, investors, and businesses seeking to understand and navigate this dynamic market.
Turf & Ornamental Chemical Input Industry Market Concentration & Innovation
The Turf & Ornamental Chemical Input industry exhibits a moderately concentrated market structure, with a few multinational corporations holding significant market share. Companies like FMC Corporation, Bayer Crop Sciences, and Syngenta A command a substantial portion of the global market, exceeding xx Million in revenue each. However, a number of smaller, specialized companies, such as Precision Laboratories and Gowan International, also play a crucial role, catering to niche segments and regional markets. Market share fluctuations are influenced by factors including R&D investments, product innovation, and successful M&A activities.
Innovation is a major driver in this sector. Companies continuously invest in developing new and improved chemical inputs with enhanced efficacy, environmental sustainability, and reduced health risks. Stringent regulatory frameworks, such as those concerning pesticide registration and usage, necessitate continuous innovation to meet evolving compliance requirements. The rise of bio-pesticides and bio-fertilizers presents a significant opportunity for innovation, driven by increasing consumer demand for environmentally friendly products. Substitutes like organic methods and integrated pest management (IPM) strategies pose a competitive challenge, prompting manufacturers to focus on developing differentiated and superior products. End-user trends, including the growing demand for high-quality turf and ornamental plants in landscaping and golf courses, further fuel innovation in this space. The total M&A deal value in the industry between 2019 and 2024 was estimated at xx Million.
- Key Players: FMC Corporation, Bayer Crop Sciences, Syngenta A, American Vanguard Corporation, BASF SE
- Innovation Focus: Biopesticides, enhanced efficacy, reduced environmental impact, IPM compatible products.
- Regulatory Landscape: Stringent regulations driving innovation towards safer and more sustainable solutions.
Turf & Ornamental Chemical Input Industry Industry Trends & Insights
The Turf & Ornamental Chemical Input industry is experiencing robust growth, driven by several key factors. The increasing urbanization and growing disposable incomes across the globe have fueled demand for aesthetically pleasing landscapes in residential, commercial, and recreational areas. This has led to increased use of turf and ornamental plants, driving the demand for chemical inputs. The global market size is estimated at xx Million in 2025 and is projected to reach xx Million by 2033, exhibiting a CAGR of xx%. Technological advancements have led to the development of more effective and targeted chemical inputs, improving pest and disease control while minimizing environmental impact. The rising consumer preference for eco-friendly products is pushing manufacturers to invest in research and development of bio-based and sustainable solutions. Market penetration of bio-pesticides and other sustainable inputs is increasing steadily, though traditional chemical inputs still dominate the market. Competitive dynamics are intensified by consolidation through M&A activities and the continuous introduction of innovative products.
Dominant Markets & Segments in Turf & Ornamental Chemical Input Industry
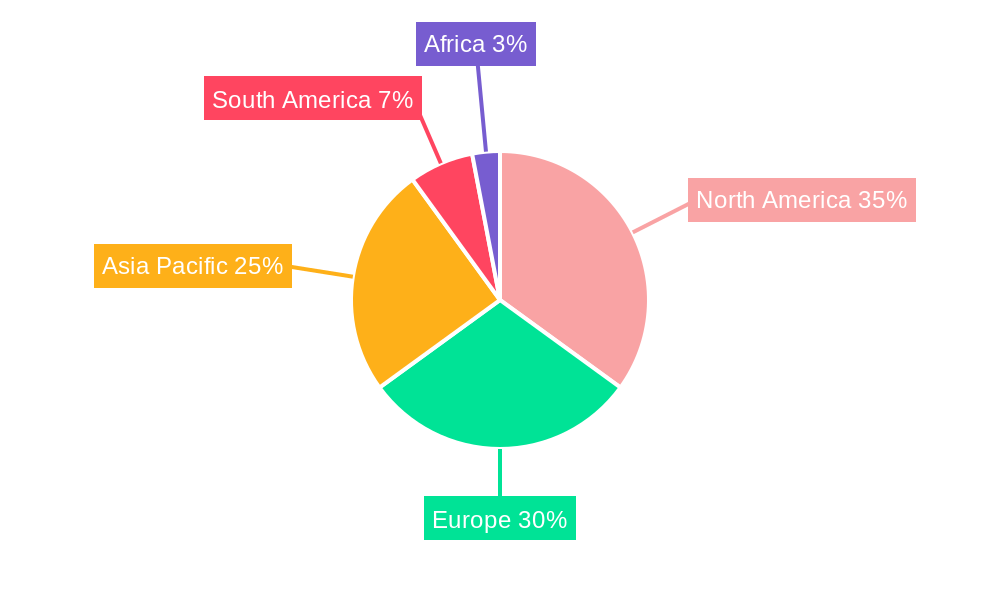
The North American and European regions dominate the Turf & Ornamental Chemical Input industry, driven by high per capita income, established landscaping practices, and a strong preference for aesthetically pleasing outdoor spaces. Within the segments, pesticides continue to hold the largest market share amongst synthetic chemical inputs, followed by fertilizers and plant growth regulators. Amongst turf grasses, Bermuda grass and Zoysia grass are the dominant segments due to their widespread use in warm climates. The ornamental grass segment is highly diversified, with Feather Reed Grass and Fountain Grass being the most popular choices.
- Key Drivers for Dominant Regions: High disposable income, established landscaping industry, favorable government policies, and well-developed distribution networks.
- Key Drivers for Dominant Segments: Established use patterns, efficacy against prevalent pests and diseases, and established supply chains.
The continued popularity of Bermuda and Zoysia grasses fuels the demand for related chemical inputs, while the diversified ornamental grass market reflects varied aesthetic preferences. Growth in developing economies, such as those in Asia and Latin America, presents significant future growth potential.
Turf & Ornamental Chemical Input Industry Product Developments
Recent product developments in the industry showcase a shift towards higher efficacy, broader spectrum, and environmentally friendly solutions. The introduction of BASF's Pillar SC Intrinsic brand fungicide, providing broad-spectrum disease control, highlights this trend. Similarly, Syngenta's acquisition of next-gen bioinsecticides demonstrates the growing interest in sustainable pest control. These developments enhance disease and pest management while mitigating environmental impact. The development of targeted chemical inputs with minimal off-target effects further reflects the industry's commitment to sustainability. The market is witnessing a surge in products specifically designed for various turf types, enhancing the effectiveness of treatments.
Report Scope & Segmentation Analysis
This report segments the Turf & Ornamental Chemical Input market based on several key factors:
Type of Turf Grass: Bermuda Grass, Zoysia Grass, Blue Kentucky Grass, Rye Grass, Tall Fescue, Others. Each segment shows varying growth projections based on regional preferences and climatic conditions. Market sizes for each segment are calculated based on sales volume and value, and competitive dynamics are assessed based on market share and product portfolio.
Type of Ornamental Grass: Feather Reed Grass, Fountain Grass, Purple Millet, Ravenna Grass, Fibre Optic Grass, Others. Similar to turf grass, this segment’s growth is driven by consumer preferences, landscaping trends, and regional climatic suitability.
Synthetic Chemical Inputs: Pesticides, Fertilizers, Plant Growth Regulators, Others. Growth within each sub-segment is influenced by factors such as pest prevalence, fertilizer needs based on soil conditions, and the demand for plant growth regulation techniques.
Growth projections vary across segments depending on the market dynamics influencing each.
Key Drivers of Turf & Ornamental Chemical Input Industry Growth
The Turf & Ornamental Chemical Input industry's growth is driven by a confluence of factors. Increased urbanization and rising disposable incomes are creating a larger consumer base for landscaping and turf maintenance services. Government initiatives promoting green spaces and improved infrastructure, such as parks and golf courses, are boosting industry demand. Advances in chemical formulations, including bio-based and more environmentally friendly products, are creating new opportunities. Stricter regulations on environmental protection are encouraging innovation towards sustainable and efficient chemical inputs.
Challenges in the Turf & Ornamental Chemical Input Industry Sector
Several challenges impact the Turf & Ornamental Chemical Input industry. Stringent environmental regulations and increasing compliance costs affect profitability. Fluctuations in raw material prices and supply chain disruptions pose significant operational hurdles. Intense competition from both established players and emerging companies creates pricing pressures. Consumer concerns about the environmental impact of chemical inputs and growing acceptance of organic alternatives necessitate adaptation and innovation within the industry. The estimated impact of these challenges on the industry's overall revenue is approximately xx Million annually.
Emerging Opportunities in Turf & Ornamental Chemical Input Industry
The industry presents several opportunities. The increasing adoption of precision agriculture technologies, such as drone-based application and smart irrigation, offers opportunities for targeted and efficient chemical input usage. The growing demand for environmentally friendly products creates a market for biopesticides, biofertilizers, and other sustainable solutions. Expanding into emerging markets in developing countries presents significant growth potential. Technological innovations in formulation and delivery systems will lead to better efficacy and reduced environmental impact, creating new market opportunities.
Leading Players in the Turf & Ornamental Chemical Input Industry Market
- FMC Corporation
- Bayer Crop Sciences
- American Vanguard Corporation
- Chemisco Division of United Industries Corp
- Syngenta AG
- Precision Laboratories
- DowDuPont
- Monsanto Company
- Gowan International
- Chemtura Agro Solutions
- Adama Agricultural Solutions
- Koch Agronomic Services LLC
- Nufarm Ltd
- BASF SE
Key Developments in Turf & Ornamental Chemical Input Industry
March 2022: BASF introduced Pillar SC Intrinsic brand fungicide, a broad-spectrum solution for various turf diseases. This launch significantly impacted the fungicide market, enhancing BASF's position in the sector.
January 2022: Syngenta's acquisition of "Nematrident" and "Unispore" bioinsecticides broadened its product portfolio and strengthened its position in the sustainable pest control segment.
Strategic Outlook for Turf & Ornamental Chemical Input Industry Market
The Turf & Ornamental Chemical Input market shows promising growth potential. Continued urbanization, rising disposable incomes, and the growing demand for aesthetically pleasing landscapes will drive market expansion. The focus on sustainable and environmentally friendly solutions will fuel innovation and create new market opportunities. Strategic partnerships, acquisitions, and investments in R&D will be crucial for maintaining a competitive edge. The market is poised for steady growth, fueled by technological advancements and evolving consumer preferences.
Turf & Ornamental Chemical Input Industry Segmentation
-
1. Type of Turf Grass
- 1.1. Bermuda Grass
- 1.2. Zoysia Grass
- 1.3. Blue Kentucky Grass
- 1.4. Rye Grass
- 1.5. Tall Fescue
- 1.6. Others
-
2. Type of Ornamental Grass
- 2.1. Feather Reed Grass
- 2.2. Fountain Grass
- 2.3. Purple Millet
- 2.4. Ravenna Grass
- 2.5. Fibre Optic Grass
- 2.6. Others
-
3. Synthetic Chemical Inputs
- 3.1. Pesticides
- 3.2. Fertilizers
- 3.3. Plant Growth Regulators
- 3.4. Others
-
4. Type of Turf Grass
- 4.1. Bermuda Grass
- 4.2. Zoysia Grass
- 4.3. Blue Kentucky Grass
- 4.4. Rye Grass
- 4.5. Tall Fescue
- 4.6. Others
-
5. Type of Ornamental Grass
- 5.1. Feather Reed Grass
- 5.2. Fountain Grass
- 5.3. Purple Millet
- 5.4. Ravenna Grass
- 5.5. Fibre Optic Grass
- 5.6. Others
-
6. Synthetic Chemical Inputs
- 6.1. Pesticides
- 6.2. Fertilizers
- 6.3. Plant Growth Regulators
- 6.4. Others
Turf & Ornamental Chemical Input Industry Segmentation By Geography
-
1. North America
- 1.1. United States
- 1.2. Canada
- 1.3. Mexico
- 1.4. Rest of North America
-
2. Europe
- 2.1. Spain
- 2.2. United Kingdom
- 2.3. France
- 2.4. Germany
- 2.5. Denmark
- 2.6. Italy
- 2.7. Rest of Europe
-
3. Asia Pacific
- 3.1. China
- 3.2. India
- 3.3. Japan
- 3.4. Thailand
- 3.5. Australia
- 3.6. Rest of Asia Pacific
-
4. South America
- 4.1. Brazil
- 4.2. Argentina
- 4.3. Rest of South America
-
5. Africa
- 5.1. South Africa
- 5.2. Rest of Africa
Turf & Ornamental Chemical Input Industry Regional Market Share
Geographic Coverage of Turf & Ornamental Chemical Input Industry
Turf & Ornamental Chemical Input Industry REPORT HIGHLIGHTS
| Aspects | Details |
|---|---|
| Study Period | 2020-2034 |
| Base Year | 2025 |
| Estimated Year | 2026 |
| Forecast Period | 2026-2034 |
| Historical Period | 2020-2025 |
| Growth Rate | CAGR of 4.34% from 2020-2034 |
| Segmentation |
|
Table of Contents
- 1. Introduction
- 1.1. Research Scope
- 1.2. Market Segmentation
- 1.3. Research Objective
- 1.4. Definitions and Assumptions
- 2. Executive Summary
- 2.1. Market Snapshot
- 3. Market Dynamics
- 3.1. Market Drivers
- 3.2. Market Restrains
- 3.3. Market Trends
- 3.4. Market Opportunities
- 4. Market Factor Analysis
- 4.1. Porters Five Forces
- 4.1.1. Bargaining Power of Suppliers
- 4.1.2. Bargaining Power of Buyers
- 4.1.3. Threat of New Entrants
- 4.1.4. Threat of Substitutes
- 4.1.5. Competitive Rivalry
- 4.2. PESTEL analysis
- 4.3. BCG Analysis
- 4.3.1. Stars (High Growth, High Market Share)
- 4.3.2. Cash Cows (Low Growth, High Market Share)
- 4.3.3. Question Mark (High Growth, Low Market Share)
- 4.3.4. Dogs (Low Growth, Low Market Share)
- 4.4. Ansoff Matrix Analysis
- 4.5. Supply Chain Analysis
- 4.6. Regulatory Landscape
- 4.7. Current Market Potential and Opportunity Assessment (TAM–SAM–SOM Framework)
- 4.8. RAX Analyst Note
- 4.1. Porters Five Forces
- 5. Market Analysis, Insights and Forecast 2021-2033
- 5.1. Market Analysis, Insights and Forecast - by Type of Turf Grass
- 5.1.1. Bermuda Grass
- 5.1.2. Zoysia Grass
- 5.1.3. Blue Kentucky Grass
- 5.1.4. Rye Grass
- 5.1.5. Tall Fescue
- 5.1.6. Others
- 5.2. Market Analysis, Insights and Forecast - by Type of Ornamental Grass
- 5.2.1. Feather Reed Grass
- 5.2.2. Fountain Grass
- 5.2.3. Purple Millet
- 5.2.4. Ravenna Grass
- 5.2.5. Fibre Optic Grass
- 5.2.6. Others
- 5.3. Market Analysis, Insights and Forecast - by Synthetic Chemical Inputs
- 5.3.1. Pesticides
- 5.3.2. Fertilizers
- 5.3.3. Plant Growth Regulators
- 5.3.4. Others
- 5.4. Market Analysis, Insights and Forecast - by Type of Turf Grass
- 5.4.1. Bermuda Grass
- 5.4.2. Zoysia Grass
- 5.4.3. Blue Kentucky Grass
- 5.4.4. Rye Grass
- 5.4.5. Tall Fescue
- 5.4.6. Others
- 5.5. Market Analysis, Insights and Forecast - by Type of Ornamental Grass
- 5.5.1. Feather Reed Grass
- 5.5.2. Fountain Grass
- 5.5.3. Purple Millet
- 5.5.4. Ravenna Grass
- 5.5.5. Fibre Optic Grass
- 5.5.6. Others
- 5.6. Market Analysis, Insights and Forecast - by Synthetic Chemical Inputs
- 5.6.1. Pesticides
- 5.6.2. Fertilizers
- 5.6.3. Plant Growth Regulators
- 5.6.4. Others
- 5.7. Market Analysis, Insights and Forecast - by Region
- 5.7.1. North America
- 5.7.2. Europe
- 5.7.3. Asia Pacific
- 5.7.4. South America
- 5.7.5. Africa
- 5.1. Market Analysis, Insights and Forecast - by Type of Turf Grass
- 6. Global Turf & Ornamental Chemical Input Industry Analysis, Insights and Forecast, 2021-2033
- 6.1. Market Analysis, Insights and Forecast - by Type of Turf Grass
- 6.1.1. Bermuda Grass
- 6.1.2. Zoysia Grass
- 6.1.3. Blue Kentucky Grass
- 6.1.4. Rye Grass
- 6.1.5. Tall Fescue
- 6.1.6. Others
- 6.2. Market Analysis, Insights and Forecast - by Type of Ornamental Grass
- 6.2.1. Feather Reed Grass
- 6.2.2. Fountain Grass
- 6.2.3. Purple Millet
- 6.2.4. Ravenna Grass
- 6.2.5. Fibre Optic Grass
- 6.2.6. Others
- 6.3. Market Analysis, Insights and Forecast - by Synthetic Chemical Inputs
- 6.3.1. Pesticides
- 6.3.2. Fertilizers
- 6.3.3. Plant Growth Regulators
- 6.3.4. Others
- 6.4. Market Analysis, Insights and Forecast - by Type of Turf Grass
- 6.4.1. Bermuda Grass
- 6.4.2. Zoysia Grass
- 6.4.3. Blue Kentucky Grass
- 6.4.4. Rye Grass
- 6.4.5. Tall Fescue
- 6.4.6. Others
- 6.5. Market Analysis, Insights and Forecast - by Type of Ornamental Grass
- 6.5.1. Feather Reed Grass
- 6.5.2. Fountain Grass
- 6.5.3. Purple Millet
- 6.5.4. Ravenna Grass
- 6.5.5. Fibre Optic Grass
- 6.5.6. Others
- 6.6. Market Analysis, Insights and Forecast - by Synthetic Chemical Inputs
- 6.6.1. Pesticides
- 6.6.2. Fertilizers
- 6.6.3. Plant Growth Regulators
- 6.6.4. Others
- 6.1. Market Analysis, Insights and Forecast - by Type of Turf Grass
- 7. North America Turf & Ornamental Chemical Input Industry Analysis, Insights and Forecast, 2020-2032
- 7.1. Market Analysis, Insights and Forecast - by Type of Turf Grass
- 7.1.1. Bermuda Grass
- 7.1.2. Zoysia Grass
- 7.1.3. Blue Kentucky Grass
- 7.1.4. Rye Grass
- 7.1.5. Tall Fescue
- 7.1.6. Others
- 7.2. Market Analysis, Insights and Forecast - by Type of Ornamental Grass
- 7.2.1. Feather Reed Grass
- 7.2.2. Fountain Grass
- 7.2.3. Purple Millet
- 7.2.4. Ravenna Grass
- 7.2.5. Fibre Optic Grass
- 7.2.6. Others
- 7.3. Market Analysis, Insights and Forecast - by Synthetic Chemical Inputs
- 7.3.1. Pesticides
- 7.3.2. Fertilizers
- 7.3.3. Plant Growth Regulators
- 7.3.4. Others
- 7.4. Market Analysis, Insights and Forecast - by Type of Turf Grass
- 7.4.1. Bermuda Grass
- 7.4.2. Zoysia Grass
- 7.4.3. Blue Kentucky Grass
- 7.4.4. Rye Grass
- 7.4.5. Tall Fescue
- 7.4.6. Others
- 7.5. Market Analysis, Insights and Forecast - by Type of Ornamental Grass
- 7.5.1. Feather Reed Grass
- 7.5.2. Fountain Grass
- 7.5.3. Purple Millet
- 7.5.4. Ravenna Grass
- 7.5.5. Fibre Optic Grass
- 7.5.6. Others
- 7.6. Market Analysis, Insights and Forecast - by Synthetic Chemical Inputs
- 7.6.1. Pesticides
- 7.6.2. Fertilizers
- 7.6.3. Plant Growth Regulators
- 7.6.4. Others
- 7.1. Market Analysis, Insights and Forecast - by Type of Turf Grass
- 8. Europe Turf & Ornamental Chemical Input Industry Analysis, Insights and Forecast, 2020-2032
- 8.1. Market Analysis, Insights and Forecast - by Type of Turf Grass
- 8.1.1. Bermuda Grass
- 8.1.2. Zoysia Grass
- 8.1.3. Blue Kentucky Grass
- 8.1.4. Rye Grass
- 8.1.5. Tall Fescue
- 8.1.6. Others
- 8.2. Market Analysis, Insights and Forecast - by Type of Ornamental Grass
- 8.2.1. Feather Reed Grass
- 8.2.2. Fountain Grass
- 8.2.3. Purple Millet
- 8.2.4. Ravenna Grass
- 8.2.5. Fibre Optic Grass
- 8.2.6. Others
- 8.3. Market Analysis, Insights and Forecast - by Synthetic Chemical Inputs
- 8.3.1. Pesticides
- 8.3.2. Fertilizers
- 8.3.3. Plant Growth Regulators
- 8.3.4. Others
- 8.4. Market Analysis, Insights and Forecast - by Type of Turf Grass
- 8.4.1. Bermuda Grass
- 8.4.2. Zoysia Grass
- 8.4.3. Blue Kentucky Grass
- 8.4.4. Rye Grass
- 8.4.5. Tall Fescue
- 8.4.6. Others
- 8.5. Market Analysis, Insights and Forecast - by Type of Ornamental Grass
- 8.5.1. Feather Reed Grass
- 8.5.2. Fountain Grass
- 8.5.3. Purple Millet
- 8.5.4. Ravenna Grass
- 8.5.5. Fibre Optic Grass
- 8.5.6. Others
- 8.6. Market Analysis, Insights and Forecast - by Synthetic Chemical Inputs
- 8.6.1. Pesticides
- 8.6.2. Fertilizers
- 8.6.3. Plant Growth Regulators
- 8.6.4. Others
- 8.1. Market Analysis, Insights and Forecast - by Type of Turf Grass
- 9. Asia Pacific Turf & Ornamental Chemical Input Industry Analysis, Insights and Forecast, 2020-2032
- 9.1. Market Analysis, Insights and Forecast - by Type of Turf Grass
- 9.1.1. Bermuda Grass
- 9.1.2. Zoysia Grass
- 9.1.3. Blue Kentucky Grass
- 9.1.4. Rye Grass
- 9.1.5. Tall Fescue
- 9.1.6. Others
- 9.2. Market Analysis, Insights and Forecast - by Type of Ornamental Grass
- 9.2.1. Feather Reed Grass
- 9.2.2. Fountain Grass
- 9.2.3. Purple Millet
- 9.2.4. Ravenna Grass
- 9.2.5. Fibre Optic Grass
- 9.2.6. Others
- 9.3. Market Analysis, Insights and Forecast - by Synthetic Chemical Inputs
- 9.3.1. Pesticides
- 9.3.2. Fertilizers
- 9.3.3. Plant Growth Regulators
- 9.3.4. Others
- 9.4. Market Analysis, Insights and Forecast - by Type of Turf Grass
- 9.4.1. Bermuda Grass
- 9.4.2. Zoysia Grass
- 9.4.3. Blue Kentucky Grass
- 9.4.4. Rye Grass
- 9.4.5. Tall Fescue
- 9.4.6. Others
- 9.5. Market Analysis, Insights and Forecast - by Type of Ornamental Grass
- 9.5.1. Feather Reed Grass
- 9.5.2. Fountain Grass
- 9.5.3. Purple Millet
- 9.5.4. Ravenna Grass
- 9.5.5. Fibre Optic Grass
- 9.5.6. Others
- 9.6. Market Analysis, Insights and Forecast - by Synthetic Chemical Inputs
- 9.6.1. Pesticides
- 9.6.2. Fertilizers
- 9.6.3. Plant Growth Regulators
- 9.6.4. Others
- 9.1. Market Analysis, Insights and Forecast - by Type of Turf Grass
- 10. South America Turf & Ornamental Chemical Input Industry Analysis, Insights and Forecast, 2020-2032
- 10.1. Market Analysis, Insights and Forecast - by Type of Turf Grass
- 10.1.1. Bermuda Grass
- 10.1.2. Zoysia Grass
- 10.1.3. Blue Kentucky Grass
- 10.1.4. Rye Grass
- 10.1.5. Tall Fescue
- 10.1.6. Others
- 10.2. Market Analysis, Insights and Forecast - by Type of Ornamental Grass
- 10.2.1. Feather Reed Grass
- 10.2.2. Fountain Grass
- 10.2.3. Purple Millet
- 10.2.4. Ravenna Grass
- 10.2.5. Fibre Optic Grass
- 10.2.6. Others
- 10.3. Market Analysis, Insights and Forecast - by Synthetic Chemical Inputs
- 10.3.1. Pesticides
- 10.3.2. Fertilizers
- 10.3.3. Plant Growth Regulators
- 10.3.4. Others
- 10.4. Market Analysis, Insights and Forecast - by Type of Turf Grass
- 10.4.1. Bermuda Grass
- 10.4.2. Zoysia Grass
- 10.4.3. Blue Kentucky Grass
- 10.4.4. Rye Grass
- 10.4.5. Tall Fescue
- 10.4.6. Others
- 10.5. Market Analysis, Insights and Forecast - by Type of Ornamental Grass
- 10.5.1. Feather Reed Grass
- 10.5.2. Fountain Grass
- 10.5.3. Purple Millet
- 10.5.4. Ravenna Grass
- 10.5.5. Fibre Optic Grass
- 10.5.6. Others
- 10.6. Market Analysis, Insights and Forecast - by Synthetic Chemical Inputs
- 10.6.1. Pesticides
- 10.6.2. Fertilizers
- 10.6.3. Plant Growth Regulators
- 10.6.4. Others
- 10.1. Market Analysis, Insights and Forecast - by Type of Turf Grass
- 11. Africa Turf & Ornamental Chemical Input Industry Analysis, Insights and Forecast, 2020-2032
- 11.1. Market Analysis, Insights and Forecast - by Type of Turf Grass
- 11.1.1. Bermuda Grass
- 11.1.2. Zoysia Grass
- 11.1.3. Blue Kentucky Grass
- 11.1.4. Rye Grass
- 11.1.5. Tall Fescue
- 11.1.6. Others
- 11.2. Market Analysis, Insights and Forecast - by Type of Ornamental Grass
- 11.2.1. Feather Reed Grass
- 11.2.2. Fountain Grass
- 11.2.3. Purple Millet
- 11.2.4. Ravenna Grass
- 11.2.5. Fibre Optic Grass
- 11.2.6. Others
- 11.3. Market Analysis, Insights and Forecast - by Synthetic Chemical Inputs
- 11.3.1. Pesticides
- 11.3.2. Fertilizers
- 11.3.3. Plant Growth Regulators
- 11.3.4. Others
- 11.4. Market Analysis, Insights and Forecast - by Type of Turf Grass
- 11.4.1. Bermuda Grass
- 11.4.2. Zoysia Grass
- 11.4.3. Blue Kentucky Grass
- 11.4.4. Rye Grass
- 11.4.5. Tall Fescue
- 11.4.6. Others
- 11.5. Market Analysis, Insights and Forecast - by Type of Ornamental Grass
- 11.5.1. Feather Reed Grass
- 11.5.2. Fountain Grass
- 11.5.3. Purple Millet
- 11.5.4. Ravenna Grass
- 11.5.5. Fibre Optic Grass
- 11.5.6. Others
- 11.6. Market Analysis, Insights and Forecast - by Synthetic Chemical Inputs
- 11.6.1. Pesticides
- 11.6.2. Fertilizers
- 11.6.3. Plant Growth Regulators
- 11.6.4. Others
- 11.1. Market Analysis, Insights and Forecast - by Type of Turf Grass
- 12. Competitive Analysis
- 12.1. Company Profiles
- 12.1.1 FMC Corporation
- 12.1.1.1. Company Overview
- 12.1.1.2. Products
- 12.1.1.3. Company Financials
- 12.1.1.4. SWOT Analysis
- 12.1.2 Bayer Crop Sciences
- 12.1.2.1. Company Overview
- 12.1.2.2. Products
- 12.1.2.3. Company Financials
- 12.1.2.4. SWOT Analysis
- 12.1.3 American Vanguard Corporation
- 12.1.3.1. Company Overview
- 12.1.3.2. Products
- 12.1.3.3. Company Financials
- 12.1.3.4. SWOT Analysis
- 12.1.4 Chemisco Division of United Industries Corp
- 12.1.4.1. Company Overview
- 12.1.4.2. Products
- 12.1.4.3. Company Financials
- 12.1.4.4. SWOT Analysis
- 12.1.5 Syngenta A
- 12.1.5.1. Company Overview
- 12.1.5.2. Products
- 12.1.5.3. Company Financials
- 12.1.5.4. SWOT Analysis
- 12.1.6 Precision Laboratories
- 12.1.6.1. Company Overview
- 12.1.6.2. Products
- 12.1.6.3. Company Financials
- 12.1.6.4. SWOT Analysis
- 12.1.7 DowDuPont
- 12.1.7.1. Company Overview
- 12.1.7.2. Products
- 12.1.7.3. Company Financials
- 12.1.7.4. SWOT Analysis
- 12.1.8 Monsanto Company
- 12.1.8.1. Company Overview
- 12.1.8.2. Products
- 12.1.8.3. Company Financials
- 12.1.8.4. SWOT Analysis
- 12.1.9 Gowan International
- 12.1.9.1. Company Overview
- 12.1.9.2. Products
- 12.1.9.3. Company Financials
- 12.1.9.4. SWOT Analysis
- 12.1.10 Chemtura Agro Solutions
- 12.1.10.1. Company Overview
- 12.1.10.2. Products
- 12.1.10.3. Company Financials
- 12.1.10.4. SWOT Analysis
- 12.1.11 Adama Agricultural Solutions
- 12.1.11.1. Company Overview
- 12.1.11.2. Products
- 12.1.11.3. Company Financials
- 12.1.11.4. SWOT Analysis
- 12.1.12 Koch Agronomic Services LLC
- 12.1.12.1. Company Overview
- 12.1.12.2. Products
- 12.1.12.3. Company Financials
- 12.1.12.4. SWOT Analysis
- 12.1.13 Nufarm Ltd
- 12.1.13.1. Company Overview
- 12.1.13.2. Products
- 12.1.13.3. Company Financials
- 12.1.13.4. SWOT Analysis
- 12.1.14 BASF SE
- 12.1.14.1. Company Overview
- 12.1.14.2. Products
- 12.1.14.3. Company Financials
- 12.1.14.4. SWOT Analysis
- 12.1.1 FMC Corporation
- 12.2. Market Entropy
- 12.2.1 Company's Key Areas Served
- 12.2.2 Recent Developments
- 12.3. Company Market Share Analysis 2025
- 12.3.1 Top 5 Companies Market Share Analysis
- 12.3.2 Top 3 Companies Market Share Analysis
- 12.4. List of Potential Customers
- 13. Research Methodology
List of Figures
- Figure 1: Global Turf & Ornamental Chemical Input Industry Revenue Breakdown (Million, %) by Region 2025 & 2033
- Figure 2: Global Turf & Ornamental Chemical Input Industry Volume Breakdown (Kiloton, %) by Region 2025 & 2033
- Figure 3: North America Turf & Ornamental Chemical Input Industry Revenue (Million), by Type of Turf Grass 2025 & 2033
- Figure 4: North America Turf & Ornamental Chemical Input Industry Volume (Kiloton), by Type of Turf Grass 2025 & 2033
- Figure 5: North America Turf & Ornamental Chemical Input Industry Revenue Share (%), by Type of Turf Grass 2025 & 2033
- Figure 6: North America Turf & Ornamental Chemical Input Industry Volume Share (%), by Type of Turf Grass 2025 & 2033
- Figure 7: North America Turf & Ornamental Chemical Input Industry Revenue (Million), by Type of Ornamental Grass 2025 & 2033
- Figure 8: North America Turf & Ornamental Chemical Input Industry Volume (Kiloton), by Type of Ornamental Grass 2025 & 2033
- Figure 9: North America Turf & Ornamental Chemical Input Industry Revenue Share (%), by Type of Ornamental Grass 2025 & 2033
- Figure 10: North America Turf & Ornamental Chemical Input Industry Volume Share (%), by Type of Ornamental Grass 2025 & 2033
- Figure 11: North America Turf & Ornamental Chemical Input Industry Revenue (Million), by Synthetic Chemical Inputs 2025 & 2033
- Figure 12: North America Turf & Ornamental Chemical Input Industry Volume (Kiloton), by Synthetic Chemical Inputs 2025 & 2033
- Figure 13: North America Turf & Ornamental Chemical Input Industry Revenue Share (%), by Synthetic Chemical Inputs 2025 & 2033
- Figure 14: North America Turf & Ornamental Chemical Input Industry Volume Share (%), by Synthetic Chemical Inputs 2025 & 2033
- Figure 15: North America Turf & Ornamental Chemical Input Industry Revenue (Million), by Type of Turf Grass 2025 & 2033
- Figure 16: North America Turf & Ornamental Chemical Input Industry Volume (Kiloton), by Type of Turf Grass 2025 & 2033
- Figure 17: North America Turf & Ornamental Chemical Input Industry Revenue Share (%), by Type of Turf Grass 2025 & 2033
- Figure 18: North America Turf & Ornamental Chemical Input Industry Volume Share (%), by Type of Turf Grass 2025 & 2033
- Figure 19: North America Turf & Ornamental Chemical Input Industry Revenue (Million), by Type of Ornamental Grass 2025 & 2033
- Figure 20: North America Turf & Ornamental Chemical Input Industry Volume (Kiloton), by Type of Ornamental Grass 2025 & 2033
- Figure 21: North America Turf & Ornamental Chemical Input Industry Revenue Share (%), by Type of Ornamental Grass 2025 & 2033
- Figure 22: North America Turf & Ornamental Chemical Input Industry Volume Share (%), by Type of Ornamental Grass 2025 & 2033
- Figure 23: North America Turf & Ornamental Chemical Input Industry Revenue (Million), by Synthetic Chemical Inputs 2025 & 2033
- Figure 24: North America Turf & Ornamental Chemical Input Industry Volume (Kiloton), by Synthetic Chemical Inputs 2025 & 2033
- Figure 25: North America Turf & Ornamental Chemical Input Industry Revenue Share (%), by Synthetic Chemical Inputs 2025 & 2033
- Figure 26: North America Turf & Ornamental Chemical Input Industry Volume Share (%), by Synthetic Chemical Inputs 2025 & 2033
- Figure 27: North America Turf & Ornamental Chemical Input Industry Revenue (Million), by Country 2025 & 2033
- Figure 28: North America Turf & Ornamental Chemical Input Industry Volume (Kiloton), by Country 2025 & 2033
- Figure 29: North America Turf & Ornamental Chemical Input Industry Revenue Share (%), by Country 2025 & 2033
- Figure 30: North America Turf & Ornamental Chemical Input Industry Volume Share (%), by Country 2025 & 2033
- Figure 31: Europe Turf & Ornamental Chemical Input Industry Revenue (Million), by Type of Turf Grass 2025 & 2033
- Figure 32: Europe Turf & Ornamental Chemical Input Industry Volume (Kiloton), by Type of Turf Grass 2025 & 2033
- Figure 33: Europe Turf & Ornamental Chemical Input Industry Revenue Share (%), by Type of Turf Grass 2025 & 2033
- Figure 34: Europe Turf & Ornamental Chemical Input Industry Volume Share (%), by Type of Turf Grass 2025 & 2033
- Figure 35: Europe Turf & Ornamental Chemical Input Industry Revenue (Million), by Type of Ornamental Grass 2025 & 2033
- Figure 36: Europe Turf & Ornamental Chemical Input Industry Volume (Kiloton), by Type of Ornamental Grass 2025 & 2033
- Figure 37: Europe Turf & Ornamental Chemical Input Industry Revenue Share (%), by Type of Ornamental Grass 2025 & 2033
- Figure 38: Europe Turf & Ornamental Chemical Input Industry Volume Share (%), by Type of Ornamental Grass 2025 & 2033
- Figure 39: Europe Turf & Ornamental Chemical Input Industry Revenue (Million), by Synthetic Chemical Inputs 2025 & 2033
- Figure 40: Europe Turf & Ornamental Chemical Input Industry Volume (Kiloton), by Synthetic Chemical Inputs 2025 & 2033
- Figure 41: Europe Turf & Ornamental Chemical Input Industry Revenue Share (%), by Synthetic Chemical Inputs 2025 & 2033
- Figure 42: Europe Turf & Ornamental Chemical Input Industry Volume Share (%), by Synthetic Chemical Inputs 2025 & 2033
- Figure 43: Europe Turf & Ornamental Chemical Input Industry Revenue (Million), by Type of Turf Grass 2025 & 2033
- Figure 44: Europe Turf & Ornamental Chemical Input Industry Volume (Kiloton), by Type of Turf Grass 2025 & 2033
- Figure 45: Europe Turf & Ornamental Chemical Input Industry Revenue Share (%), by Type of Turf Grass 2025 & 2033
- Figure 46: Europe Turf & Ornamental Chemical Input Industry Volume Share (%), by Type of Turf Grass 2025 & 2033
- Figure 47: Europe Turf & Ornamental Chemical Input Industry Revenue (Million), by Type of Ornamental Grass 2025 & 2033
- Figure 48: Europe Turf & Ornamental Chemical Input Industry Volume (Kiloton), by Type of Ornamental Grass 2025 & 2033
- Figure 49: Europe Turf & Ornamental Chemical Input Industry Revenue Share (%), by Type of Ornamental Grass 2025 & 2033
- Figure 50: Europe Turf & Ornamental Chemical Input Industry Volume Share (%), by Type of Ornamental Grass 2025 & 2033
- Figure 51: Europe Turf & Ornamental Chemical Input Industry Revenue (Million), by Synthetic Chemical Inputs 2025 & 2033
- Figure 52: Europe Turf & Ornamental Chemical Input Industry Volume (Kiloton), by Synthetic Chemical Inputs 2025 & 2033
- Figure 53: Europe Turf & Ornamental Chemical Input Industry Revenue Share (%), by Synthetic Chemical Inputs 2025 & 2033
- Figure 54: Europe Turf & Ornamental Chemical Input Industry Volume Share (%), by Synthetic Chemical Inputs 2025 & 2033
- Figure 55: Europe Turf & Ornamental Chemical Input Industry Revenue (Million), by Country 2025 & 2033
- Figure 56: Europe Turf & Ornamental Chemical Input Industry Volume (Kiloton), by Country 2025 & 2033
- Figure 57: Europe Turf & Ornamental Chemical Input Industry Revenue Share (%), by Country 2025 & 2033
- Figure 58: Europe Turf & Ornamental Chemical Input Industry Volume Share (%), by Country 2025 & 2033
- Figure 59: Asia Pacific Turf & Ornamental Chemical Input Industry Revenue (Million), by Type of Turf Grass 2025 & 2033
- Figure 60: Asia Pacific Turf & Ornamental Chemical Input Industry Volume (Kiloton), by Type of Turf Grass 2025 & 2033
- Figure 61: Asia Pacific Turf & Ornamental Chemical Input Industry Revenue Share (%), by Type of Turf Grass 2025 & 2033
- Figure 62: Asia Pacific Turf & Ornamental Chemical Input Industry Volume Share (%), by Type of Turf Grass 2025 & 2033
- Figure 63: Asia Pacific Turf & Ornamental Chemical Input Industry Revenue (Million), by Type of Ornamental Grass 2025 & 2033
- Figure 64: Asia Pacific Turf & Ornamental Chemical Input Industry Volume (Kiloton), by Type of Ornamental Grass 2025 & 2033
- Figure 65: Asia Pacific Turf & Ornamental Chemical Input Industry Revenue Share (%), by Type of Ornamental Grass 2025 & 2033
- Figure 66: Asia Pacific Turf & Ornamental Chemical Input Industry Volume Share (%), by Type of Ornamental Grass 2025 & 2033
- Figure 67: Asia Pacific Turf & Ornamental Chemical Input Industry Revenue (Million), by Synthetic Chemical Inputs 2025 & 2033
- Figure 68: Asia Pacific Turf & Ornamental Chemical Input Industry Volume (Kiloton), by Synthetic Chemical Inputs 2025 & 2033
- Figure 69: Asia Pacific Turf & Ornamental Chemical Input Industry Revenue Share (%), by Synthetic Chemical Inputs 2025 & 2033
- Figure 70: Asia Pacific Turf & Ornamental Chemical Input Industry Volume Share (%), by Synthetic Chemical Inputs 2025 & 2033
- Figure 71: Asia Pacific Turf & Ornamental Chemical Input Industry Revenue (Million), by Type of Turf Grass 2025 & 2033
- Figure 72: Asia Pacific Turf & Ornamental Chemical Input Industry Volume (Kiloton), by Type of Turf Grass 2025 & 2033
- Figure 73: Asia Pacific Turf & Ornamental Chemical Input Industry Revenue Share (%), by Type of Turf Grass 2025 & 2033
- Figure 74: Asia Pacific Turf & Ornamental Chemical Input Industry Volume Share (%), by Type of Turf Grass 2025 & 2033
- Figure 75: Asia Pacific Turf & Ornamental Chemical Input Industry Revenue (Million), by Type of Ornamental Grass 2025 & 2033
- Figure 76: Asia Pacific Turf & Ornamental Chemical Input Industry Volume (Kiloton), by Type of Ornamental Grass 2025 & 2033
- Figure 77: Asia Pacific Turf & Ornamental Chemical Input Industry Revenue Share (%), by Type of Ornamental Grass 2025 & 2033
- Figure 78: Asia Pacific Turf & Ornamental Chemical Input Industry Volume Share (%), by Type of Ornamental Grass 2025 & 2033
- Figure 79: Asia Pacific Turf & Ornamental Chemical Input Industry Revenue (Million), by Synthetic Chemical Inputs 2025 & 2033
- Figure 80: Asia Pacific Turf & Ornamental Chemical Input Industry Volume (Kiloton), by Synthetic Chemical Inputs 2025 & 2033
- Figure 81: Asia Pacific Turf & Ornamental Chemical Input Industry Revenue Share (%), by Synthetic Chemical Inputs 2025 & 2033
- Figure 82: Asia Pacific Turf & Ornamental Chemical Input Industry Volume Share (%), by Synthetic Chemical Inputs 2025 & 2033
- Figure 83: Asia Pacific Turf & Ornamental Chemical Input Industry Revenue (Million), by Country 2025 & 2033
- Figure 84: Asia Pacific Turf & Ornamental Chemical Input Industry Volume (Kiloton), by Country 2025 & 2033
- Figure 85: Asia Pacific Turf & Ornamental Chemical Input Industry Revenue Share (%), by Country 2025 & 2033
- Figure 86: Asia Pacific Turf & Ornamental Chemical Input Industry Volume Share (%), by Country 2025 & 2033
- Figure 87: South America Turf & Ornamental Chemical Input Industry Revenue (Million), by Type of Turf Grass 2025 & 2033
- Figure 88: South America Turf & Ornamental Chemical Input Industry Volume (Kiloton), by Type of Turf Grass 2025 & 2033
- Figure 89: South America Turf & Ornamental Chemical Input Industry Revenue Share (%), by Type of Turf Grass 2025 & 2033
- Figure 90: South America Turf & Ornamental Chemical Input Industry Volume Share (%), by Type of Turf Grass 2025 & 2033
- Figure 91: South America Turf & Ornamental Chemical Input Industry Revenue (Million), by Type of Ornamental Grass 2025 & 2033
- Figure 92: South America Turf & Ornamental Chemical Input Industry Volume (Kiloton), by Type of Ornamental Grass 2025 & 2033
- Figure 93: South America Turf & Ornamental Chemical Input Industry Revenue Share (%), by Type of Ornamental Grass 2025 & 2033
- Figure 94: South America Turf & Ornamental Chemical Input Industry Volume Share (%), by Type of Ornamental Grass 2025 & 2033
- Figure 95: South America Turf & Ornamental Chemical Input Industry Revenue (Million), by Synthetic Chemical Inputs 2025 & 2033
- Figure 96: South America Turf & Ornamental Chemical Input Industry Volume (Kiloton), by Synthetic Chemical Inputs 2025 & 2033
- Figure 97: South America Turf & Ornamental Chemical Input Industry Revenue Share (%), by Synthetic Chemical Inputs 2025 & 2033
- Figure 98: South America Turf & Ornamental Chemical Input Industry Volume Share (%), by Synthetic Chemical Inputs 2025 & 2033
- Figure 99: South America Turf & Ornamental Chemical Input Industry Revenue (Million), by Type of Turf Grass 2025 & 2033
- Figure 100: South America Turf & Ornamental Chemical Input Industry Volume (Kiloton), by Type of Turf Grass 2025 & 2033
- Figure 101: South America Turf & Ornamental Chemical Input Industry Revenue Share (%), by Type of Turf Grass 2025 & 2033
- Figure 102: South America Turf & Ornamental Chemical Input Industry Volume Share (%), by Type of Turf Grass 2025 & 2033
- Figure 103: South America Turf & Ornamental Chemical Input Industry Revenue (Million), by Type of Ornamental Grass 2025 & 2033
- Figure 104: South America Turf & Ornamental Chemical Input Industry Volume (Kiloton), by Type of Ornamental Grass 2025 & 2033
- Figure 105: South America Turf & Ornamental Chemical Input Industry Revenue Share (%), by Type of Ornamental Grass 2025 & 2033
- Figure 106: South America Turf & Ornamental Chemical Input Industry Volume Share (%), by Type of Ornamental Grass 2025 & 2033
- Figure 107: South America Turf & Ornamental Chemical Input Industry Revenue (Million), by Synthetic Chemical Inputs 2025 & 2033
- Figure 108: South America Turf & Ornamental Chemical Input Industry Volume (Kiloton), by Synthetic Chemical Inputs 2025 & 2033
- Figure 109: South America Turf & Ornamental Chemical Input Industry Revenue Share (%), by Synthetic Chemical Inputs 2025 & 2033
- Figure 110: South America Turf & Ornamental Chemical Input Industry Volume Share (%), by Synthetic Chemical Inputs 2025 & 2033
- Figure 111: South America Turf & Ornamental Chemical Input Industry Revenue (Million), by Country 2025 & 2033
- Figure 112: South America Turf & Ornamental Chemical Input Industry Volume (Kiloton), by Country 2025 & 2033
- Figure 113: South America Turf & Ornamental Chemical Input Industry Revenue Share (%), by Country 2025 & 2033
- Figure 114: South America Turf & Ornamental Chemical Input Industry Volume Share (%), by Country 2025 & 2033
- Figure 115: Africa Turf & Ornamental Chemical Input Industry Revenue (Million), by Type of Turf Grass 2025 & 2033
- Figure 116: Africa Turf & Ornamental Chemical Input Industry Volume (Kiloton), by Type of Turf Grass 2025 & 2033
- Figure 117: Africa Turf & Ornamental Chemical Input Industry Revenue Share (%), by Type of Turf Grass 2025 & 2033
- Figure 118: Africa Turf & Ornamental Chemical Input Industry Volume Share (%), by Type of Turf Grass 2025 & 2033
- Figure 119: Africa Turf & Ornamental Chemical Input Industry Revenue (Million), by Type of Ornamental Grass 2025 & 2033
- Figure 120: Africa Turf & Ornamental Chemical Input Industry Volume (Kiloton), by Type of Ornamental Grass 2025 & 2033
- Figure 121: Africa Turf & Ornamental Chemical Input Industry Revenue Share (%), by Type of Ornamental Grass 2025 & 2033
- Figure 122: Africa Turf & Ornamental Chemical Input Industry Volume Share (%), by Type of Ornamental Grass 2025 & 2033
- Figure 123: Africa Turf & Ornamental Chemical Input Industry Revenue (Million), by Synthetic Chemical Inputs 2025 & 2033
- Figure 124: Africa Turf & Ornamental Chemical Input Industry Volume (Kiloton), by Synthetic Chemical Inputs 2025 & 2033
- Figure 125: Africa Turf & Ornamental Chemical Input Industry Revenue Share (%), by Synthetic Chemical Inputs 2025 & 2033
- Figure 126: Africa Turf & Ornamental Chemical Input Industry Volume Share (%), by Synthetic Chemical Inputs 2025 & 2033
- Figure 127: Africa Turf & Ornamental Chemical Input Industry Revenue (Million), by Type of Turf Grass 2025 & 2033
- Figure 128: Africa Turf & Ornamental Chemical Input Industry Volume (Kiloton), by Type of Turf Grass 2025 & 2033
- Figure 129: Africa Turf & Ornamental Chemical Input Industry Revenue Share (%), by Type of Turf Grass 2025 & 2033
- Figure 130: Africa Turf & Ornamental Chemical Input Industry Volume Share (%), by Type of Turf Grass 2025 & 2033
- Figure 131: Africa Turf & Ornamental Chemical Input Industry Revenue (Million), by Type of Ornamental Grass 2025 & 2033
- Figure 132: Africa Turf & Ornamental Chemical Input Industry Volume (Kiloton), by Type of Ornamental Grass 2025 & 2033
- Figure 133: Africa Turf & Ornamental Chemical Input Industry Revenue Share (%), by Type of Ornamental Grass 2025 & 2033
- Figure 134: Africa Turf & Ornamental Chemical Input Industry Volume Share (%), by Type of Ornamental Grass 2025 & 2033
- Figure 135: Africa Turf & Ornamental Chemical Input Industry Revenue (Million), by Synthetic Chemical Inputs 2025 & 2033
- Figure 136: Africa Turf & Ornamental Chemical Input Industry Volume (Kiloton), by Synthetic Chemical Inputs 2025 & 2033
- Figure 137: Africa Turf & Ornamental Chemical Input Industry Revenue Share (%), by Synthetic Chemical Inputs 2025 & 2033
- Figure 138: Africa Turf & Ornamental Chemical Input Industry Volume Share (%), by Synthetic Chemical Inputs 2025 & 2033
- Figure 139: Africa Turf & Ornamental Chemical Input Industry Revenue (Million), by Country 2025 & 2033
- Figure 140: Africa Turf & Ornamental Chemical Input Industry Volume (Kiloton), by Country 2025 & 2033
- Figure 141: Africa Turf & Ornamental Chemical Input Industry Revenue Share (%), by Country 2025 & 2033
- Figure 142: Africa Turf & Ornamental Chemical Input Industry Volume Share (%), by Country 2025 & 2033
List of Tables
- Table 1: Global Turf & Ornamental Chemical Input Industry Revenue Million Forecast, by Type of Turf Grass 2020 & 2033
- Table 2: Global Turf & Ornamental Chemical Input Industry Volume Kiloton Forecast, by Type of Turf Grass 2020 & 2033
- Table 3: Global Turf & Ornamental Chemical Input Industry Revenue Million Forecast, by Type of Ornamental Grass 2020 & 2033
- Table 4: Global Turf & Ornamental Chemical Input Industry Volume Kiloton Forecast, by Type of Ornamental Grass 2020 & 2033
- Table 5: Global Turf & Ornamental Chemical Input Industry Revenue Million Forecast, by Synthetic Chemical Inputs 2020 & 2033
- Table 6: Global Turf & Ornamental Chemical Input Industry Volume Kiloton Forecast, by Synthetic Chemical Inputs 2020 & 2033
- Table 7: Global Turf & Ornamental Chemical Input Industry Revenue Million Forecast, by Type of Turf Grass 2020 & 2033
- Table 8: Global Turf & Ornamental Chemical Input Industry Volume Kiloton Forecast, by Type of Turf Grass 2020 & 2033
- Table 9: Global Turf & Ornamental Chemical Input Industry Revenue Million Forecast, by Type of Ornamental Grass 2020 & 2033
- Table 10: Global Turf & Ornamental Chemical Input Industry Volume Kiloton Forecast, by Type of Ornamental Grass 2020 & 2033
- Table 11: Global Turf & Ornamental Chemical Input Industry Revenue Million Forecast, by Synthetic Chemical Inputs 2020 & 2033
- Table 12: Global Turf & Ornamental Chemical Input Industry Volume Kiloton Forecast, by Synthetic Chemical Inputs 2020 & 2033
- Table 13: Global Turf & Ornamental Chemical Input Industry Revenue Million Forecast, by Region 2020 & 2033
- Table 14: Global Turf & Ornamental Chemical Input Industry Volume Kiloton Forecast, by Region 2020 & 2033
- Table 15: Global Turf & Ornamental Chemical Input Industry Revenue Million Forecast, by Type of Turf Grass 2020 & 2033
- Table 16: Global Turf & Ornamental Chemical Input Industry Volume Kiloton Forecast, by Type of Turf Grass 2020 & 2033
- Table 17: Global Turf & Ornamental Chemical Input Industry Revenue Million Forecast, by Type of Ornamental Grass 2020 & 2033
- Table 18: Global Turf & Ornamental Chemical Input Industry Volume Kiloton Forecast, by Type of Ornamental Grass 2020 & 2033
- Table 19: Global Turf & Ornamental Chemical Input Industry Revenue Million Forecast, by Synthetic Chemical Inputs 2020 & 2033
- Table 20: Global Turf & Ornamental Chemical Input Industry Volume Kiloton Forecast, by Synthetic Chemical Inputs 2020 & 2033
- Table 21: Global Turf & Ornamental Chemical Input Industry Revenue Million Forecast, by Type of Turf Grass 2020 & 2033
- Table 22: Global Turf & Ornamental Chemical Input Industry Volume Kiloton Forecast, by Type of Turf Grass 2020 & 2033
- Table 23: Global Turf & Ornamental Chemical Input Industry Revenue Million Forecast, by Type of Ornamental Grass 2020 & 2033
- Table 24: Global Turf & Ornamental Chemical Input Industry Volume Kiloton Forecast, by Type of Ornamental Grass 2020 & 2033
- Table 25: Global Turf & Ornamental Chemical Input Industry Revenue Million Forecast, by Synthetic Chemical Inputs 2020 & 2033
- Table 26: Global Turf & Ornamental Chemical Input Industry Volume Kiloton Forecast, by Synthetic Chemical Inputs 2020 & 2033
- Table 27: Global Turf & Ornamental Chemical Input Industry Revenue Million Forecast, by Country 2020 & 2033
- Table 28: Global Turf & Ornamental Chemical Input Industry Volume Kiloton Forecast, by Country 2020 & 2033
- Table 29: United States Turf & Ornamental Chemical Input Industry Revenue (Million) Forecast, by Application 2020 & 2033
- Table 30: United States Turf & Ornamental Chemical Input Industry Volume (Kiloton) Forecast, by Application 2020 & 2033
- Table 31: Canada Turf & Ornamental Chemical Input Industry Revenue (Million) Forecast, by Application 2020 & 2033
- Table 32: Canada Turf & Ornamental Chemical Input Industry Volume (Kiloton) Forecast, by Application 2020 & 2033
- Table 33: Mexico Turf & Ornamental Chemical Input Industry Revenue (Million) Forecast, by Application 2020 & 2033
- Table 34: Mexico Turf & Ornamental Chemical Input Industry Volume (Kiloton) Forecast, by Application 2020 & 2033
- Table 35: Rest of North America Turf & Ornamental Chemical Input Industry Revenue (Million) Forecast, by Application 2020 & 2033
- Table 36: Rest of North America Turf & Ornamental Chemical Input Industry Volume (Kiloton) Forecast, by Application 2020 & 2033
- Table 37: Global Turf & Ornamental Chemical Input Industry Revenue Million Forecast, by Type of Turf Grass 2020 & 2033
- Table 38: Global Turf & Ornamental Chemical Input Industry Volume Kiloton Forecast, by Type of Turf Grass 2020 & 2033
- Table 39: Global Turf & Ornamental Chemical Input Industry Revenue Million Forecast, by Type of Ornamental Grass 2020 & 2033
- Table 40: Global Turf & Ornamental Chemical Input Industry Volume Kiloton Forecast, by Type of Ornamental Grass 2020 & 2033
- Table 41: Global Turf & Ornamental Chemical Input Industry Revenue Million Forecast, by Synthetic Chemical Inputs 2020 & 2033
- Table 42: Global Turf & Ornamental Chemical Input Industry Volume Kiloton Forecast, by Synthetic Chemical Inputs 2020 & 2033
- Table 43: Global Turf & Ornamental Chemical Input Industry Revenue Million Forecast, by Type of Turf Grass 2020 & 2033
- Table 44: Global Turf & Ornamental Chemical Input Industry Volume Kiloton Forecast, by Type of Turf Grass 2020 & 2033
- Table 45: Global Turf & Ornamental Chemical Input Industry Revenue Million Forecast, by Type of Ornamental Grass 2020 & 2033
- Table 46: Global Turf & Ornamental Chemical Input Industry Volume Kiloton Forecast, by Type of Ornamental Grass 2020 & 2033
- Table 47: Global Turf & Ornamental Chemical Input Industry Revenue Million Forecast, by Synthetic Chemical Inputs 2020 & 2033
- Table 48: Global Turf & Ornamental Chemical Input Industry Volume Kiloton Forecast, by Synthetic Chemical Inputs 2020 & 2033
- Table 49: Global Turf & Ornamental Chemical Input Industry Revenue Million Forecast, by Country 2020 & 2033
- Table 50: Global Turf & Ornamental Chemical Input Industry Volume Kiloton Forecast, by Country 2020 & 2033
- Table 51: Spain Turf & Ornamental Chemical Input Industry Revenue (Million) Forecast, by Application 2020 & 2033
- Table 52: Spain Turf & Ornamental Chemical Input Industry Volume (Kiloton) Forecast, by Application 2020 & 2033
- Table 53: United Kingdom Turf & Ornamental Chemical Input Industry Revenue (Million) Forecast, by Application 2020 & 2033
- Table 54: United Kingdom Turf & Ornamental Chemical Input Industry Volume (Kiloton) Forecast, by Application 2020 & 2033
- Table 55: France Turf & Ornamental Chemical Input Industry Revenue (Million) Forecast, by Application 2020 & 2033
- Table 56: France Turf & Ornamental Chemical Input Industry Volume (Kiloton) Forecast, by Application 2020 & 2033
- Table 57: Germany Turf & Ornamental Chemical Input Industry Revenue (Million) Forecast, by Application 2020 & 2033
- Table 58: Germany Turf & Ornamental Chemical Input Industry Volume (Kiloton) Forecast, by Application 2020 & 2033
- Table 59: Denmark Turf & Ornamental Chemical Input Industry Revenue (Million) Forecast, by Application 2020 & 2033
- Table 60: Denmark Turf & Ornamental Chemical Input Industry Volume (Kiloton) Forecast, by Application 2020 & 2033
- Table 61: Italy Turf & Ornamental Chemical Input Industry Revenue (Million) Forecast, by Application 2020 & 2033
- Table 62: Italy Turf & Ornamental Chemical Input Industry Volume (Kiloton) Forecast, by Application 2020 & 2033
- Table 63: Rest of Europe Turf & Ornamental Chemical Input Industry Revenue (Million) Forecast, by Application 2020 & 2033
- Table 64: Rest of Europe Turf & Ornamental Chemical Input Industry Volume (Kiloton) Forecast, by Application 2020 & 2033
- Table 65: Global Turf & Ornamental Chemical Input Industry Revenue Million Forecast, by Type of Turf Grass 2020 & 2033
- Table 66: Global Turf & Ornamental Chemical Input Industry Volume Kiloton Forecast, by Type of Turf Grass 2020 & 2033
- Table 67: Global Turf & Ornamental Chemical Input Industry Revenue Million Forecast, by Type of Ornamental Grass 2020 & 2033
- Table 68: Global Turf & Ornamental Chemical Input Industry Volume Kiloton Forecast, by Type of Ornamental Grass 2020 & 2033
- Table 69: Global Turf & Ornamental Chemical Input Industry Revenue Million Forecast, by Synthetic Chemical Inputs 2020 & 2033
- Table 70: Global Turf & Ornamental Chemical Input Industry Volume Kiloton Forecast, by Synthetic Chemical Inputs 2020 & 2033
- Table 71: Global Turf & Ornamental Chemical Input Industry Revenue Million Forecast, by Type of Turf Grass 2020 & 2033
- Table 72: Global Turf & Ornamental Chemical Input Industry Volume Kiloton Forecast, by Type of Turf Grass 2020 & 2033
- Table 73: Global Turf & Ornamental Chemical Input Industry Revenue Million Forecast, by Type of Ornamental Grass 2020 & 2033
- Table 74: Global Turf & Ornamental Chemical Input Industry Volume Kiloton Forecast, by Type of Ornamental Grass 2020 & 2033
- Table 75: Global Turf & Ornamental Chemical Input Industry Revenue Million Forecast, by Synthetic Chemical Inputs 2020 & 2033
- Table 76: Global Turf & Ornamental Chemical Input Industry Volume Kiloton Forecast, by Synthetic Chemical Inputs 2020 & 2033
- Table 77: Global Turf & Ornamental Chemical Input Industry Revenue Million Forecast, by Country 2020 & 2033
- Table 78: Global Turf & Ornamental Chemical Input Industry Volume Kiloton Forecast, by Country 2020 & 2033
- Table 79: China Turf & Ornamental Chemical Input Industry Revenue (Million) Forecast, by Application 2020 & 2033
- Table 80: China Turf & Ornamental Chemical Input Industry Volume (Kiloton) Forecast, by Application 2020 & 2033
- Table 81: India Turf & Ornamental Chemical Input Industry Revenue (Million) Forecast, by Application 2020 & 2033
- Table 82: India Turf & Ornamental Chemical Input Industry Volume (Kiloton) Forecast, by Application 2020 & 2033
- Table 83: Japan Turf & Ornamental Chemical Input Industry Revenue (Million) Forecast, by Application 2020 & 2033
- Table 84: Japan Turf & Ornamental Chemical Input Industry Volume (Kiloton) Forecast, by Application 2020 & 2033
- Table 85: Thailand Turf & Ornamental Chemical Input Industry Revenue (Million) Forecast, by Application 2020 & 2033
- Table 86: Thailand Turf & Ornamental Chemical Input Industry Volume (Kiloton) Forecast, by Application 2020 & 2033
- Table 87: Australia Turf & Ornamental Chemical Input Industry Revenue (Million) Forecast, by Application 2020 & 2033
- Table 88: Australia Turf & Ornamental Chemical Input Industry Volume (Kiloton) Forecast, by Application 2020 & 2033
- Table 89: Rest of Asia Pacific Turf & Ornamental Chemical Input Industry Revenue (Million) Forecast, by Application 2020 & 2033
- Table 90: Rest of Asia Pacific Turf & Ornamental Chemical Input Industry Volume (Kiloton) Forecast, by Application 2020 & 2033
- Table 91: Global Turf & Ornamental Chemical Input Industry Revenue Million Forecast, by Type of Turf Grass 2020 & 2033
- Table 92: Global Turf & Ornamental Chemical Input Industry Volume Kiloton Forecast, by Type of Turf Grass 2020 & 2033
- Table 93: Global Turf & Ornamental Chemical Input Industry Revenue Million Forecast, by Type of Ornamental Grass 2020 & 2033
- Table 94: Global Turf & Ornamental Chemical Input Industry Volume Kiloton Forecast, by Type of Ornamental Grass 2020 & 2033
- Table 95: Global Turf & Ornamental Chemical Input Industry Revenue Million Forecast, by Synthetic Chemical Inputs 2020 & 2033
- Table 96: Global Turf & Ornamental Chemical Input Industry Volume Kiloton Forecast, by Synthetic Chemical Inputs 2020 & 2033
- Table 97: Global Turf & Ornamental Chemical Input Industry Revenue Million Forecast, by Type of Turf Grass 2020 & 2033
- Table 98: Global Turf & Ornamental Chemical Input Industry Volume Kiloton Forecast, by Type of Turf Grass 2020 & 2033
- Table 99: Global Turf & Ornamental Chemical Input Industry Revenue Million Forecast, by Type of Ornamental Grass 2020 & 2033
- Table 100: Global Turf & Ornamental Chemical Input Industry Volume Kiloton Forecast, by Type of Ornamental Grass 2020 & 2033
- Table 101: Global Turf & Ornamental Chemical Input Industry Revenue Million Forecast, by Synthetic Chemical Inputs 2020 & 2033
- Table 102: Global Turf & Ornamental Chemical Input Industry Volume Kiloton Forecast, by Synthetic Chemical Inputs 2020 & 2033
- Table 103: Global Turf & Ornamental Chemical Input Industry Revenue Million Forecast, by Country 2020 & 2033
- Table 104: Global Turf & Ornamental Chemical Input Industry Volume Kiloton Forecast, by Country 2020 & 2033
- Table 105: Brazil Turf & Ornamental Chemical Input Industry Revenue (Million) Forecast, by Application 2020 & 2033
- Table 106: Brazil Turf & Ornamental Chemical Input Industry Volume (Kiloton) Forecast, by Application 2020 & 2033
- Table 107: Argentina Turf & Ornamental Chemical Input Industry Revenue (Million) Forecast, by Application 2020 & 2033
- Table 108: Argentina Turf & Ornamental Chemical Input Industry Volume (Kiloton) Forecast, by Application 2020 & 2033
- Table 109: Rest of South America Turf & Ornamental Chemical Input Industry Revenue (Million) Forecast, by Application 2020 & 2033
- Table 110: Rest of South America Turf & Ornamental Chemical Input Industry Volume (Kiloton) Forecast, by Application 2020 & 2033
- Table 111: Global Turf & Ornamental Chemical Input Industry Revenue Million Forecast, by Type of Turf Grass 2020 & 2033
- Table 112: Global Turf & Ornamental Chemical Input Industry Volume Kiloton Forecast, by Type of Turf Grass 2020 & 2033
- Table 113: Global Turf & Ornamental Chemical Input Industry Revenue Million Forecast, by Type of Ornamental Grass 2020 & 2033
- Table 114: Global Turf & Ornamental Chemical Input Industry Volume Kiloton Forecast, by Type of Ornamental Grass 2020 & 2033
- Table 115: Global Turf & Ornamental Chemical Input Industry Revenue Million Forecast, by Synthetic Chemical Inputs 2020 & 2033
- Table 116: Global Turf & Ornamental Chemical Input Industry Volume Kiloton Forecast, by Synthetic Chemical Inputs 2020 & 2033
- Table 117: Global Turf & Ornamental Chemical Input Industry Revenue Million Forecast, by Type of Turf Grass 2020 & 2033
- Table 118: Global Turf & Ornamental Chemical Input Industry Volume Kiloton Forecast, by Type of Turf Grass 2020 & 2033
- Table 119: Global Turf & Ornamental Chemical Input Industry Revenue Million Forecast, by Type of Ornamental Grass 2020 & 2033
- Table 120: Global Turf & Ornamental Chemical Input Industry Volume Kiloton Forecast, by Type of Ornamental Grass 2020 & 2033
- Table 121: Global Turf & Ornamental Chemical Input Industry Revenue Million Forecast, by Synthetic Chemical Inputs 2020 & 2033
- Table 122: Global Turf & Ornamental Chemical Input Industry Volume Kiloton Forecast, by Synthetic Chemical Inputs 2020 & 2033
- Table 123: Global Turf & Ornamental Chemical Input Industry Revenue Million Forecast, by Country 2020 & 2033
- Table 124: Global Turf & Ornamental Chemical Input Industry Volume Kiloton Forecast, by Country 2020 & 2033
- Table 125: South Africa Turf & Ornamental Chemical Input Industry Revenue (Million) Forecast, by Application 2020 & 2033
- Table 126: South Africa Turf & Ornamental Chemical Input Industry Volume (Kiloton) Forecast, by Application 2020 & 2033
- Table 127: Rest of Africa Turf & Ornamental Chemical Input Industry Revenue (Million) Forecast, by Application 2020 & 2033
- Table 128: Rest of Africa Turf & Ornamental Chemical Input Industry Volume (Kiloton) Forecast, by Application 2020 & 2033
Frequently Asked Questions
1. What is the projected Compound Annual Growth Rate (CAGR) of the Turf & Ornamental Chemical Input Industry?
The projected CAGR is approximately 4.34%.
2. Which companies are prominent players in the Turf & Ornamental Chemical Input Industry?
Key companies in the market include FMC Corporation, Bayer Crop Sciences, American Vanguard Corporation, Chemisco Division of United Industries Corp, Syngenta A, Precision Laboratories, DowDuPont, Monsanto Company, Gowan International, Chemtura Agro Solutions, Adama Agricultural Solutions, Koch Agronomic Services LLC, Nufarm Ltd, BASF SE.
3. What are the main segments of the Turf & Ornamental Chemical Input Industry?
The market segments include Type of Turf Grass, Type of Ornamental Grass, Synthetic Chemical Inputs, Type of Turf Grass, Type of Ornamental Grass, Synthetic Chemical Inputs.
4. Can you provide details about the market size?
The market size is estimated to be USD 7.02 Million as of 2022.
5. What are some drivers contributing to market growth?
Seed Treatment As A Solution To Enhance Yield; Growing Awareness For Seed Treatment Among The Farmers; Rising Trend Of Organic Farming.
6. What are the notable trends driving market growth?
Increasing Development of the Golf Courses and Sports Field.
7. Are there any restraints impacting market growth?
Limitations Across Farm-Level Seed Treatment; Rising Environmental Concerns.
8. Can you provide examples of recent developments in the market?
March 2022: BASF introduced Pillar SC Intrinsic brand fungicide.This fungicide provided broad-spectrum control of 26 cool- and warm-season turf diseases, like brown patch, dollar spot, leaf spots and large patch with one use rate. Pillar SC Intrinsic brand fungicide is the first fungicide developed for lawn care from BASF.
9. What pricing options are available for accessing the report?
Pricing options include single-user, multi-user, and enterprise licenses priced at USD 4750, USD 5250, and USD 8750 respectively.
10. Is the market size provided in terms of value or volume?
The market size is provided in terms of value, measured in Million and volume, measured in Kiloton.
11. Are there any specific market keywords associated with the report?
Yes, the market keyword associated with the report is "Turf & Ornamental Chemical Input Industry," which aids in identifying and referencing the specific market segment covered.
12. How do I determine which pricing option suits my needs best?
The pricing options vary based on user requirements and access needs. Individual users may opt for single-user licenses, while businesses requiring broader access may choose multi-user or enterprise licenses for cost-effective access to the report.
13. Are there any additional resources or data provided in the Turf & Ornamental Chemical Input Industry report?
While the report offers comprehensive insights, it's advisable to review the specific contents or supplementary materials provided to ascertain if additional resources or data are available.
14. How can I stay updated on further developments or reports in the Turf & Ornamental Chemical Input Industry?
To stay informed about further developments, trends, and reports in the Turf & Ornamental Chemical Input Industry, consider subscribing to industry newsletters, following relevant companies and organizations, or regularly checking reputable industry news sources and publications.
Methodology
Step 1 - Identification of Relevant Samples Size from Population Database


Step 2 - Approaches for Defining Global Market Size (Value, Volume* & Price*)

Note*: In applicable scenarios
Step 3 - Data Sources
Primary Research
- Web Analytics
- Survey Reports
- Research Institute
- Latest Research Reports
- Opinion Leaders
Secondary Research
- Annual Reports
- White Paper
- Latest Press Release
- Industry Association
- Paid Database
- Investor Presentations

Step 4 - Data Triangulation
Involves using different sources of information in order to increase the validity of a study
These sources are likely to be stakeholders in a program - participants, other researchers, program staff, other community members, and so on.
Then we put all data in single framework & apply various statistical tools to find out the dynamic on the market.
During the analysis stage, feedback from the stakeholder groups would be compared to determine areas of agreement as well as areas of divergence