
Key Insights
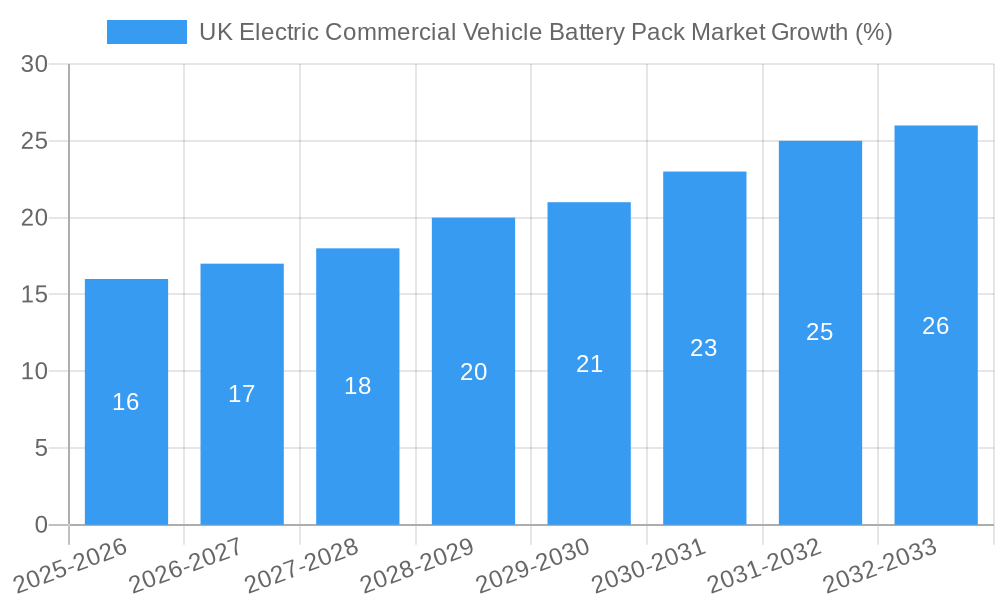
The UK electric commercial vehicle (eCV) battery pack market is experiencing robust growth, driven by stringent emission regulations, government incentives promoting electric vehicle adoption, and the increasing demand for sustainable transportation solutions. The market's Compound Annual Growth Rate (CAGR) exceeding 6.50% from 2019 to 2024 indicates a significant upward trajectory. This growth is fueled by advancements in battery technology, leading to improved energy density, longer lifespans, and reduced costs. The market is segmented by battery form factor (cylindrical, pouch, prismatic), manufacturing methods (laser, wire welding), component type (anode, cathode, electrolyte, separator), material composition (cobalt, lithium, manganese, natural graphite, nickel), vehicle body type (bus, light commercial vehicle (LCV), medium & heavy-duty trucks (M&HDT)), propulsion type (battery electric vehicle (BEV), plug-in hybrid electric vehicle (PHEV)), battery chemistry (LFP, NCA, NCM, NMC), and battery capacity (ranging from less than 15 kWh to above 80 kWh). Key players such as CATL, LG Energy Solution, and BYD are actively expanding their presence in this market, driving competition and innovation. The regional focus is primarily on England, Wales, Scotland, and Northern Ireland, reflecting the UK's concentrated eCV adoption efforts.
Looking forward, the UK eCV battery pack market is poised for continued expansion through 2033. Factors contributing to this sustained growth include the ongoing development of charging infrastructure, improvements in battery technology leading to increased range and performance, and the increasing affordability of electric commercial vehicles. However, challenges remain, including the reliance on imported raw materials, potential supply chain disruptions, and the need for robust battery recycling infrastructure to ensure sustainable practices. The market segmentation will likely evolve with the emergence of new battery chemistries and form factors, impacting the competitive landscape and driving further innovation within the UK eCV battery pack sector. The diverse range of vehicle types served by this market (buses, LCVs, and M&HDTs) ensures a broad and resilient market, ensuring continued growth across multiple sectors.
UK Electric Commercial Vehicle Battery Pack Market: A Comprehensive Report (2019-2033)
This detailed report provides a comprehensive analysis of the UK electric commercial vehicle battery pack market, offering invaluable insights for industry stakeholders, investors, and strategic decision-makers. The study period spans from 2019 to 2033, with 2025 as the base and estimated year. The forecast period covers 2025-2033, and the historical period encompasses 2019-2024. This report leverages extensive data analysis to illuminate market trends, segment performance, competitive dynamics, and future growth potential within the UK's rapidly evolving electric vehicle landscape.
UK Electric Commercial Vehicle Battery Pack Market Market Concentration & Innovation
The UK electric commercial vehicle battery pack market exhibits a moderately concentrated landscape, with several key players vying for market share. Market concentration is influenced by factors like technological advancements, economies of scale, and strategic partnerships. Innovation is a key driver, fueled by advancements in battery chemistry (LFP, NCA, NCM, NMC), cell form factors (cylindrical, pouch, prismatic), and manufacturing methods (laser, wire welding). Stringent UK emission regulations and government incentives significantly impact market growth. The presence of established automotive players alongside emerging battery technology companies fosters a dynamic competitive environment. The market is also influenced by the rising adoption of electric commercial vehicles across various segments (buses, LCVs, M&HDTs) and the increasing demand for higher energy density and longer-lasting batteries. Mergers and acquisitions (M&A) activity, although not yet extensive, is anticipated to increase as companies seek to consolidate market share and acquire innovative technologies. While precise M&A deal values are not publicly available for all transactions, several deals in the xx Million range have been observed in recent years. Some examples of M&A activity that has impacted market concentration (although exact figures may be unavailable) are [Insert examples if available]. Market share distribution is currently estimated at xx% for the top three players, but this is likely to shift given the current dynamics of the market.
UK Electric Commercial Vehicle Battery Pack Market Industry Trends & Insights
The UK electric commercial vehicle battery pack market is experiencing significant growth, driven by several key factors. The increasing adoption of electric vehicles to meet stricter emission regulations is a primary driver. Government incentives, including grants and tax breaks, further stimulate market expansion. Technological advancements, such as improvements in battery energy density and lifespan, are also playing a crucial role. The market is witnessing a shift towards higher capacity batteries (above 80 kWh) to meet the increasing range requirements of commercial vehicles. The compound annual growth rate (CAGR) for the period 2025-2033 is projected to be xx%, indicating robust market expansion. Market penetration, currently at xx%, is expected to increase significantly due to the factors mentioned above. Competition is intensifying with established players and new entrants vying for market share. The industry is also grappling with challenges such as the supply chain constraints impacting battery raw material availability and the need for robust battery recycling infrastructure. Consumer preferences are increasingly favouring long-range, fast-charging electric commercial vehicles, placing further pressure on battery technology innovation. The rise of battery-as-a-service (BaaS) models presents both opportunities and challenges for market players.
Dominant Markets & Segments in UK Electric Commercial Vehicle Battery Pack Market
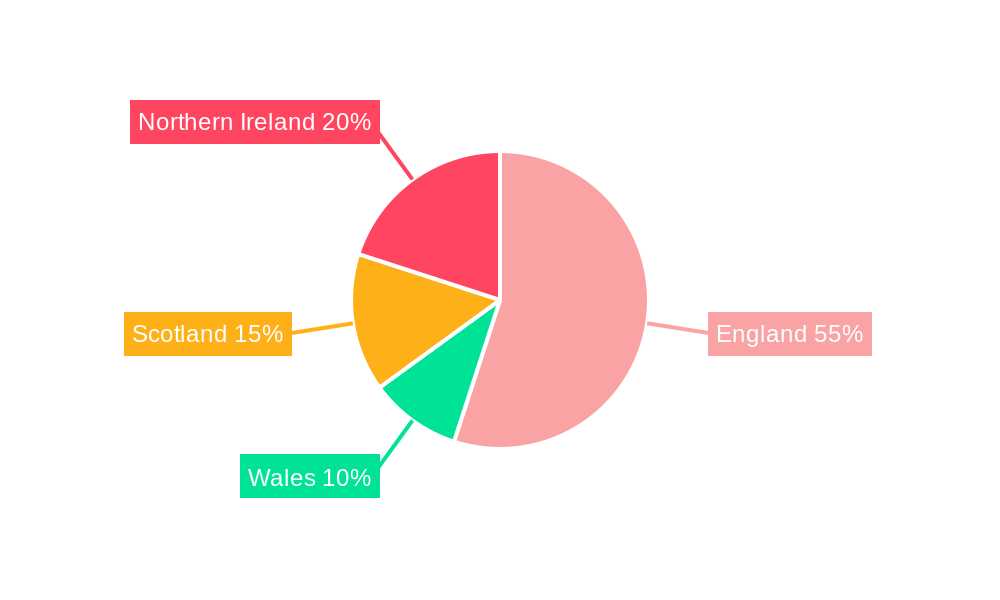
- Leading Region/Country: The South East of England currently dominates the UK market for electric commercial vehicle battery packs, driven by higher EV adoption rates and a concentration of key industry players. This dominance is supported by favourable government policies, established infrastructure and higher demand from logistics and delivery businesses.
- Dominant Segments:
- Battery Form: Prismatic battery packs currently hold the largest market share due to their high energy density and suitability for various vehicle types.
- Method: Wire welding remains the dominant manufacturing method due to its cost-effectiveness and established infrastructure, although laser welding is gaining traction for enhanced precision.
- Component: Cathode materials, especially those incorporating Nickel, Manganese, and Cobalt (NMC), are currently the most prevalent, but LFP is witnessing significant growth due to its cost-effectiveness and improved performance.
- Material Type: Lithium is the dominant material, driving innovations in battery chemistries and enhancing performance capabilities.
- Body Type: Buses and Light Commercial Vehicles (LCVs) currently represent the largest segments, reflecting the high volume of these vehicle types in the UK market.
- Propulsion Type: Battery Electric Vehicles (BEVs) are the dominant propulsion type, significantly outpacing Plug-in Hybrid Electric Vehicles (PHEVs).
- Battery Chemistry: NMC battery chemistries are currently dominant, but LFP is rapidly gaining ground driven by cost advantages and improved performance characteristics.
- Capacity: The 40 kWh to 80 kWh battery capacity segment currently holds the largest share, driven by the optimal balance between cost, range and vehicle performance.
Key drivers for dominance in these segments include government regulations favouring BEVs, economic incentives for electric vehicle adoption, and the growing demand for higher capacity batteries in commercial vehicles. Infrastructure development, including charging networks, further supports market dominance.
UK Electric Commercial Vehicle Battery Pack Market Product Developments
Recent product innovations focus on enhancing battery energy density, lifespan, and safety. Advanced battery chemistries, improved thermal management systems, and innovative cell designs are key areas of development. Solid-state batteries are emerging as a promising technology, offering potential advantages in energy density and safety. These innovations are aimed at addressing challenges such as range anxiety and battery degradation, making electric commercial vehicles more attractive to potential buyers. The market fit for these new technologies is strong, driven by the increasing demand for longer-range and more reliable electric commercial vehicles.
Report Scope & Segmentation Analysis
This report provides a detailed segmentation analysis of the UK electric commercial vehicle battery pack market, encompassing various aspects:
- Battery Form: Cylindrical, Pouch, Prismatic (Growth projections, market sizes, and competitive dynamics for each are included in the full report).
- Method: Laser, Wire (Growth projections, market sizes, and competitive dynamics for each are included in the full report).
- Component: Anode, Cathode, Electrolyte, Separator (Growth projections, market sizes, and competitive dynamics for each are included in the full report).
- Material Type: Cobalt, Lithium, Manganese, Natural Graphite, Nickel, Other Materials (Growth projections, market sizes, and competitive dynamics for each are included in the full report).
- Body Type: Bus, LCV, M&HDT (Growth projections, market sizes, and competitive dynamics for each are included in the full report).
- Propulsion Type: BEV, PHEV (Growth projections, market sizes, and competitive dynamics for each are included in the full report).
- Battery Chemistry: LFP, NCA, NCM, NMC, Others (Growth projections, market sizes, and competitive dynamics for each are included in the full report).
- Capacity: Less than 15 kWh, 15 kWh to 40 kWh, 40 kWh to 80 kWh, Above 80 kWh (Growth projections, market sizes, and competitive dynamics for each are included in the full report).
Key Drivers of UK Electric Commercial Vehicle Battery Pack Market Growth
Several factors contribute to the growth of the UK electric commercial vehicle battery pack market. Government regulations aimed at reducing emissions are a primary driver, compelling the transition to electric vehicles. Incentive schemes, such as grants and tax breaks, further accelerate market growth by reducing the cost of electric vehicle ownership and operation. Technological advancements, leading to improved battery performance and longer lifespans, also contribute significantly. Increasingly stringent emission standards and the growing awareness of environmental concerns are pushing the adoption of electric commercial vehicles across various sectors.
Challenges in the UK Electric Commercial Vehicle Battery Pack Market Sector
The UK electric commercial vehicle battery pack market faces several challenges. Supply chain disruptions, particularly concerning raw materials, can impact production and increase costs. The high initial cost of electric vehicles compared to their internal combustion engine counterparts remains a barrier to wider adoption. The limited availability of charging infrastructure in certain regions also hinders market expansion. Furthermore, competition from established and emerging players creates intense pressure in the market. The challenge of effectively managing battery end-of-life and recycling adds to the complexity of the market.
Emerging Opportunities in UK Electric Commercial Vehicle Battery Pack Market
The UK electric commercial vehicle battery pack market presents several promising opportunities. The increasing demand for electric vehicles across various sectors, including logistics, delivery, and public transport, creates significant market potential. The development of advanced battery technologies, such as solid-state batteries, offers opportunities for enhanced performance and cost reduction. Growth in battery-as-a-service (BaaS) models and the expansion of charging infrastructure present further growth avenues. Exploring opportunities in niche segments, such as specialized commercial vehicles for specific industries, could yield substantial returns.
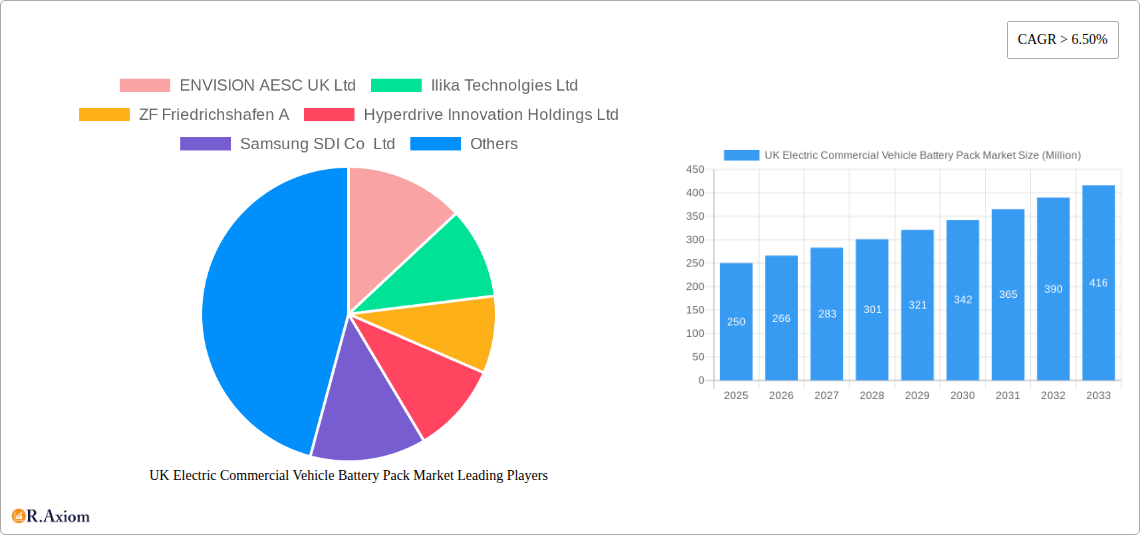
Leading Players in the UK Electric Commercial Vehicle Battery Pack Market Market
- ENVISION AESC UK Ltd
- Ilika Technologies Ltd
- ZF Friedrichshafen A
- Hyperdrive Innovation Holdings Ltd
- Samsung SDI Co Ltd
- LG Energy Solution Ltd
- Power By Britishvolt Ltd
- Contemporary Amperex Technology Co Ltd (CATL)
- Robert Bosch GmbH
- BYD Company Ltd
- Amte Power PLC
- SK Innovation Co Ltd
Key Developments in UK Electric Commercial Vehicle Battery Pack Market Industry
- January 2023: Ilika leads an £8.2 Million collaboration to develop automotive-grade solid-state batteries. This signifies a major step towards more efficient and safer battery technology for the UK commercial vehicle market.
- November 2022: AMTE Power PLC issues 245,514 new shares following a conversion of convertible loan notes. This injection of capital strengthens the company's position in the market and potentially boosts production capabilities.
- October 2022: AMTE Power secures a production contract with the UK Battery Industrialisation Centre for its Ultra High Power cells. This partnership enhances the UK's battery production capabilities and signifies growing domestic manufacturing in the sector.
Strategic Outlook for UK Electric Commercial Vehicle Battery Pack Market Market
The UK electric commercial vehicle battery pack market is poised for substantial growth, driven by government support, technological advancements, and increasing environmental awareness. Opportunities lie in developing advanced battery technologies, improving supply chain resilience, and expanding charging infrastructure. Strategic partnerships and collaborations will be crucial for success in this competitive market. Companies focusing on innovation, sustainability, and customer needs are well-positioned to capture significant market share and drive future growth within this rapidly expanding sector.
UK Electric Commercial Vehicle Battery Pack Market Segmentation
-
1. Body Type
- 1.1. Bus
- 1.2. LCV
- 1.3. M&HDT
-
2. Propulsion Type
- 2.1. BEV
- 2.2. PHEV
-
3. Battery Chemistry
- 3.1. LFP
- 3.2. NCA
- 3.3. NCM
- 3.4. NMC
- 3.5. Others
-
4. Capacity
- 4.1. 15 kWh to 40 kWh
- 4.2. 40 kWh to 80 kWh
- 4.3. Above 80 kWh
- 4.4. Less than 15 kWh
-
5. Battery Form
- 5.1. Cylindrical
- 5.2. Pouch
- 5.3. Prismatic
-
6. Method
- 6.1. Laser
- 6.2. Wire
-
7. Component
- 7.1. Anode
- 7.2. Cathode
- 7.3. Electrolyte
- 7.4. Separator
-
8. Material Type
- 8.1. Cobalt
- 8.2. Lithium
- 8.3. Manganese
- 8.4. Natural Graphite
- 8.5. Nickel
- 8.6. Other Materials
UK Electric Commercial Vehicle Battery Pack Market Segmentation By Geography
-
1. North America
- 1.1. United States
- 1.2. Canada
- 1.3. Mexico
-
2. South America
- 2.1. Brazil
- 2.2. Argentina
- 2.3. Rest of South America
-
3. Europe
- 3.1. United Kingdom
- 3.2. Germany
- 3.3. France
- 3.4. Italy
- 3.5. Spain
- 3.6. Russia
- 3.7. Benelux
- 3.8. Nordics
- 3.9. Rest of Europe
-
4. Middle East & Africa
- 4.1. Turkey
- 4.2. Israel
- 4.3. GCC
- 4.4. North Africa
- 4.5. South Africa
- 4.6. Rest of Middle East & Africa
-
5. Asia Pacific
- 5.1. China
- 5.2. India
- 5.3. Japan
- 5.4. South Korea
- 5.5. ASEAN
- 5.6. Oceania
- 5.7. Rest of Asia Pacific
UK Electric Commercial Vehicle Battery Pack Market REPORT HIGHLIGHTS
| Aspects | Details |
|---|---|
| Study Period | 2019-2033 |
| Base Year | 2024 |
| Estimated Year | 2025 |
| Forecast Period | 2025-2033 |
| Historical Period | 2019-2024 |
| Growth Rate | CAGR of > 6.50% from 2019-2033 |
| Segmentation |
|
Table of Contents
- 1. Introduction
- 1.1. Research Scope
- 1.2. Market Segmentation
- 1.3. Research Methodology
- 1.4. Definitions and Assumptions
- 2. Executive Summary
- 2.1. Introduction
- 3. Market Dynamics
- 3.1. Introduction
- 3.2. Market Drivers
- 3.2.1. Increasing Demand and Sales of Commercial Vehicles is Driving the Market for Hydraulic Systems
- 3.3. Market Restrains
- 3.3.1. Increasing Replacement of Conventional Hydraulic Systems with Fully-electric Hydraulic Systems Acts as a Restraint
- 3.4. Market Trends
- 3.4.1. OTHER KEY INDUSTRY TRENDS COVERED IN THE REPORT
- 4. Market Factor Analysis
- 4.1. Porters Five Forces
- 4.2. Supply/Value Chain
- 4.3. PESTEL analysis
- 4.4. Market Entropy
- 4.5. Patent/Trademark Analysis
- 5. Global UK Electric Commercial Vehicle Battery Pack Market Analysis, Insights and Forecast, 2019-2031
- 5.1. Market Analysis, Insights and Forecast - by Body Type
- 5.1.1. Bus
- 5.1.2. LCV
- 5.1.3. M&HDT
- 5.2. Market Analysis, Insights and Forecast - by Propulsion Type
- 5.2.1. BEV
- 5.2.2. PHEV
- 5.3. Market Analysis, Insights and Forecast - by Battery Chemistry
- 5.3.1. LFP
- 5.3.2. NCA
- 5.3.3. NCM
- 5.3.4. NMC
- 5.3.5. Others
- 5.4. Market Analysis, Insights and Forecast - by Capacity
- 5.4.1. 15 kWh to 40 kWh
- 5.4.2. 40 kWh to 80 kWh
- 5.4.3. Above 80 kWh
- 5.4.4. Less than 15 kWh
- 5.5. Market Analysis, Insights and Forecast - by Battery Form
- 5.5.1. Cylindrical
- 5.5.2. Pouch
- 5.5.3. Prismatic
- 5.6. Market Analysis, Insights and Forecast - by Method
- 5.6.1. Laser
- 5.6.2. Wire
- 5.7. Market Analysis, Insights and Forecast - by Component
- 5.7.1. Anode
- 5.7.2. Cathode
- 5.7.3. Electrolyte
- 5.7.4. Separator
- 5.8. Market Analysis, Insights and Forecast - by Material Type
- 5.8.1. Cobalt
- 5.8.2. Lithium
- 5.8.3. Manganese
- 5.8.4. Natural Graphite
- 5.8.5. Nickel
- 5.8.6. Other Materials
- 5.9. Market Analysis, Insights and Forecast - by Region
- 5.9.1. North America
- 5.9.2. South America
- 5.9.3. Europe
- 5.9.4. Middle East & Africa
- 5.9.5. Asia Pacific
- 5.1. Market Analysis, Insights and Forecast - by Body Type
- 6. North America UK Electric Commercial Vehicle Battery Pack Market Analysis, Insights and Forecast, 2019-2031
- 6.1. Market Analysis, Insights and Forecast - by Body Type
- 6.1.1. Bus
- 6.1.2. LCV
- 6.1.3. M&HDT
- 6.2. Market Analysis, Insights and Forecast - by Propulsion Type
- 6.2.1. BEV
- 6.2.2. PHEV
- 6.3. Market Analysis, Insights and Forecast - by Battery Chemistry
- 6.3.1. LFP
- 6.3.2. NCA
- 6.3.3. NCM
- 6.3.4. NMC
- 6.3.5. Others
- 6.4. Market Analysis, Insights and Forecast - by Capacity
- 6.4.1. 15 kWh to 40 kWh
- 6.4.2. 40 kWh to 80 kWh
- 6.4.3. Above 80 kWh
- 6.4.4. Less than 15 kWh
- 6.5. Market Analysis, Insights and Forecast - by Battery Form
- 6.5.1. Cylindrical
- 6.5.2. Pouch
- 6.5.3. Prismatic
- 6.6. Market Analysis, Insights and Forecast - by Method
- 6.6.1. Laser
- 6.6.2. Wire
- 6.7. Market Analysis, Insights and Forecast - by Component
- 6.7.1. Anode
- 6.7.2. Cathode
- 6.7.3. Electrolyte
- 6.7.4. Separator
- 6.8. Market Analysis, Insights and Forecast - by Material Type
- 6.8.1. Cobalt
- 6.8.2. Lithium
- 6.8.3. Manganese
- 6.8.4. Natural Graphite
- 6.8.5. Nickel
- 6.8.6. Other Materials
- 6.1. Market Analysis, Insights and Forecast - by Body Type
- 7. South America UK Electric Commercial Vehicle Battery Pack Market Analysis, Insights and Forecast, 2019-2031
- 7.1. Market Analysis, Insights and Forecast - by Body Type
- 7.1.1. Bus
- 7.1.2. LCV
- 7.1.3. M&HDT
- 7.2. Market Analysis, Insights and Forecast - by Propulsion Type
- 7.2.1. BEV
- 7.2.2. PHEV
- 7.3. Market Analysis, Insights and Forecast - by Battery Chemistry
- 7.3.1. LFP
- 7.3.2. NCA
- 7.3.3. NCM
- 7.3.4. NMC
- 7.3.5. Others
- 7.4. Market Analysis, Insights and Forecast - by Capacity
- 7.4.1. 15 kWh to 40 kWh
- 7.4.2. 40 kWh to 80 kWh
- 7.4.3. Above 80 kWh
- 7.4.4. Less than 15 kWh
- 7.5. Market Analysis, Insights and Forecast - by Battery Form
- 7.5.1. Cylindrical
- 7.5.2. Pouch
- 7.5.3. Prismatic
- 7.6. Market Analysis, Insights and Forecast - by Method
- 7.6.1. Laser
- 7.6.2. Wire
- 7.7. Market Analysis, Insights and Forecast - by Component
- 7.7.1. Anode
- 7.7.2. Cathode
- 7.7.3. Electrolyte
- 7.7.4. Separator
- 7.8. Market Analysis, Insights and Forecast - by Material Type
- 7.8.1. Cobalt
- 7.8.2. Lithium
- 7.8.3. Manganese
- 7.8.4. Natural Graphite
- 7.8.5. Nickel
- 7.8.6. Other Materials
- 7.1. Market Analysis, Insights and Forecast - by Body Type
- 8. Europe UK Electric Commercial Vehicle Battery Pack Market Analysis, Insights and Forecast, 2019-2031
- 8.1. Market Analysis, Insights and Forecast - by Body Type
- 8.1.1. Bus
- 8.1.2. LCV
- 8.1.3. M&HDT
- 8.2. Market Analysis, Insights and Forecast - by Propulsion Type
- 8.2.1. BEV
- 8.2.2. PHEV
- 8.3. Market Analysis, Insights and Forecast - by Battery Chemistry
- 8.3.1. LFP
- 8.3.2. NCA
- 8.3.3. NCM
- 8.3.4. NMC
- 8.3.5. Others
- 8.4. Market Analysis, Insights and Forecast - by Capacity
- 8.4.1. 15 kWh to 40 kWh
- 8.4.2. 40 kWh to 80 kWh
- 8.4.3. Above 80 kWh
- 8.4.4. Less than 15 kWh
- 8.5. Market Analysis, Insights and Forecast - by Battery Form
- 8.5.1. Cylindrical
- 8.5.2. Pouch
- 8.5.3. Prismatic
- 8.6. Market Analysis, Insights and Forecast - by Method
- 8.6.1. Laser
- 8.6.2. Wire
- 8.7. Market Analysis, Insights and Forecast - by Component
- 8.7.1. Anode
- 8.7.2. Cathode
- 8.7.3. Electrolyte
- 8.7.4. Separator
- 8.8. Market Analysis, Insights and Forecast - by Material Type
- 8.8.1. Cobalt
- 8.8.2. Lithium
- 8.8.3. Manganese
- 8.8.4. Natural Graphite
- 8.8.5. Nickel
- 8.8.6. Other Materials
- 8.1. Market Analysis, Insights and Forecast - by Body Type
- 9. Middle East & Africa UK Electric Commercial Vehicle Battery Pack Market Analysis, Insights and Forecast, 2019-2031
- 9.1. Market Analysis, Insights and Forecast - by Body Type
- 9.1.1. Bus
- 9.1.2. LCV
- 9.1.3. M&HDT
- 9.2. Market Analysis, Insights and Forecast - by Propulsion Type
- 9.2.1. BEV
- 9.2.2. PHEV
- 9.3. Market Analysis, Insights and Forecast - by Battery Chemistry
- 9.3.1. LFP
- 9.3.2. NCA
- 9.3.3. NCM
- 9.3.4. NMC
- 9.3.5. Others
- 9.4. Market Analysis, Insights and Forecast - by Capacity
- 9.4.1. 15 kWh to 40 kWh
- 9.4.2. 40 kWh to 80 kWh
- 9.4.3. Above 80 kWh
- 9.4.4. Less than 15 kWh
- 9.5. Market Analysis, Insights and Forecast - by Battery Form
- 9.5.1. Cylindrical
- 9.5.2. Pouch
- 9.5.3. Prismatic
- 9.6. Market Analysis, Insights and Forecast - by Method
- 9.6.1. Laser
- 9.6.2. Wire
- 9.7. Market Analysis, Insights and Forecast - by Component
- 9.7.1. Anode
- 9.7.2. Cathode
- 9.7.3. Electrolyte
- 9.7.4. Separator
- 9.8. Market Analysis, Insights and Forecast - by Material Type
- 9.8.1. Cobalt
- 9.8.2. Lithium
- 9.8.3. Manganese
- 9.8.4. Natural Graphite
- 9.8.5. Nickel
- 9.8.6. Other Materials
- 9.1. Market Analysis, Insights and Forecast - by Body Type
- 10. Asia Pacific UK Electric Commercial Vehicle Battery Pack Market Analysis, Insights and Forecast, 2019-2031
- 10.1. Market Analysis, Insights and Forecast - by Body Type
- 10.1.1. Bus
- 10.1.2. LCV
- 10.1.3. M&HDT
- 10.2. Market Analysis, Insights and Forecast - by Propulsion Type
- 10.2.1. BEV
- 10.2.2. PHEV
- 10.3. Market Analysis, Insights and Forecast - by Battery Chemistry
- 10.3.1. LFP
- 10.3.2. NCA
- 10.3.3. NCM
- 10.3.4. NMC
- 10.3.5. Others
- 10.4. Market Analysis, Insights and Forecast - by Capacity
- 10.4.1. 15 kWh to 40 kWh
- 10.4.2. 40 kWh to 80 kWh
- 10.4.3. Above 80 kWh
- 10.4.4. Less than 15 kWh
- 10.5. Market Analysis, Insights and Forecast - by Battery Form
- 10.5.1. Cylindrical
- 10.5.2. Pouch
- 10.5.3. Prismatic
- 10.6. Market Analysis, Insights and Forecast - by Method
- 10.6.1. Laser
- 10.6.2. Wire
- 10.7. Market Analysis, Insights and Forecast - by Component
- 10.7.1. Anode
- 10.7.2. Cathode
- 10.7.3. Electrolyte
- 10.7.4. Separator
- 10.8. Market Analysis, Insights and Forecast - by Material Type
- 10.8.1. Cobalt
- 10.8.2. Lithium
- 10.8.3. Manganese
- 10.8.4. Natural Graphite
- 10.8.5. Nickel
- 10.8.6. Other Materials
- 10.1. Market Analysis, Insights and Forecast - by Body Type
- 11. England UK Electric Commercial Vehicle Battery Pack Market Analysis, Insights and Forecast, 2019-2031
- 12. Wales UK Electric Commercial Vehicle Battery Pack Market Analysis, Insights and Forecast, 2019-2031
- 13. Scotland UK Electric Commercial Vehicle Battery Pack Market Analysis, Insights and Forecast, 2019-2031
- 14. Northern UK Electric Commercial Vehicle Battery Pack Market Analysis, Insights and Forecast, 2019-2031
- 15. Ireland UK Electric Commercial Vehicle Battery Pack Market Analysis, Insights and Forecast, 2019-2031
- 16. Competitive Analysis
- 16.1. Global Market Share Analysis 2024
- 16.2. Company Profiles
- 16.2.1 ENVISION AESC UK Ltd
- 16.2.1.1. Overview
- 16.2.1.2. Products
- 16.2.1.3. SWOT Analysis
- 16.2.1.4. Recent Developments
- 16.2.1.5. Financials (Based on Availability)
- 16.2.2 Ilika Technolgies Ltd
- 16.2.2.1. Overview
- 16.2.2.2. Products
- 16.2.2.3. SWOT Analysis
- 16.2.2.4. Recent Developments
- 16.2.2.5. Financials (Based on Availability)
- 16.2.3 ZF Friedrichshafen A
- 16.2.3.1. Overview
- 16.2.3.2. Products
- 16.2.3.3. SWOT Analysis
- 16.2.3.4. Recent Developments
- 16.2.3.5. Financials (Based on Availability)
- 16.2.4 Hyperdrive Innovation Holdings Ltd
- 16.2.4.1. Overview
- 16.2.4.2. Products
- 16.2.4.3. SWOT Analysis
- 16.2.4.4. Recent Developments
- 16.2.4.5. Financials (Based on Availability)
- 16.2.5 Samsung SDI Co Ltd
- 16.2.5.1. Overview
- 16.2.5.2. Products
- 16.2.5.3. SWOT Analysis
- 16.2.5.4. Recent Developments
- 16.2.5.5. Financials (Based on Availability)
- 16.2.6 LG Energy Solution Ltd
- 16.2.6.1. Overview
- 16.2.6.2. Products
- 16.2.6.3. SWOT Analysis
- 16.2.6.4. Recent Developments
- 16.2.6.5. Financials (Based on Availability)
- 16.2.7 Power By Britishvolt Ltd
- 16.2.7.1. Overview
- 16.2.7.2. Products
- 16.2.7.3. SWOT Analysis
- 16.2.7.4. Recent Developments
- 16.2.7.5. Financials (Based on Availability)
- 16.2.8 Contemporary Amperex Technology Co Ltd (CATL)
- 16.2.8.1. Overview
- 16.2.8.2. Products
- 16.2.8.3. SWOT Analysis
- 16.2.8.4. Recent Developments
- 16.2.8.5. Financials (Based on Availability)
- 16.2.9 Robert Bosch GmbH
- 16.2.9.1. Overview
- 16.2.9.2. Products
- 16.2.9.3. SWOT Analysis
- 16.2.9.4. Recent Developments
- 16.2.9.5. Financials (Based on Availability)
- 16.2.10 BYD Company Ltd
- 16.2.10.1. Overview
- 16.2.10.2. Products
- 16.2.10.3. SWOT Analysis
- 16.2.10.4. Recent Developments
- 16.2.10.5. Financials (Based on Availability)
- 16.2.11 Amte Power PLC
- 16.2.11.1. Overview
- 16.2.11.2. Products
- 16.2.11.3. SWOT Analysis
- 16.2.11.4. Recent Developments
- 16.2.11.5. Financials (Based on Availability)
- 16.2.12 SK Innovation Co Ltd
- 16.2.12.1. Overview
- 16.2.12.2. Products
- 16.2.12.3. SWOT Analysis
- 16.2.12.4. Recent Developments
- 16.2.12.5. Financials (Based on Availability)
- 16.2.1 ENVISION AESC UK Ltd
List of Figures
- Figure 1: Global UK Electric Commercial Vehicle Battery Pack Market Revenue Breakdown (Million, %) by Region 2024 & 2032
- Figure 2: United kingdom Region UK Electric Commercial Vehicle Battery Pack Market Revenue (Million), by Country 2024 & 2032
- Figure 3: United kingdom Region UK Electric Commercial Vehicle Battery Pack Market Revenue Share (%), by Country 2024 & 2032
- Figure 4: North America UK Electric Commercial Vehicle Battery Pack Market Revenue (Million), by Body Type 2024 & 2032
- Figure 5: North America UK Electric Commercial Vehicle Battery Pack Market Revenue Share (%), by Body Type 2024 & 2032
- Figure 6: North America UK Electric Commercial Vehicle Battery Pack Market Revenue (Million), by Propulsion Type 2024 & 2032
- Figure 7: North America UK Electric Commercial Vehicle Battery Pack Market Revenue Share (%), by Propulsion Type 2024 & 2032
- Figure 8: North America UK Electric Commercial Vehicle Battery Pack Market Revenue (Million), by Battery Chemistry 2024 & 2032
- Figure 9: North America UK Electric Commercial Vehicle Battery Pack Market Revenue Share (%), by Battery Chemistry 2024 & 2032
- Figure 10: North America UK Electric Commercial Vehicle Battery Pack Market Revenue (Million), by Capacity 2024 & 2032
- Figure 11: North America UK Electric Commercial Vehicle Battery Pack Market Revenue Share (%), by Capacity 2024 & 2032
- Figure 12: North America UK Electric Commercial Vehicle Battery Pack Market Revenue (Million), by Battery Form 2024 & 2032
- Figure 13: North America UK Electric Commercial Vehicle Battery Pack Market Revenue Share (%), by Battery Form 2024 & 2032
- Figure 14: North America UK Electric Commercial Vehicle Battery Pack Market Revenue (Million), by Method 2024 & 2032
- Figure 15: North America UK Electric Commercial Vehicle Battery Pack Market Revenue Share (%), by Method 2024 & 2032
- Figure 16: North America UK Electric Commercial Vehicle Battery Pack Market Revenue (Million), by Component 2024 & 2032
- Figure 17: North America UK Electric Commercial Vehicle Battery Pack Market Revenue Share (%), by Component 2024 & 2032
- Figure 18: North America UK Electric Commercial Vehicle Battery Pack Market Revenue (Million), by Material Type 2024 & 2032
- Figure 19: North America UK Electric Commercial Vehicle Battery Pack Market Revenue Share (%), by Material Type 2024 & 2032
- Figure 20: North America UK Electric Commercial Vehicle Battery Pack Market Revenue (Million), by Country 2024 & 2032
- Figure 21: North America UK Electric Commercial Vehicle Battery Pack Market Revenue Share (%), by Country 2024 & 2032
- Figure 22: South America UK Electric Commercial Vehicle Battery Pack Market Revenue (Million), by Body Type 2024 & 2032
- Figure 23: South America UK Electric Commercial Vehicle Battery Pack Market Revenue Share (%), by Body Type 2024 & 2032
- Figure 24: South America UK Electric Commercial Vehicle Battery Pack Market Revenue (Million), by Propulsion Type 2024 & 2032
- Figure 25: South America UK Electric Commercial Vehicle Battery Pack Market Revenue Share (%), by Propulsion Type 2024 & 2032
- Figure 26: South America UK Electric Commercial Vehicle Battery Pack Market Revenue (Million), by Battery Chemistry 2024 & 2032
- Figure 27: South America UK Electric Commercial Vehicle Battery Pack Market Revenue Share (%), by Battery Chemistry 2024 & 2032
- Figure 28: South America UK Electric Commercial Vehicle Battery Pack Market Revenue (Million), by Capacity 2024 & 2032
- Figure 29: South America UK Electric Commercial Vehicle Battery Pack Market Revenue Share (%), by Capacity 2024 & 2032
- Figure 30: South America UK Electric Commercial Vehicle Battery Pack Market Revenue (Million), by Battery Form 2024 & 2032
- Figure 31: South America UK Electric Commercial Vehicle Battery Pack Market Revenue Share (%), by Battery Form 2024 & 2032
- Figure 32: South America UK Electric Commercial Vehicle Battery Pack Market Revenue (Million), by Method 2024 & 2032
- Figure 33: South America UK Electric Commercial Vehicle Battery Pack Market Revenue Share (%), by Method 2024 & 2032
- Figure 34: South America UK Electric Commercial Vehicle Battery Pack Market Revenue (Million), by Component 2024 & 2032
- Figure 35: South America UK Electric Commercial Vehicle Battery Pack Market Revenue Share (%), by Component 2024 & 2032
- Figure 36: South America UK Electric Commercial Vehicle Battery Pack Market Revenue (Million), by Material Type 2024 & 2032
- Figure 37: South America UK Electric Commercial Vehicle Battery Pack Market Revenue Share (%), by Material Type 2024 & 2032
- Figure 38: South America UK Electric Commercial Vehicle Battery Pack Market Revenue (Million), by Country 2024 & 2032
- Figure 39: South America UK Electric Commercial Vehicle Battery Pack Market Revenue Share (%), by Country 2024 & 2032
- Figure 40: Europe UK Electric Commercial Vehicle Battery Pack Market Revenue (Million), by Body Type 2024 & 2032
- Figure 41: Europe UK Electric Commercial Vehicle Battery Pack Market Revenue Share (%), by Body Type 2024 & 2032
- Figure 42: Europe UK Electric Commercial Vehicle Battery Pack Market Revenue (Million), by Propulsion Type 2024 & 2032
- Figure 43: Europe UK Electric Commercial Vehicle Battery Pack Market Revenue Share (%), by Propulsion Type 2024 & 2032
- Figure 44: Europe UK Electric Commercial Vehicle Battery Pack Market Revenue (Million), by Battery Chemistry 2024 & 2032
- Figure 45: Europe UK Electric Commercial Vehicle Battery Pack Market Revenue Share (%), by Battery Chemistry 2024 & 2032
- Figure 46: Europe UK Electric Commercial Vehicle Battery Pack Market Revenue (Million), by Capacity 2024 & 2032
- Figure 47: Europe UK Electric Commercial Vehicle Battery Pack Market Revenue Share (%), by Capacity 2024 & 2032
- Figure 48: Europe UK Electric Commercial Vehicle Battery Pack Market Revenue (Million), by Battery Form 2024 & 2032
- Figure 49: Europe UK Electric Commercial Vehicle Battery Pack Market Revenue Share (%), by Battery Form 2024 & 2032
- Figure 50: Europe UK Electric Commercial Vehicle Battery Pack Market Revenue (Million), by Method 2024 & 2032
- Figure 51: Europe UK Electric Commercial Vehicle Battery Pack Market Revenue Share (%), by Method 2024 & 2032
- Figure 52: Europe UK Electric Commercial Vehicle Battery Pack Market Revenue (Million), by Component 2024 & 2032
- Figure 53: Europe UK Electric Commercial Vehicle Battery Pack Market Revenue Share (%), by Component 2024 & 2032
- Figure 54: Europe UK Electric Commercial Vehicle Battery Pack Market Revenue (Million), by Material Type 2024 & 2032
- Figure 55: Europe UK Electric Commercial Vehicle Battery Pack Market Revenue Share (%), by Material Type 2024 & 2032
- Figure 56: Europe UK Electric Commercial Vehicle Battery Pack Market Revenue (Million), by Country 2024 & 2032
- Figure 57: Europe UK Electric Commercial Vehicle Battery Pack Market Revenue Share (%), by Country 2024 & 2032
- Figure 58: Middle East & Africa UK Electric Commercial Vehicle Battery Pack Market Revenue (Million), by Body Type 2024 & 2032
- Figure 59: Middle East & Africa UK Electric Commercial Vehicle Battery Pack Market Revenue Share (%), by Body Type 2024 & 2032
- Figure 60: Middle East & Africa UK Electric Commercial Vehicle Battery Pack Market Revenue (Million), by Propulsion Type 2024 & 2032
- Figure 61: Middle East & Africa UK Electric Commercial Vehicle Battery Pack Market Revenue Share (%), by Propulsion Type 2024 & 2032
- Figure 62: Middle East & Africa UK Electric Commercial Vehicle Battery Pack Market Revenue (Million), by Battery Chemistry 2024 & 2032
- Figure 63: Middle East & Africa UK Electric Commercial Vehicle Battery Pack Market Revenue Share (%), by Battery Chemistry 2024 & 2032
- Figure 64: Middle East & Africa UK Electric Commercial Vehicle Battery Pack Market Revenue (Million), by Capacity 2024 & 2032
- Figure 65: Middle East & Africa UK Electric Commercial Vehicle Battery Pack Market Revenue Share (%), by Capacity 2024 & 2032
- Figure 66: Middle East & Africa UK Electric Commercial Vehicle Battery Pack Market Revenue (Million), by Battery Form 2024 & 2032
- Figure 67: Middle East & Africa UK Electric Commercial Vehicle Battery Pack Market Revenue Share (%), by Battery Form 2024 & 2032
- Figure 68: Middle East & Africa UK Electric Commercial Vehicle Battery Pack Market Revenue (Million), by Method 2024 & 2032
- Figure 69: Middle East & Africa UK Electric Commercial Vehicle Battery Pack Market Revenue Share (%), by Method 2024 & 2032
- Figure 70: Middle East & Africa UK Electric Commercial Vehicle Battery Pack Market Revenue (Million), by Component 2024 & 2032
- Figure 71: Middle East & Africa UK Electric Commercial Vehicle Battery Pack Market Revenue Share (%), by Component 2024 & 2032
- Figure 72: Middle East & Africa UK Electric Commercial Vehicle Battery Pack Market Revenue (Million), by Material Type 2024 & 2032
- Figure 73: Middle East & Africa UK Electric Commercial Vehicle Battery Pack Market Revenue Share (%), by Material Type 2024 & 2032
- Figure 74: Middle East & Africa UK Electric Commercial Vehicle Battery Pack Market Revenue (Million), by Country 2024 & 2032
- Figure 75: Middle East & Africa UK Electric Commercial Vehicle Battery Pack Market Revenue Share (%), by Country 2024 & 2032
- Figure 76: Asia Pacific UK Electric Commercial Vehicle Battery Pack Market Revenue (Million), by Body Type 2024 & 2032
- Figure 77: Asia Pacific UK Electric Commercial Vehicle Battery Pack Market Revenue Share (%), by Body Type 2024 & 2032
- Figure 78: Asia Pacific UK Electric Commercial Vehicle Battery Pack Market Revenue (Million), by Propulsion Type 2024 & 2032
- Figure 79: Asia Pacific UK Electric Commercial Vehicle Battery Pack Market Revenue Share (%), by Propulsion Type 2024 & 2032
- Figure 80: Asia Pacific UK Electric Commercial Vehicle Battery Pack Market Revenue (Million), by Battery Chemistry 2024 & 2032
- Figure 81: Asia Pacific UK Electric Commercial Vehicle Battery Pack Market Revenue Share (%), by Battery Chemistry 2024 & 2032
- Figure 82: Asia Pacific UK Electric Commercial Vehicle Battery Pack Market Revenue (Million), by Capacity 2024 & 2032
- Figure 83: Asia Pacific UK Electric Commercial Vehicle Battery Pack Market Revenue Share (%), by Capacity 2024 & 2032
- Figure 84: Asia Pacific UK Electric Commercial Vehicle Battery Pack Market Revenue (Million), by Battery Form 2024 & 2032
- Figure 85: Asia Pacific UK Electric Commercial Vehicle Battery Pack Market Revenue Share (%), by Battery Form 2024 & 2032
- Figure 86: Asia Pacific UK Electric Commercial Vehicle Battery Pack Market Revenue (Million), by Method 2024 & 2032
- Figure 87: Asia Pacific UK Electric Commercial Vehicle Battery Pack Market Revenue Share (%), by Method 2024 & 2032
- Figure 88: Asia Pacific UK Electric Commercial Vehicle Battery Pack Market Revenue (Million), by Component 2024 & 2032
- Figure 89: Asia Pacific UK Electric Commercial Vehicle Battery Pack Market Revenue Share (%), by Component 2024 & 2032
- Figure 90: Asia Pacific UK Electric Commercial Vehicle Battery Pack Market Revenue (Million), by Material Type 2024 & 2032
- Figure 91: Asia Pacific UK Electric Commercial Vehicle Battery Pack Market Revenue Share (%), by Material Type 2024 & 2032
- Figure 92: Asia Pacific UK Electric Commercial Vehicle Battery Pack Market Revenue (Million), by Country 2024 & 2032
- Figure 93: Asia Pacific UK Electric Commercial Vehicle Battery Pack Market Revenue Share (%), by Country 2024 & 2032
List of Tables
- Table 1: Global UK Electric Commercial Vehicle Battery Pack Market Revenue Million Forecast, by Region 2019 & 2032
- Table 2: Global UK Electric Commercial Vehicle Battery Pack Market Revenue Million Forecast, by Body Type 2019 & 2032
- Table 3: Global UK Electric Commercial Vehicle Battery Pack Market Revenue Million Forecast, by Propulsion Type 2019 & 2032
- Table 4: Global UK Electric Commercial Vehicle Battery Pack Market Revenue Million Forecast, by Battery Chemistry 2019 & 2032
- Table 5: Global UK Electric Commercial Vehicle Battery Pack Market Revenue Million Forecast, by Capacity 2019 & 2032
- Table 6: Global UK Electric Commercial Vehicle Battery Pack Market Revenue Million Forecast, by Battery Form 2019 & 2032
- Table 7: Global UK Electric Commercial Vehicle Battery Pack Market Revenue Million Forecast, by Method 2019 & 2032
- Table 8: Global UK Electric Commercial Vehicle Battery Pack Market Revenue Million Forecast, by Component 2019 & 2032
- Table 9: Global UK Electric Commercial Vehicle Battery Pack Market Revenue Million Forecast, by Material Type 2019 & 2032
- Table 10: Global UK Electric Commercial Vehicle Battery Pack Market Revenue Million Forecast, by Region 2019 & 2032
- Table 11: Global UK Electric Commercial Vehicle Battery Pack Market Revenue Million Forecast, by Country 2019 & 2032
- Table 12: England UK Electric Commercial Vehicle Battery Pack Market Revenue (Million) Forecast, by Application 2019 & 2032
- Table 13: Wales UK Electric Commercial Vehicle Battery Pack Market Revenue (Million) Forecast, by Application 2019 & 2032
- Table 14: Scotland UK Electric Commercial Vehicle Battery Pack Market Revenue (Million) Forecast, by Application 2019 & 2032
- Table 15: Northern UK Electric Commercial Vehicle Battery Pack Market Revenue (Million) Forecast, by Application 2019 & 2032
- Table 16: Ireland UK Electric Commercial Vehicle Battery Pack Market Revenue (Million) Forecast, by Application 2019 & 2032
- Table 17: Global UK Electric Commercial Vehicle Battery Pack Market Revenue Million Forecast, by Body Type 2019 & 2032
- Table 18: Global UK Electric Commercial Vehicle Battery Pack Market Revenue Million Forecast, by Propulsion Type 2019 & 2032
- Table 19: Global UK Electric Commercial Vehicle Battery Pack Market Revenue Million Forecast, by Battery Chemistry 2019 & 2032
- Table 20: Global UK Electric Commercial Vehicle Battery Pack Market Revenue Million Forecast, by Capacity 2019 & 2032
- Table 21: Global UK Electric Commercial Vehicle Battery Pack Market Revenue Million Forecast, by Battery Form 2019 & 2032
- Table 22: Global UK Electric Commercial Vehicle Battery Pack Market Revenue Million Forecast, by Method 2019 & 2032
- Table 23: Global UK Electric Commercial Vehicle Battery Pack Market Revenue Million Forecast, by Component 2019 & 2032
- Table 24: Global UK Electric Commercial Vehicle Battery Pack Market Revenue Million Forecast, by Material Type 2019 & 2032
- Table 25: Global UK Electric Commercial Vehicle Battery Pack Market Revenue Million Forecast, by Country 2019 & 2032
- Table 26: United States UK Electric Commercial Vehicle Battery Pack Market Revenue (Million) Forecast, by Application 2019 & 2032
- Table 27: Canada UK Electric Commercial Vehicle Battery Pack Market Revenue (Million) Forecast, by Application 2019 & 2032
- Table 28: Mexico UK Electric Commercial Vehicle Battery Pack Market Revenue (Million) Forecast, by Application 2019 & 2032
- Table 29: Global UK Electric Commercial Vehicle Battery Pack Market Revenue Million Forecast, by Body Type 2019 & 2032
- Table 30: Global UK Electric Commercial Vehicle Battery Pack Market Revenue Million Forecast, by Propulsion Type 2019 & 2032
- Table 31: Global UK Electric Commercial Vehicle Battery Pack Market Revenue Million Forecast, by Battery Chemistry 2019 & 2032
- Table 32: Global UK Electric Commercial Vehicle Battery Pack Market Revenue Million Forecast, by Capacity 2019 & 2032
- Table 33: Global UK Electric Commercial Vehicle Battery Pack Market Revenue Million Forecast, by Battery Form 2019 & 2032
- Table 34: Global UK Electric Commercial Vehicle Battery Pack Market Revenue Million Forecast, by Method 2019 & 2032
- Table 35: Global UK Electric Commercial Vehicle Battery Pack Market Revenue Million Forecast, by Component 2019 & 2032
- Table 36: Global UK Electric Commercial Vehicle Battery Pack Market Revenue Million Forecast, by Material Type 2019 & 2032
- Table 37: Global UK Electric Commercial Vehicle Battery Pack Market Revenue Million Forecast, by Country 2019 & 2032
- Table 38: Brazil UK Electric Commercial Vehicle Battery Pack Market Revenue (Million) Forecast, by Application 2019 & 2032
- Table 39: Argentina UK Electric Commercial Vehicle Battery Pack Market Revenue (Million) Forecast, by Application 2019 & 2032
- Table 40: Rest of South America UK Electric Commercial Vehicle Battery Pack Market Revenue (Million) Forecast, by Application 2019 & 2032
- Table 41: Global UK Electric Commercial Vehicle Battery Pack Market Revenue Million Forecast, by Body Type 2019 & 2032
- Table 42: Global UK Electric Commercial Vehicle Battery Pack Market Revenue Million Forecast, by Propulsion Type 2019 & 2032
- Table 43: Global UK Electric Commercial Vehicle Battery Pack Market Revenue Million Forecast, by Battery Chemistry 2019 & 2032
- Table 44: Global UK Electric Commercial Vehicle Battery Pack Market Revenue Million Forecast, by Capacity 2019 & 2032
- Table 45: Global UK Electric Commercial Vehicle Battery Pack Market Revenue Million Forecast, by Battery Form 2019 & 2032
- Table 46: Global UK Electric Commercial Vehicle Battery Pack Market Revenue Million Forecast, by Method 2019 & 2032
- Table 47: Global UK Electric Commercial Vehicle Battery Pack Market Revenue Million Forecast, by Component 2019 & 2032
- Table 48: Global UK Electric Commercial Vehicle Battery Pack Market Revenue Million Forecast, by Material Type 2019 & 2032
- Table 49: Global UK Electric Commercial Vehicle Battery Pack Market Revenue Million Forecast, by Country 2019 & 2032
- Table 50: United Kingdom UK Electric Commercial Vehicle Battery Pack Market Revenue (Million) Forecast, by Application 2019 & 2032
- Table 51: Germany UK Electric Commercial Vehicle Battery Pack Market Revenue (Million) Forecast, by Application 2019 & 2032
- Table 52: France UK Electric Commercial Vehicle Battery Pack Market Revenue (Million) Forecast, by Application 2019 & 2032
- Table 53: Italy UK Electric Commercial Vehicle Battery Pack Market Revenue (Million) Forecast, by Application 2019 & 2032
- Table 54: Spain UK Electric Commercial Vehicle Battery Pack Market Revenue (Million) Forecast, by Application 2019 & 2032
- Table 55: Russia UK Electric Commercial Vehicle Battery Pack Market Revenue (Million) Forecast, by Application 2019 & 2032
- Table 56: Benelux UK Electric Commercial Vehicle Battery Pack Market Revenue (Million) Forecast, by Application 2019 & 2032
- Table 57: Nordics UK Electric Commercial Vehicle Battery Pack Market Revenue (Million) Forecast, by Application 2019 & 2032
- Table 58: Rest of Europe UK Electric Commercial Vehicle Battery Pack Market Revenue (Million) Forecast, by Application 2019 & 2032
- Table 59: Global UK Electric Commercial Vehicle Battery Pack Market Revenue Million Forecast, by Body Type 2019 & 2032
- Table 60: Global UK Electric Commercial Vehicle Battery Pack Market Revenue Million Forecast, by Propulsion Type 2019 & 2032
- Table 61: Global UK Electric Commercial Vehicle Battery Pack Market Revenue Million Forecast, by Battery Chemistry 2019 & 2032
- Table 62: Global UK Electric Commercial Vehicle Battery Pack Market Revenue Million Forecast, by Capacity 2019 & 2032
- Table 63: Global UK Electric Commercial Vehicle Battery Pack Market Revenue Million Forecast, by Battery Form 2019 & 2032
- Table 64: Global UK Electric Commercial Vehicle Battery Pack Market Revenue Million Forecast, by Method 2019 & 2032
- Table 65: Global UK Electric Commercial Vehicle Battery Pack Market Revenue Million Forecast, by Component 2019 & 2032
- Table 66: Global UK Electric Commercial Vehicle Battery Pack Market Revenue Million Forecast, by Material Type 2019 & 2032
- Table 67: Global UK Electric Commercial Vehicle Battery Pack Market Revenue Million Forecast, by Country 2019 & 2032
- Table 68: Turkey UK Electric Commercial Vehicle Battery Pack Market Revenue (Million) Forecast, by Application 2019 & 2032
- Table 69: Israel UK Electric Commercial Vehicle Battery Pack Market Revenue (Million) Forecast, by Application 2019 & 2032
- Table 70: GCC UK Electric Commercial Vehicle Battery Pack Market Revenue (Million) Forecast, by Application 2019 & 2032
- Table 71: North Africa UK Electric Commercial Vehicle Battery Pack Market Revenue (Million) Forecast, by Application 2019 & 2032
- Table 72: South Africa UK Electric Commercial Vehicle Battery Pack Market Revenue (Million) Forecast, by Application 2019 & 2032
- Table 73: Rest of Middle East & Africa UK Electric Commercial Vehicle Battery Pack Market Revenue (Million) Forecast, by Application 2019 & 2032
- Table 74: Global UK Electric Commercial Vehicle Battery Pack Market Revenue Million Forecast, by Body Type 2019 & 2032
- Table 75: Global UK Electric Commercial Vehicle Battery Pack Market Revenue Million Forecast, by Propulsion Type 2019 & 2032
- Table 76: Global UK Electric Commercial Vehicle Battery Pack Market Revenue Million Forecast, by Battery Chemistry 2019 & 2032
- Table 77: Global UK Electric Commercial Vehicle Battery Pack Market Revenue Million Forecast, by Capacity 2019 & 2032
- Table 78: Global UK Electric Commercial Vehicle Battery Pack Market Revenue Million Forecast, by Battery Form 2019 & 2032
- Table 79: Global UK Electric Commercial Vehicle Battery Pack Market Revenue Million Forecast, by Method 2019 & 2032
- Table 80: Global UK Electric Commercial Vehicle Battery Pack Market Revenue Million Forecast, by Component 2019 & 2032
- Table 81: Global UK Electric Commercial Vehicle Battery Pack Market Revenue Million Forecast, by Material Type 2019 & 2032
- Table 82: Global UK Electric Commercial Vehicle Battery Pack Market Revenue Million Forecast, by Country 2019 & 2032
- Table 83: China UK Electric Commercial Vehicle Battery Pack Market Revenue (Million) Forecast, by Application 2019 & 2032
- Table 84: India UK Electric Commercial Vehicle Battery Pack Market Revenue (Million) Forecast, by Application 2019 & 2032
- Table 85: Japan UK Electric Commercial Vehicle Battery Pack Market Revenue (Million) Forecast, by Application 2019 & 2032
- Table 86: South Korea UK Electric Commercial Vehicle Battery Pack Market Revenue (Million) Forecast, by Application 2019 & 2032
- Table 87: ASEAN UK Electric Commercial Vehicle Battery Pack Market Revenue (Million) Forecast, by Application 2019 & 2032
- Table 88: Oceania UK Electric Commercial Vehicle Battery Pack Market Revenue (Million) Forecast, by Application 2019 & 2032
- Table 89: Rest of Asia Pacific UK Electric Commercial Vehicle Battery Pack Market Revenue (Million) Forecast, by Application 2019 & 2032
Frequently Asked Questions
1. What is the projected Compound Annual Growth Rate (CAGR) of the UK Electric Commercial Vehicle Battery Pack Market?
The projected CAGR is approximately > 6.50%.
2. Which companies are prominent players in the UK Electric Commercial Vehicle Battery Pack Market?
Key companies in the market include ENVISION AESC UK Ltd, Ilika Technolgies Ltd, ZF Friedrichshafen A, Hyperdrive Innovation Holdings Ltd, Samsung SDI Co Ltd, LG Energy Solution Ltd, Power By Britishvolt Ltd, Contemporary Amperex Technology Co Ltd (CATL), Robert Bosch GmbH, BYD Company Ltd, Amte Power PLC, SK Innovation Co Ltd.
3. What are the main segments of the UK Electric Commercial Vehicle Battery Pack Market?
The market segments include Body Type, Propulsion Type, Battery Chemistry, Capacity, Battery Form, Method, Component, Material Type.
4. Can you provide details about the market size?
The market size is estimated to be USD XX Million as of 2022.
5. What are some drivers contributing to market growth?
Increasing Demand and Sales of Commercial Vehicles is Driving the Market for Hydraulic Systems.
6. What are the notable trends driving market growth?
OTHER KEY INDUSTRY TRENDS COVERED IN THE REPORT.
7. Are there any restraints impacting market growth?
Increasing Replacement of Conventional Hydraulic Systems with Fully-electric Hydraulic Systems Acts as a Restraint.
8. Can you provide examples of recent developments in the market?
January 2023: Ilika is leading an £8.2 million collaboration with industry experts to deliver its solid-state battery ready for automotive level performance.November 2022: AMTE Power PLC has received a conversion notice in respect of GBP150,000 worth of convertible loan notes from Arena Investors LP, resulting in the issue of 245,514 new shares at a conversion price of 61.10 pence each.October 2022: AMTE Power has agreed on a production contract with the UK Battery Industrialisation Centre for its Ultra High Power cells.
9. What pricing options are available for accessing the report?
Pricing options include single-user, multi-user, and enterprise licenses priced at USD 3800, USD 4500, and USD 5800 respectively.
10. Is the market size provided in terms of value or volume?
The market size is provided in terms of value, measured in Million.
11. Are there any specific market keywords associated with the report?
Yes, the market keyword associated with the report is "UK Electric Commercial Vehicle Battery Pack Market," which aids in identifying and referencing the specific market segment covered.
12. How do I determine which pricing option suits my needs best?
The pricing options vary based on user requirements and access needs. Individual users may opt for single-user licenses, while businesses requiring broader access may choose multi-user or enterprise licenses for cost-effective access to the report.
13. Are there any additional resources or data provided in the UK Electric Commercial Vehicle Battery Pack Market report?
While the report offers comprehensive insights, it's advisable to review the specific contents or supplementary materials provided to ascertain if additional resources or data are available.
14. How can I stay updated on further developments or reports in the UK Electric Commercial Vehicle Battery Pack Market?
To stay informed about further developments, trends, and reports in the UK Electric Commercial Vehicle Battery Pack Market, consider subscribing to industry newsletters, following relevant companies and organizations, or regularly checking reputable industry news sources and publications.
Methodology
Step 1 - Identification of Relevant Samples Size from Population Database


Step 2 - Approaches for Defining Global Market Size (Value, Volume* & Price*)

Note*: In applicable scenarios
Step 3 - Data Sources
Primary Research
- Web Analytics
- Survey Reports
- Research Institute
- Latest Research Reports
- Opinion Leaders
Secondary Research
- Annual Reports
- White Paper
- Latest Press Release
- Industry Association
- Paid Database
- Investor Presentations

Step 4 - Data Triangulation
Involves using different sources of information in order to increase the validity of a study
These sources are likely to be stakeholders in a program - participants, other researchers, program staff, other community members, and so on.
Then we put all data in single framework & apply various statistical tools to find out the dynamic on the market.
During the analysis stage, feedback from the stakeholder groups would be compared to determine areas of agreement as well as areas of divergence


