Key Insights
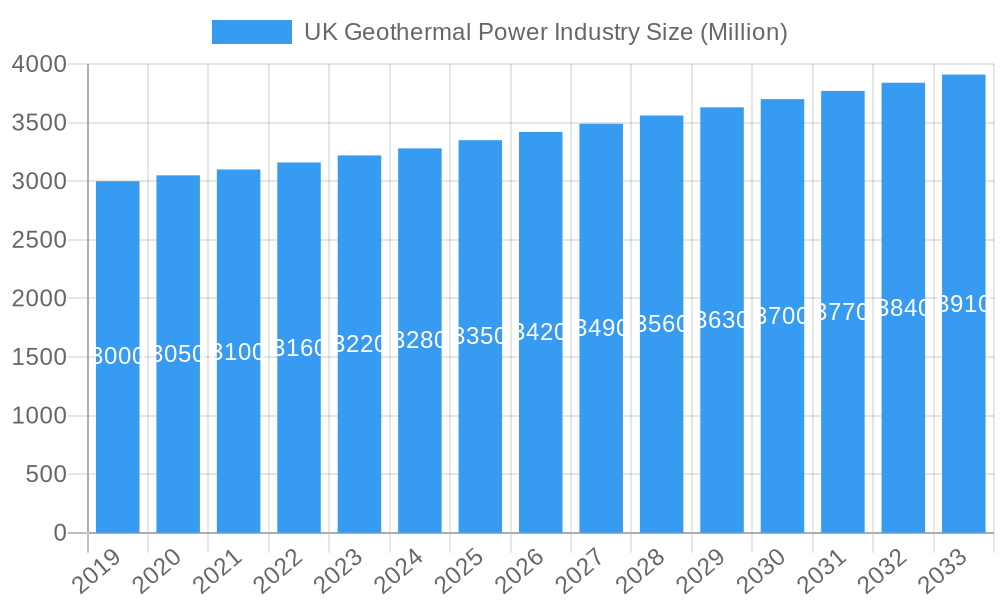
The UK geothermal power industry is poised for significant growth, projected to reach a substantial market size of approximately £3,500 million by 2025. This expansion is fueled by a confluence of powerful drivers, including the nation's ambitious net-zero targets, increasing demand for renewable energy sources, and advancements in geothermal technology. As the UK actively seeks to decarbonize its energy mix, geothermal power emerges as a reliable, baseload renewable option, offering a stable and consistent supply of energy. The market's compound annual growth rate (CAGR) is estimated to be above 1.00%, indicating a steady and sustained upward trajectory in market value. Key applications driving this growth include power generation, contributing significantly to the grid's renewable capacity, and direct heat utilization for residential, commercial, and industrial purposes, offering an efficient and environmentally friendly alternative to fossil fuels. Established players like Geothermal Engineering Ltd, GT Energy, and Engie SA are actively investing in and developing new projects, further solidifying the industry's potential.
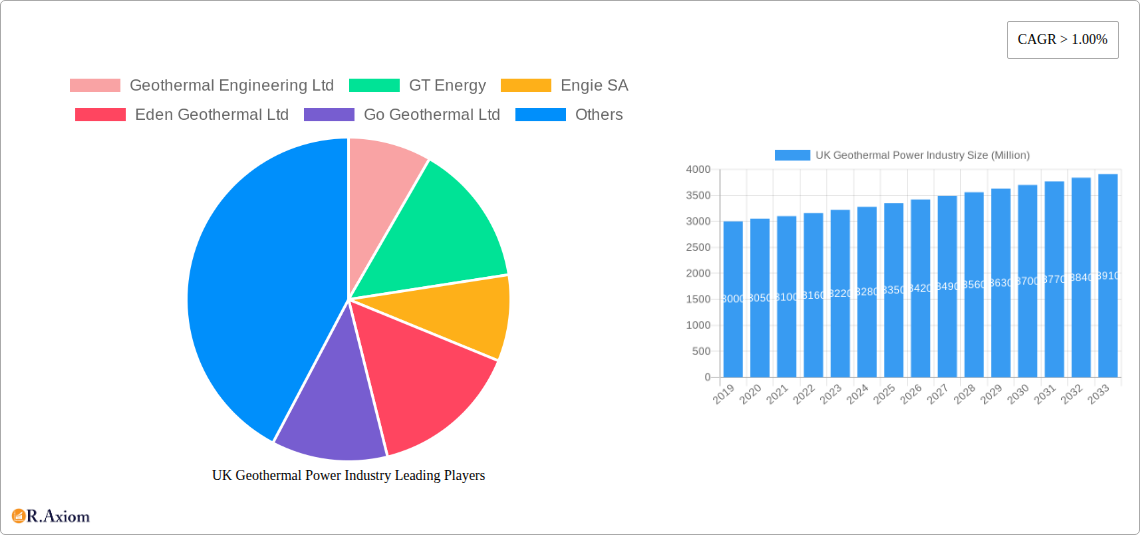
UK Geothermal Power Industry Market Size (In Billion)
The UK geothermal power market is currently experiencing a dynamic period, characterized by evolving trends such as the exploration of enhanced geothermal systems (EGS) and the increasing integration of geothermal with other renewable energy sources. These trends are instrumental in unlocking new opportunities and overcoming traditional geographical limitations. However, the industry also faces certain restraints, including high initial capital costs for exploration and drilling, the need for skilled labor, and evolving regulatory frameworks. Despite these challenges, the long-term outlook remains overwhelmingly positive. As technological innovations reduce drilling costs and improve efficiency, and as supportive government policies continue to materialize, the UK geothermal power sector is well-positioned to become a cornerstone of the nation's clean energy future. The market's projected expansion underscores its growing importance in achieving energy security and environmental sustainability.
UK Geothermal Power Industry Company Market Share
UK Geothermal Power Industry Market Concentration & Innovation
The UK geothermal power industry is characterized by moderate market concentration, with a blend of established energy players and specialized geothermal developers driving innovation. Major companies such as Engie SA, with its broad renewable energy portfolio, hold significant sway. However, dedicated geothermal firms like Geothermal Engineering Ltd and GT Energy are pioneering advanced drilling techniques and EGS (Enhanced Geothermal Systems) technologies, contributing to a dynamic competitive landscape. The market share for geothermal power in the UK is still nascent, projected to reach approximately £500 Million by 2033, but is experiencing robust growth. Innovation is primarily fueled by advancements in drilling efficiency, reservoir characterization, and closed-loop systems, reducing exploration risk and operational costs. Regulatory frameworks, while evolving, remain a critical factor, with government incentives and policy support playing a pivotal role in de-risking investments. Product substitutes, such as solar, wind, and biomass, present competition, but geothermal's consistent baseload power generation capability offers a unique advantage. End-user trends indicate a growing demand for clean, reliable energy, particularly for industrial process heat and district heating. Mergers and acquisitions (M&A) activity is anticipated to increase as larger energy companies seek to integrate geothermal assets into their renewable portfolios. Deal values are expected to escalate, potentially reaching £200 Million in M&A transactions by 2033, as consolidation and strategic partnerships become more prevalent.
UK Geothermal Power Industry Industry Trends & Insights
The UK geothermal power industry is poised for significant expansion, driven by a confluence of factors including the urgent need for decarbonization, increasing energy security concerns, and rapid technological advancements. The market is projected to witness a Compound Annual Growth Rate (CAGR) of approximately 15% from 2025 to 2033, a testament to its burgeoning potential. This growth is underpinned by a strategic shift towards diverse renewable energy sources, where geothermal's ability to provide consistent, baseload power distinguishes it from intermittent renewables like solar and wind. Technological disruptions are at the forefront of this evolution. Innovations in drilling technologies, such as advanced directional drilling and plasma drilling, are significantly reducing the cost and complexity of accessing geothermal resources. Furthermore, the development of Enhanced Geothermal Systems (EGS) is opening up vast untapped geothermal potential in regions previously considered uneconomical. The exploration and production of deeper, higher-temperature resources are becoming increasingly feasible. Consumer preferences are also shifting towards sustainable and reliable energy solutions. Industries requiring stable, high-temperature heat for processes, such as food and beverage manufacturing, agriculture, and district heating networks for urban areas, are increasingly recognizing geothermal's benefits. The environmental credentials of geothermal energy, offering a low-carbon footprint, are also appealing to environmentally conscious businesses and communities. Competitive dynamics within the UK geothermal market are intensifying. While traditional energy utilities are exploring geothermal as part of their diversification strategies, dedicated geothermal developers are leveraging specialized expertise to secure projects. Government support, through financial incentives, research grants, and streamlined permitting processes, is a critical enabler of this growth. The market penetration of geothermal power is expected to rise from a current estimate of 0.5% to approximately 3% by 2033, indicating substantial room for market expansion. Investment in geothermal exploration and development is anticipated to reach £3 Billion by 2033, reflecting growing confidence in the sector's long-term viability.
Dominant Markets & Segments in UK Geothermal Power Industry
Within the UK geothermal power industry, Power Generation stands out as the dominant application segment, currently commanding an estimated market share of 70% and projected to reach £350 Million by 2033. This dominance is propelled by the nation's commitment to renewable energy targets and the increasing demand for reliable, baseload electricity to complement intermittent sources like wind and solar. Economic policies play a crucial role, with government subsidies, feed-in tariffs, and carbon pricing mechanisms making geothermal power generation economically attractive. The development of robust grid infrastructure capable of integrating geothermal power plants further supports this segment. Infrastructure investment, particularly in the development of deep geothermal wells and power conversion facilities, is a key driver.
Direct Heat Utilization represents the secondary, yet rapidly growing, segment, currently estimated at 30% of the market and forecast to reach £150 Million by 2033. This segment's expansion is fueled by the increasing adoption of geothermal for district heating networks, industrial process heat, and agricultural applications like greenhouses. The economic benefits of direct heat utilization are compelling, offering significant cost savings on energy bills for businesses and communities compared to fossil fuel alternatives. Furthermore, the drive towards decarbonizing heating is a powerful catalyst, aligning with the UK's net-zero ambitions. Technological advancements in heat pump efficiency and the development of low-enthalpy geothermal systems are making direct heat utilization more accessible and cost-effective. Consumer preferences for sustainable and localized heating solutions are also contributing to the growth of this segment. Regional demand is highest in areas with suitable geological conditions and urban centers requiring centralized heating solutions.
UK Geothermal Power Industry Product Developments
The UK geothermal power industry is witnessing significant product developments focused on enhancing efficiency and reducing costs. Innovations in drilling technology, such as rotary jetting and plasma drilling, are making it faster and more economical to access geothermal reservoirs. Furthermore, advancements in reservoir stimulation techniques are improving the productivity of existing and new wells. The development of modular, scalable geothermal power plant designs is also a key trend, allowing for quicker deployment and better adaptation to specific site requirements. These innovations offer competitive advantages by lowering the levelized cost of energy (LCOE) and increasing the reliability of geothermal power generation and heat supply.
Report Scope & Segmentation Analysis
This report provides a comprehensive analysis of the UK geothermal power industry, segmenting the market by application. The Power Generation segment, projected to grow at a CAGR of 14% from 2025-2033, is driven by the need for baseload renewable electricity. Market size for this segment is estimated at £250 Million in 2025, growing to £350 Million by 2033. Competitive dynamics are shaped by technological advancements in drilling and power conversion.
The Direct Heat Utilization segment is expected to experience a higher CAGR of 16% during the forecast period. With an estimated market size of £100 Million in 2025, it is projected to reach £150 Million by 2033. This growth is fueled by demand for industrial process heat and district heating. Competitive dynamics here are influenced by the efficiency of heat pumps and the availability of suitable low-temperature resources.
Key Drivers of UK Geothermal Power Industry Growth
The UK geothermal power industry is propelled by several key drivers. Technological advancements in drilling and reservoir management are significantly reducing exploration risks and operational costs, making projects more economically viable. Government policies and incentives, including R&D grants and financial support mechanisms, are crucial for de-risking investments and encouraging new project development. The increasing demand for reliable, baseload renewable energy to complement intermittent sources like wind and solar is a major market pull factor. Furthermore, the growing urgency to decarbonize the UK's energy sector and achieve net-zero emissions targets positions geothermal as a vital component of the future energy mix.
Challenges in the UK Geothermal Power Industry Sector
Despite its potential, the UK geothermal power industry faces several challenges. High upfront capital investment for exploration and drilling remains a significant barrier, often requiring substantial risk mitigation strategies. Regulatory hurdles and permitting processes can be complex and time-consuming, leading to project delays. Geological uncertainties associated with identifying commercially viable geothermal resources introduce exploration risks. Supply chain limitations for specialized equipment and skilled labor can also impact project timelines and costs. Public perception and community engagement around drilling and infrastructure development are important considerations.
Emerging Opportunities in UK Geothermal Power Industry
Emerging opportunities in the UK geothermal power industry are substantial. The development of Enhanced Geothermal Systems (EGS) is unlocking vast untapped resources, expanding the geographical scope for geothermal energy production. Utilizing abandoned mine shafts for geothermal energy extraction presents a unique and potentially cost-effective opportunity. The integration of geothermal with other renewable energy sources, such as solar and wind, to create hybrid energy systems offers enhanced grid stability and reliability. There is also a growing opportunity in providing industrial process heat for sectors like food and beverage, and manufacturing, as these industries seek to decarbonize their operations.
Leading Players in the UK Geothermal Power Industry Market
- Geothermal Engineering Ltd
- GT Energy
- Engie SA
- Eden Geothermal Ltd
- Go Geothermal Ltd
- GI Energy
Key Developments in UK Geothermal Power Industry Industry
- 2023/11: Geothermal Engineering Ltd announced a significant milestone in the development of their enhanced geothermal system (EGS) project, demonstrating successful reservoir stimulation.
- 2024/03: GT Energy secured planning permission for a new geothermal district heating scheme, signaling growth in direct heat utilization.
- 2024/05: Engie SA announced an investment into advanced geothermal exploration technologies, highlighting their commitment to expanding their renewable portfolio.
- 2024/07: Eden Geothermal Ltd completed a successful drilling campaign, confirming the potential of a significant geothermal resource.
- 2025/01: Go Geothermal Ltd launched a new pilot project focusing on geothermal energy for agricultural applications.
- 2025/04: GI Energy announced a partnership to explore the potential of geothermal energy in repurposing former industrial sites.
Strategic Outlook for UK Geothermal Power Industry Market
The strategic outlook for the UK geothermal power industry is exceptionally positive, driven by supportive government policies and a clear demand for clean, reliable energy. The continued advancement in drilling and reservoir technologies will be critical growth catalysts, further reducing costs and expanding the addressable market. Increased investment in both power generation and direct heat utilization will solidify geothermal's role in the UK's decarbonization strategy. Strategic partnerships between established energy companies and specialized geothermal developers will accelerate project deployment. The sector is poised for substantial growth, projected to contribute significantly to the UK's energy security and net-zero targets, with a market value estimated to exceed £500 Million by 2033.
UK Geothermal Power Industry Segmentation
-
1. Application
- 1.1. Power Generation
- 1.2. Direct Heat Utilization
UK Geothermal Power Industry Segmentation By Geography
-
1. North America
- 1.1. United States
- 1.2. Canada
- 1.3. Mexico
-
2. South America
- 2.1. Brazil
- 2.2. Argentina
- 2.3. Rest of South America
-
3. Europe
- 3.1. United Kingdom
- 3.2. Germany
- 3.3. France
- 3.4. Italy
- 3.5. Spain
- 3.6. Russia
- 3.7. Benelux
- 3.8. Nordics
- 3.9. Rest of Europe
-
4. Middle East & Africa
- 4.1. Turkey
- 4.2. Israel
- 4.3. GCC
- 4.4. North Africa
- 4.5. South Africa
- 4.6. Rest of Middle East & Africa
-
5. Asia Pacific
- 5.1. China
- 5.2. India
- 5.3. Japan
- 5.4. South Korea
- 5.5. ASEAN
- 5.6. Oceania
- 5.7. Rest of Asia Pacific
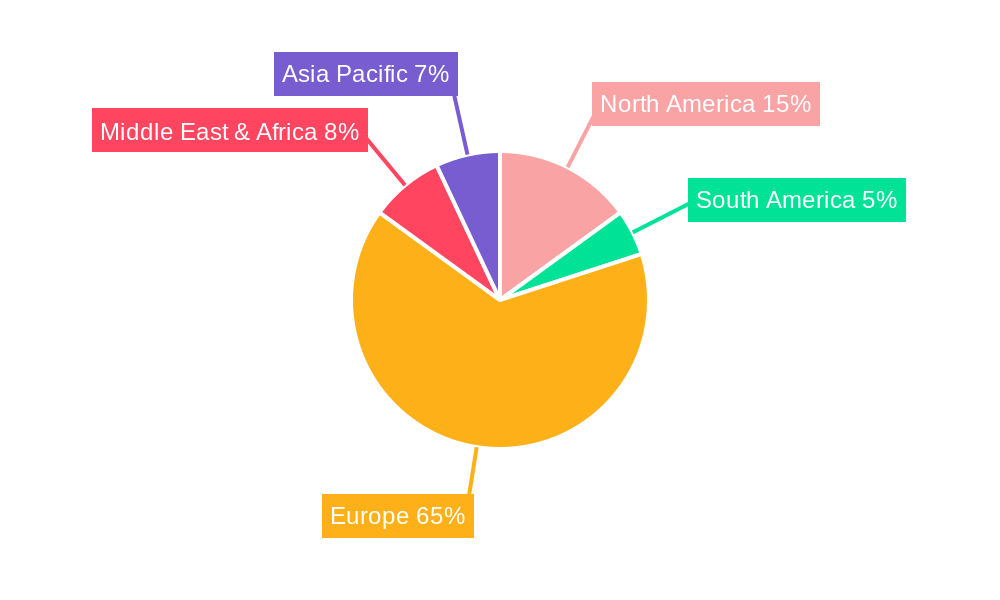
UK Geothermal Power Industry Regional Market Share
Geographic Coverage of UK Geothermal Power Industry
UK Geothermal Power Industry REPORT HIGHLIGHTS
| Aspects | Details |
|---|---|
| Study Period | 2020-2034 |
| Base Year | 2025 |
| Estimated Year | 2026 |
| Forecast Period | 2026-2034 |
| Historical Period | 2020-2025 |
| Growth Rate | CAGR of 15% from 2020-2034 |
| Segmentation |
|
Table of Contents
- 1. Introduction
- 1.1. Research Scope
- 1.2. Market Segmentation
- 1.3. Research Objective
- 1.4. Definitions and Assumptions
- 2. Executive Summary
- 2.1. Market Snapshot
- 3. Market Dynamics
- 3.1. Market Drivers
- 3.2. Market Restrains
- 3.3. Market Trends
- 3.4. Market Opportunities
- 4. Market Factor Analysis
- 4.1. Porters Five Forces
- 4.1.1. Bargaining Power of Suppliers
- 4.1.2. Bargaining Power of Buyers
- 4.1.3. Threat of New Entrants
- 4.1.4. Threat of Substitutes
- 4.1.5. Competitive Rivalry
- 4.2. PESTEL analysis
- 4.3. BCG Analysis
- 4.3.1. Stars (High Growth, High Market Share)
- 4.3.2. Cash Cows (Low Growth, High Market Share)
- 4.3.3. Question Mark (High Growth, Low Market Share)
- 4.3.4. Dogs (Low Growth, Low Market Share)
- 4.4. Ansoff Matrix Analysis
- 4.5. Supply Chain Analysis
- 4.6. Regulatory Landscape
- 4.7. Current Market Potential and Opportunity Assessment (TAM–SAM–SOM Framework)
- 4.8. RAX Analyst Note
- 4.1. Porters Five Forces
- 5. Market Analysis, Insights and Forecast 2021-2033
- 5.1. Market Analysis, Insights and Forecast - by Application
- 5.1.1. Power Generation
- 5.1.2. Direct Heat Utilization
- 5.2. Market Analysis, Insights and Forecast - by Region
- 5.2.1. North America
- 5.2.2. South America
- 5.2.3. Europe
- 5.2.4. Middle East & Africa
- 5.2.5. Asia Pacific
- 5.1. Market Analysis, Insights and Forecast - by Application
- 6. Global UK Geothermal Power Industry Analysis, Insights and Forecast, 2021-2033
- 6.1. Market Analysis, Insights and Forecast - by Application
- 6.1.1. Power Generation
- 6.1.2. Direct Heat Utilization
- 6.1. Market Analysis, Insights and Forecast - by Application
- 7. North America UK Geothermal Power Industry Analysis, Insights and Forecast, 2020-2032
- 7.1. Market Analysis, Insights and Forecast - by Application
- 7.1.1. Power Generation
- 7.1.2. Direct Heat Utilization
- 7.1. Market Analysis, Insights and Forecast - by Application
- 8. South America UK Geothermal Power Industry Analysis, Insights and Forecast, 2020-2032
- 8.1. Market Analysis, Insights and Forecast - by Application
- 8.1.1. Power Generation
- 8.1.2. Direct Heat Utilization
- 8.1. Market Analysis, Insights and Forecast - by Application
- 9. Europe UK Geothermal Power Industry Analysis, Insights and Forecast, 2020-2032
- 9.1. Market Analysis, Insights and Forecast - by Application
- 9.1.1. Power Generation
- 9.1.2. Direct Heat Utilization
- 9.1. Market Analysis, Insights and Forecast - by Application
- 10. Middle East & Africa UK Geothermal Power Industry Analysis, Insights and Forecast, 2020-2032
- 10.1. Market Analysis, Insights and Forecast - by Application
- 10.1.1. Power Generation
- 10.1.2. Direct Heat Utilization
- 10.1. Market Analysis, Insights and Forecast - by Application
- 11. Asia Pacific UK Geothermal Power Industry Analysis, Insights and Forecast, 2020-2032
- 11.1. Market Analysis, Insights and Forecast - by Application
- 11.1.1. Power Generation
- 11.1.2. Direct Heat Utilization
- 11.1. Market Analysis, Insights and Forecast - by Application
- 12. Competitive Analysis
- 12.1. Company Profiles
- 12.1.1 Geothermal Engineering Ltd
- 12.1.1.1. Company Overview
- 12.1.1.2. Products
- 12.1.1.3. Company Financials
- 12.1.1.4. SWOT Analysis
- 12.1.2 GT Energy
- 12.1.2.1. Company Overview
- 12.1.2.2. Products
- 12.1.2.3. Company Financials
- 12.1.2.4. SWOT Analysis
- 12.1.3 Engie SA
- 12.1.3.1. Company Overview
- 12.1.3.2. Products
- 12.1.3.3. Company Financials
- 12.1.3.4. SWOT Analysis
- 12.1.4 Eden Geothermal Ltd
- 12.1.4.1. Company Overview
- 12.1.4.2. Products
- 12.1.4.3. Company Financials
- 12.1.4.4. SWOT Analysis
- 12.1.5 Go Geothermal Ltd
- 12.1.5.1. Company Overview
- 12.1.5.2. Products
- 12.1.5.3. Company Financials
- 12.1.5.4. SWOT Analysis
- 12.1.6 GI Energy
- 12.1.6.1. Company Overview
- 12.1.6.2. Products
- 12.1.6.3. Company Financials
- 12.1.6.4. SWOT Analysis
- 12.1.1 Geothermal Engineering Ltd
- 12.2. Market Entropy
- 12.2.1 Company's Key Areas Served
- 12.2.2 Recent Developments
- 12.3. Company Market Share Analysis 2025
- 12.3.1 Top 5 Companies Market Share Analysis
- 12.3.2 Top 3 Companies Market Share Analysis
- 12.4. List of Potential Customers
- 13. Research Methodology
List of Figures
- Figure 1: Global UK Geothermal Power Industry Revenue Breakdown (million, %) by Region 2025 & 2033
- Figure 2: Global UK Geothermal Power Industry Volume Breakdown (Gigawatt, %) by Region 2025 & 2033
- Figure 3: North America UK Geothermal Power Industry Revenue (million), by Application 2025 & 2033
- Figure 4: North America UK Geothermal Power Industry Volume (Gigawatt), by Application 2025 & 2033
- Figure 5: North America UK Geothermal Power Industry Revenue Share (%), by Application 2025 & 2033
- Figure 6: North America UK Geothermal Power Industry Volume Share (%), by Application 2025 & 2033
- Figure 7: North America UK Geothermal Power Industry Revenue (million), by Country 2025 & 2033
- Figure 8: North America UK Geothermal Power Industry Volume (Gigawatt), by Country 2025 & 2033
- Figure 9: North America UK Geothermal Power Industry Revenue Share (%), by Country 2025 & 2033
- Figure 10: North America UK Geothermal Power Industry Volume Share (%), by Country 2025 & 2033
- Figure 11: South America UK Geothermal Power Industry Revenue (million), by Application 2025 & 2033
- Figure 12: South America UK Geothermal Power Industry Volume (Gigawatt), by Application 2025 & 2033
- Figure 13: South America UK Geothermal Power Industry Revenue Share (%), by Application 2025 & 2033
- Figure 14: South America UK Geothermal Power Industry Volume Share (%), by Application 2025 & 2033
- Figure 15: South America UK Geothermal Power Industry Revenue (million), by Country 2025 & 2033
- Figure 16: South America UK Geothermal Power Industry Volume (Gigawatt), by Country 2025 & 2033
- Figure 17: South America UK Geothermal Power Industry Revenue Share (%), by Country 2025 & 2033
- Figure 18: South America UK Geothermal Power Industry Volume Share (%), by Country 2025 & 2033
- Figure 19: Europe UK Geothermal Power Industry Revenue (million), by Application 2025 & 2033
- Figure 20: Europe UK Geothermal Power Industry Volume (Gigawatt), by Application 2025 & 2033
- Figure 21: Europe UK Geothermal Power Industry Revenue Share (%), by Application 2025 & 2033
- Figure 22: Europe UK Geothermal Power Industry Volume Share (%), by Application 2025 & 2033
- Figure 23: Europe UK Geothermal Power Industry Revenue (million), by Country 2025 & 2033
- Figure 24: Europe UK Geothermal Power Industry Volume (Gigawatt), by Country 2025 & 2033
- Figure 25: Europe UK Geothermal Power Industry Revenue Share (%), by Country 2025 & 2033
- Figure 26: Europe UK Geothermal Power Industry Volume Share (%), by Country 2025 & 2033
- Figure 27: Middle East & Africa UK Geothermal Power Industry Revenue (million), by Application 2025 & 2033
- Figure 28: Middle East & Africa UK Geothermal Power Industry Volume (Gigawatt), by Application 2025 & 2033
- Figure 29: Middle East & Africa UK Geothermal Power Industry Revenue Share (%), by Application 2025 & 2033
- Figure 30: Middle East & Africa UK Geothermal Power Industry Volume Share (%), by Application 2025 & 2033
- Figure 31: Middle East & Africa UK Geothermal Power Industry Revenue (million), by Country 2025 & 2033
- Figure 32: Middle East & Africa UK Geothermal Power Industry Volume (Gigawatt), by Country 2025 & 2033
- Figure 33: Middle East & Africa UK Geothermal Power Industry Revenue Share (%), by Country 2025 & 2033
- Figure 34: Middle East & Africa UK Geothermal Power Industry Volume Share (%), by Country 2025 & 2033
- Figure 35: Asia Pacific UK Geothermal Power Industry Revenue (million), by Application 2025 & 2033
- Figure 36: Asia Pacific UK Geothermal Power Industry Volume (Gigawatt), by Application 2025 & 2033
- Figure 37: Asia Pacific UK Geothermal Power Industry Revenue Share (%), by Application 2025 & 2033
- Figure 38: Asia Pacific UK Geothermal Power Industry Volume Share (%), by Application 2025 & 2033
- Figure 39: Asia Pacific UK Geothermal Power Industry Revenue (million), by Country 2025 & 2033
- Figure 40: Asia Pacific UK Geothermal Power Industry Volume (Gigawatt), by Country 2025 & 2033
- Figure 41: Asia Pacific UK Geothermal Power Industry Revenue Share (%), by Country 2025 & 2033
- Figure 42: Asia Pacific UK Geothermal Power Industry Volume Share (%), by Country 2025 & 2033
List of Tables
- Table 1: Global UK Geothermal Power Industry Revenue million Forecast, by Application 2020 & 2033
- Table 2: Global UK Geothermal Power Industry Volume Gigawatt Forecast, by Application 2020 & 2033
- Table 3: Global UK Geothermal Power Industry Revenue million Forecast, by Region 2020 & 2033
- Table 4: Global UK Geothermal Power Industry Volume Gigawatt Forecast, by Region 2020 & 2033
- Table 5: Global UK Geothermal Power Industry Revenue million Forecast, by Application 2020 & 2033
- Table 6: Global UK Geothermal Power Industry Volume Gigawatt Forecast, by Application 2020 & 2033
- Table 7: Global UK Geothermal Power Industry Revenue million Forecast, by Country 2020 & 2033
- Table 8: Global UK Geothermal Power Industry Volume Gigawatt Forecast, by Country 2020 & 2033
- Table 9: United States UK Geothermal Power Industry Revenue (million) Forecast, by Application 2020 & 2033
- Table 10: United States UK Geothermal Power Industry Volume (Gigawatt) Forecast, by Application 2020 & 2033
- Table 11: Canada UK Geothermal Power Industry Revenue (million) Forecast, by Application 2020 & 2033
- Table 12: Canada UK Geothermal Power Industry Volume (Gigawatt) Forecast, by Application 2020 & 2033
- Table 13: Mexico UK Geothermal Power Industry Revenue (million) Forecast, by Application 2020 & 2033
- Table 14: Mexico UK Geothermal Power Industry Volume (Gigawatt) Forecast, by Application 2020 & 2033
- Table 15: Global UK Geothermal Power Industry Revenue million Forecast, by Application 2020 & 2033
- Table 16: Global UK Geothermal Power Industry Volume Gigawatt Forecast, by Application 2020 & 2033
- Table 17: Global UK Geothermal Power Industry Revenue million Forecast, by Country 2020 & 2033
- Table 18: Global UK Geothermal Power Industry Volume Gigawatt Forecast, by Country 2020 & 2033
- Table 19: Brazil UK Geothermal Power Industry Revenue (million) Forecast, by Application 2020 & 2033
- Table 20: Brazil UK Geothermal Power Industry Volume (Gigawatt) Forecast, by Application 2020 & 2033
- Table 21: Argentina UK Geothermal Power Industry Revenue (million) Forecast, by Application 2020 & 2033
- Table 22: Argentina UK Geothermal Power Industry Volume (Gigawatt) Forecast, by Application 2020 & 2033
- Table 23: Rest of South America UK Geothermal Power Industry Revenue (million) Forecast, by Application 2020 & 2033
- Table 24: Rest of South America UK Geothermal Power Industry Volume (Gigawatt) Forecast, by Application 2020 & 2033
- Table 25: Global UK Geothermal Power Industry Revenue million Forecast, by Application 2020 & 2033
- Table 26: Global UK Geothermal Power Industry Volume Gigawatt Forecast, by Application 2020 & 2033
- Table 27: Global UK Geothermal Power Industry Revenue million Forecast, by Country 2020 & 2033
- Table 28: Global UK Geothermal Power Industry Volume Gigawatt Forecast, by Country 2020 & 2033
- Table 29: United Kingdom UK Geothermal Power Industry Revenue (million) Forecast, by Application 2020 & 2033
- Table 30: United Kingdom UK Geothermal Power Industry Volume (Gigawatt) Forecast, by Application 2020 & 2033
- Table 31: Germany UK Geothermal Power Industry Revenue (million) Forecast, by Application 2020 & 2033
- Table 32: Germany UK Geothermal Power Industry Volume (Gigawatt) Forecast, by Application 2020 & 2033
- Table 33: France UK Geothermal Power Industry Revenue (million) Forecast, by Application 2020 & 2033
- Table 34: France UK Geothermal Power Industry Volume (Gigawatt) Forecast, by Application 2020 & 2033
- Table 35: Italy UK Geothermal Power Industry Revenue (million) Forecast, by Application 2020 & 2033
- Table 36: Italy UK Geothermal Power Industry Volume (Gigawatt) Forecast, by Application 2020 & 2033
- Table 37: Spain UK Geothermal Power Industry Revenue (million) Forecast, by Application 2020 & 2033
- Table 38: Spain UK Geothermal Power Industry Volume (Gigawatt) Forecast, by Application 2020 & 2033
- Table 39: Russia UK Geothermal Power Industry Revenue (million) Forecast, by Application 2020 & 2033
- Table 40: Russia UK Geothermal Power Industry Volume (Gigawatt) Forecast, by Application 2020 & 2033
- Table 41: Benelux UK Geothermal Power Industry Revenue (million) Forecast, by Application 2020 & 2033
- Table 42: Benelux UK Geothermal Power Industry Volume (Gigawatt) Forecast, by Application 2020 & 2033
- Table 43: Nordics UK Geothermal Power Industry Revenue (million) Forecast, by Application 2020 & 2033
- Table 44: Nordics UK Geothermal Power Industry Volume (Gigawatt) Forecast, by Application 2020 & 2033
- Table 45: Rest of Europe UK Geothermal Power Industry Revenue (million) Forecast, by Application 2020 & 2033
- Table 46: Rest of Europe UK Geothermal Power Industry Volume (Gigawatt) Forecast, by Application 2020 & 2033
- Table 47: Global UK Geothermal Power Industry Revenue million Forecast, by Application 2020 & 2033
- Table 48: Global UK Geothermal Power Industry Volume Gigawatt Forecast, by Application 2020 & 2033
- Table 49: Global UK Geothermal Power Industry Revenue million Forecast, by Country 2020 & 2033
- Table 50: Global UK Geothermal Power Industry Volume Gigawatt Forecast, by Country 2020 & 2033
- Table 51: Turkey UK Geothermal Power Industry Revenue (million) Forecast, by Application 2020 & 2033
- Table 52: Turkey UK Geothermal Power Industry Volume (Gigawatt) Forecast, by Application 2020 & 2033
- Table 53: Israel UK Geothermal Power Industry Revenue (million) Forecast, by Application 2020 & 2033
- Table 54: Israel UK Geothermal Power Industry Volume (Gigawatt) Forecast, by Application 2020 & 2033
- Table 55: GCC UK Geothermal Power Industry Revenue (million) Forecast, by Application 2020 & 2033
- Table 56: GCC UK Geothermal Power Industry Volume (Gigawatt) Forecast, by Application 2020 & 2033
- Table 57: North Africa UK Geothermal Power Industry Revenue (million) Forecast, by Application 2020 & 2033
- Table 58: North Africa UK Geothermal Power Industry Volume (Gigawatt) Forecast, by Application 2020 & 2033
- Table 59: South Africa UK Geothermal Power Industry Revenue (million) Forecast, by Application 2020 & 2033
- Table 60: South Africa UK Geothermal Power Industry Volume (Gigawatt) Forecast, by Application 2020 & 2033
- Table 61: Rest of Middle East & Africa UK Geothermal Power Industry Revenue (million) Forecast, by Application 2020 & 2033
- Table 62: Rest of Middle East & Africa UK Geothermal Power Industry Volume (Gigawatt) Forecast, by Application 2020 & 2033
- Table 63: Global UK Geothermal Power Industry Revenue million Forecast, by Application 2020 & 2033
- Table 64: Global UK Geothermal Power Industry Volume Gigawatt Forecast, by Application 2020 & 2033
- Table 65: Global UK Geothermal Power Industry Revenue million Forecast, by Country 2020 & 2033
- Table 66: Global UK Geothermal Power Industry Volume Gigawatt Forecast, by Country 2020 & 2033
- Table 67: China UK Geothermal Power Industry Revenue (million) Forecast, by Application 2020 & 2033
- Table 68: China UK Geothermal Power Industry Volume (Gigawatt) Forecast, by Application 2020 & 2033
- Table 69: India UK Geothermal Power Industry Revenue (million) Forecast, by Application 2020 & 2033
- Table 70: India UK Geothermal Power Industry Volume (Gigawatt) Forecast, by Application 2020 & 2033
- Table 71: Japan UK Geothermal Power Industry Revenue (million) Forecast, by Application 2020 & 2033
- Table 72: Japan UK Geothermal Power Industry Volume (Gigawatt) Forecast, by Application 2020 & 2033
- Table 73: South Korea UK Geothermal Power Industry Revenue (million) Forecast, by Application 2020 & 2033
- Table 74: South Korea UK Geothermal Power Industry Volume (Gigawatt) Forecast, by Application 2020 & 2033
- Table 75: ASEAN UK Geothermal Power Industry Revenue (million) Forecast, by Application 2020 & 2033
- Table 76: ASEAN UK Geothermal Power Industry Volume (Gigawatt) Forecast, by Application 2020 & 2033
- Table 77: Oceania UK Geothermal Power Industry Revenue (million) Forecast, by Application 2020 & 2033
- Table 78: Oceania UK Geothermal Power Industry Volume (Gigawatt) Forecast, by Application 2020 & 2033
- Table 79: Rest of Asia Pacific UK Geothermal Power Industry Revenue (million) Forecast, by Application 2020 & 2033
- Table 80: Rest of Asia Pacific UK Geothermal Power Industry Volume (Gigawatt) Forecast, by Application 2020 & 2033
Frequently Asked Questions
1. What is the projected Compound Annual Growth Rate (CAGR) of the UK Geothermal Power Industry?
The projected CAGR is approximately 15%.
2. Which companies are prominent players in the UK Geothermal Power Industry?
Key companies in the market include Geothermal Engineering Ltd, GT Energy, Engie SA, Eden Geothermal Ltd, Go Geothermal Ltd, GI Energy.
3. What are the main segments of the UK Geothermal Power Industry?
The market segments include Application.
4. Can you provide details about the market size?
The market size is estimated to be USD 700 million as of 2022.
5. What are some drivers contributing to market growth?
Increasing Population Growth and Infrastructure Development.
6. What are the notable trends driving market growth?
Direct Heat Utilization is Likely to Dominate the Market.
7. Are there any restraints impacting market growth?
High Operational and Maintenance Costs.
8. Can you provide examples of recent developments in the market?
N/A
9. What pricing options are available for accessing the report?
Pricing options include single-user, multi-user, and enterprise licenses priced at USD 3800, USD 4500, and USD 5800 respectively.
10. Is the market size provided in terms of value or volume?
The market size is provided in terms of value, measured in million and volume, measured in Gigawatt.
11. Are there any specific market keywords associated with the report?
Yes, the market keyword associated with the report is "UK Geothermal Power Industry," which aids in identifying and referencing the specific market segment covered.
12. How do I determine which pricing option suits my needs best?
The pricing options vary based on user requirements and access needs. Individual users may opt for single-user licenses, while businesses requiring broader access may choose multi-user or enterprise licenses for cost-effective access to the report.
13. Are there any additional resources or data provided in the UK Geothermal Power Industry report?
While the report offers comprehensive insights, it's advisable to review the specific contents or supplementary materials provided to ascertain if additional resources or data are available.
14. How can I stay updated on further developments or reports in the UK Geothermal Power Industry?
To stay informed about further developments, trends, and reports in the UK Geothermal Power Industry, consider subscribing to industry newsletters, following relevant companies and organizations, or regularly checking reputable industry news sources and publications.
Methodology
Step 1 - Identification of Relevant Samples Size from Population Database


Step 2 - Approaches for Defining Global Market Size (Value, Volume* & Price*)

Note*: In applicable scenarios
Step 3 - Data Sources
Primary Research
- Web Analytics
- Survey Reports
- Research Institute
- Latest Research Reports
- Opinion Leaders
Secondary Research
- Annual Reports
- White Paper
- Latest Press Release
- Industry Association
- Paid Database
- Investor Presentations

Step 4 - Data Triangulation
Involves using different sources of information in order to increase the validity of a study
These sources are likely to be stakeholders in a program - participants, other researchers, program staff, other community members, and so on.
Then we put all data in single framework & apply various statistical tools to find out the dynamic on the market.
During the analysis stage, feedback from the stakeholder groups would be compared to determine areas of agreement as well as areas of divergence

