
Key Insights
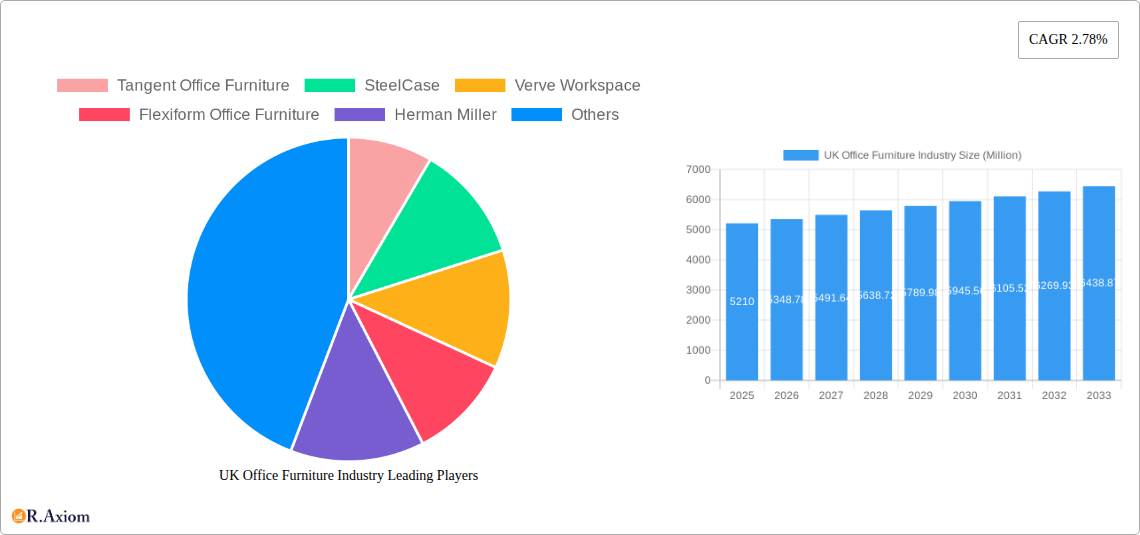
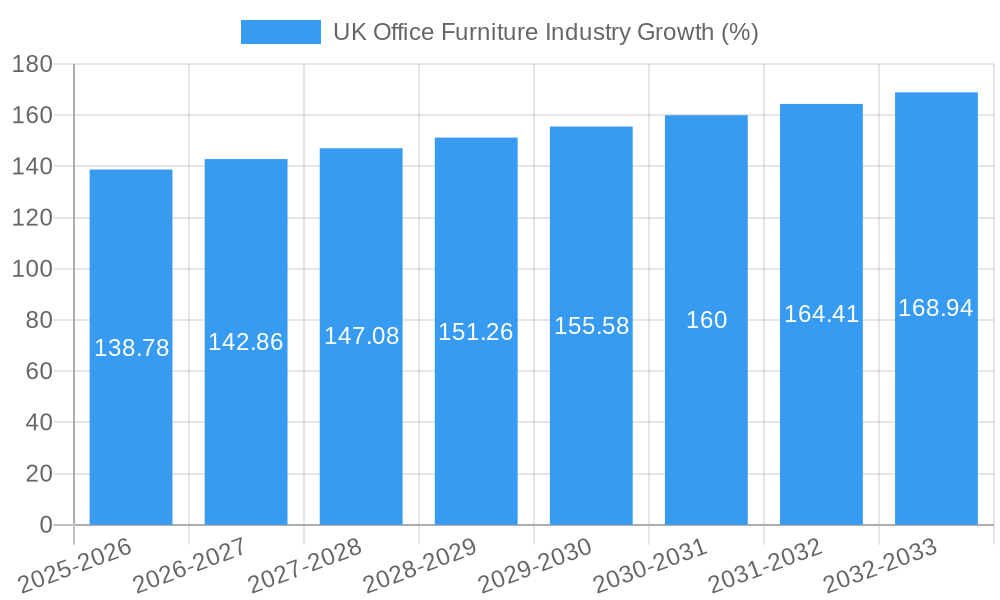
The UK office furniture market, valued at £5.21 billion in 2025, is projected to experience steady growth, driven by a compound annual growth rate (CAGR) of 2.78% from 2025 to 2033. This growth is fueled by several key factors. Firstly, the increasing adoption of hybrid working models necessitates adaptable and ergonomic furniture solutions, boosting demand for adjustable desks, comfortable seating, and storage solutions. Secondly, a growing emphasis on employee wellbeing and productivity is leading companies to invest in high-quality, functional office furniture that enhances the work environment. This trend is particularly pronounced in larger corporations and businesses focusing on improving their employee retention rates. Furthermore, the refurbishment and development of existing office spaces, along with the construction of new commercial buildings, contribute significantly to market expansion. The market segmentation reveals a strong demand across various product categories, including seating, tables, storage, and desks, with the "others" segment likely encompassing specialized furniture items like collaborative workspaces and partitions. Distribution channels are diverse, encompassing home centers catering to small businesses and individual needs, flagship stores focused on premium brands, specialty stores targeting niche markets, and rapidly growing online channels offering convenience and accessibility.
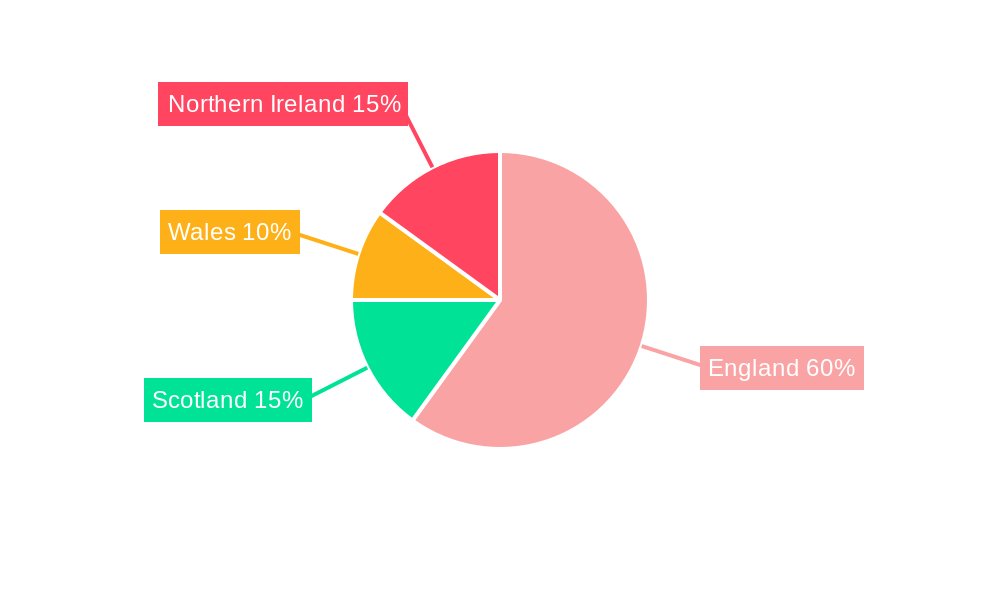
However, the market faces certain constraints. Economic fluctuations and potential downturns can impact investment in office furniture. Additionally, increasing raw material costs and supply chain disruptions could exert upward pressure on prices, potentially affecting market growth. Competition among established players such as SteelCase, Herman Miller, and Knoll, alongside emerging brands, is intense, requiring companies to offer innovative designs, superior quality, and competitive pricing strategies to succeed. The regional breakdown within the UK (England, Wales, Scotland, and Northern Ireland) shows a higher concentration in more densely populated areas like London and surrounding regions, with growth potentially slower in less urbanized areas. The forecast period suggests continued market expansion, underpinned by the ongoing trends of workplace modernization and investment in employee well-being. Specific regional performance variations are dependent on local economic activity and the rate of office development in each area.
UK Office Furniture Industry: A Comprehensive Market Report (2019-2033)
This detailed report provides a comprehensive analysis of the UK office furniture industry, covering market size, segmentation, key players, growth drivers, challenges, and future opportunities. The study period spans from 2019 to 2033, with 2025 serving as both the base and estimated year. The report offers actionable insights for industry stakeholders, investors, and businesses operating within this dynamic sector.
UK Office Furniture Industry Market Concentration & Innovation
This section analyzes the competitive landscape of the UK office furniture market, exploring factors such as market concentration, innovation drivers, regulatory frameworks, product substitutes, end-user trends, and mergers and acquisitions (M&A) activities. The UK office furniture market exhibits a moderately concentrated structure with a few dominant players and several smaller niche operators. Market share data from 2024 reveals that the top 5 players collectively account for approximately xx% of the market, while the remaining market share is distributed among a large number of smaller players.
- Market Leaders: Steelcase, Herman Miller, Knoll, and others hold significant market share due to their strong brand recognition, established distribution networks, and innovative product portfolios.
- Innovation Drivers: The industry is driven by advancements in ergonomics, sustainability, technology integration (smart furniture), and design aesthetics. Growing demand for adaptable and flexible workspace solutions fuels innovation.
- Regulatory Framework: UK regulations concerning workplace safety, fire safety, and environmental standards significantly influence product design and manufacturing processes.
- Product Substitutes: The rise of co-working spaces and remote working presents some competition, but demand for high-quality, durable office furniture remains robust in traditional office settings.
- End-User Trends: A shift toward hybrid work models, emphasizing employee well-being and creating collaborative environments, is transforming the demand for office furniture.
- M&A Activity: The acquisition of Halcon by Steelcase in 2022 for USD 127.5 million exemplifies the strategic consolidation occurring within the industry. Further M&A activity is anticipated driven by the desire for scale and expansion into new market segments. The total value of M&A deals in the UK office furniture industry between 2019 and 2024 is estimated at £xx million.
UK Office Furniture Industry Industry Trends & Insights
This section delves into the key trends shaping the UK office furniture market. The market is experiencing steady growth fueled by a recovering economy, increased investment in commercial real estate, and evolving workplace trends. The market is expected to witness a Compound Annual Growth Rate (CAGR) of xx% during the forecast period (2025-2033). Market penetration of technologically advanced office furniture is gradually increasing, particularly in large corporate settings. Consumer preferences are leaning towards ergonomic, sustainable, and aesthetically pleasing designs. Competitive dynamics are characterized by ongoing innovation, strategic partnerships, and a focus on enhancing customer experience. The rise of e-commerce platforms is impacting the distribution landscape, although traditional channels like specialty stores remain significant. The increasing demand for adaptable and flexible workspace solutions is driving innovation in modular and reconfigurable furniture. Furthermore, the focus on sustainability is gaining momentum, leading to the adoption of eco-friendly materials and manufacturing processes.
Dominant Markets & Segments in UK Office Furniture Industry
This section identifies the leading segments within the UK office furniture market. The analysis considers both product type and distribution channels.
Dominant Product Types:
- Seating: This segment holds the largest market share due to high demand across various office settings. Key drivers include ergonomic designs, advancements in materials, and the increasing awareness of employee well-being.
- Desks: This segment maintains significant market share due to its fundamental role in office setups. Demand is influenced by changing workspace layouts and the increasing adoption of sit-stand desks.
- Storage: The storage segment experiences robust demand driven by the need for organized and efficient workspace solutions.
Dominant Distribution Channels:
- Specialty Stores: Specialty stores cater to professional clients seeking high-quality, design-focused furniture, contributing significantly to the market share.
- Online Stores: The growth of e-commerce platforms is creating a new channel that offers convenience and broader reach, especially for smaller businesses and individual buyers. This segment is rapidly expanding.
Key Drivers:
- Government policies promoting economic growth and investment in infrastructure positively impact the office furniture market.
- The increasing number of startups and SMEs contributes to demand across various product segments.
- The expansion of the service sector stimulates the need for modern and well-equipped office spaces.
UK Office Furniture Industry Product Developments
Recent product innovations focus on enhancing ergonomics, incorporating sustainable materials, and integrating technology. Smart desks with adjustable heights, collaborative work tables with integrated charging ports, and modular furniture systems that easily adapt to changing needs are gaining popularity. These innovations aim to address the evolving needs of modern workplaces, while focusing on sustainability and employee well-being. The market fit is strong due to the convergence of technological advancements, changing work styles, and a growing emphasis on employee health and productivity.
Report Scope & Segmentation Analysis
This report segments the UK office furniture market by product type (Seating, Tables, Storage, Desks, Other Office Furniture) and distribution channel (Home Centers, Flagship Stores, Specialty Stores, Online Stores, Other Distribution Channels). Each segment's market size, growth projections, and competitive dynamics are analyzed separately. The "Other Office Furniture" category encompasses a diverse range of products, from filing cabinets to partitions, each with its own distinct market characteristics. The "Other Distribution Channels" category include contract furniture dealers and direct sales. Growth projections indicate a varied pace of expansion for each segment based on market trends and consumer preferences.
Key Drivers of UK Office Furniture Industry Growth
Several factors contribute to the growth of the UK office furniture industry. Technological advancements driving ergonomics and sustainability are creating new opportunities. Economic growth and increased business investment are boosting demand. Government regulations focusing on workplace safety and environmental standards play a key role in shaping the market. The shift towards hybrid work models is also creating opportunities for adaptable and flexible furniture solutions.
Challenges in the UK Office Furniture Industry Sector
The UK office furniture industry faces several challenges. Supply chain disruptions and increasing material costs impact profitability and product availability. Intense competition from both domestic and international players creates pricing pressures. Fluctuations in the UK economy, impacting investment in office spaces, can lead to reduced demand. Regulatory changes related to environmental sustainability require significant adaptations in manufacturing processes. These challenges, if not properly managed, can hinder the growth of the industry.
Emerging Opportunities in UK Office Furniture Industry
Emerging opportunities include a growing demand for sustainable and eco-friendly furniture, increasing adoption of smart office technology, and the rise of co-working spaces. The market for ergonomic and adaptable furniture is expanding significantly. The integration of technology into furniture and workspace solutions presents significant growth potential. Focusing on modular and reconfigurable designs catering to hybrid work models is a key area for future expansion.
Leading Players in the UK Office Furniture Industry Market
- Tangent Office Furniture
- SteelCase
- Verve Workspace
- Flexiform Office Furniture
- Herman Miller
- Verco Office Furniture
- Lee & Plumpton
- The Frem Group
- Margolis Furniture
- Knoll
- Metric Office Furniture
- HumanScale
- Urban Office
Key Developments in UK Office Furniture Industry Industry
- May 2022: Steelcase Inc. acquired Halcon for USD 127.5 million, expanding its product portfolio and market reach.
- 2022: Herman Miller launched the Zeph Chair, a collaboration with Studio 7.5, demonstrating ongoing innovation in ergonomic seating.
- 2022 Q1: Steelcase reported revenue of USD 740.7 million, reflecting the market conditions and impact of the ongoing economic recovery post-pandemic.
Strategic Outlook for UK Office Furniture Industry Market
The UK office furniture market is poised for continued growth, driven by technological advancements, evolving workplace trends, and a recovering economy. The focus on sustainability, ergonomics, and adaptable workspace solutions will continue to shape product development and market dynamics. Opportunities lie in catering to hybrid work models, leveraging technology integration, and focusing on environmentally conscious manufacturing practices. The market will likely see continued consolidation through mergers and acquisitions, leading to a more concentrated landscape.
UK Office Furniture Industry Segmentation
-
1. Type
- 1.1. Seating
- 1.2. Tables
- 1.3. Storage
- 1.4. Other Office Furniture
-
2. Distribution Channel
- 2.1. Home Centers
- 2.2. Flagship Stores
- 2.3. Specialty Stores
- 2.4. Online Stores
- 2.5. Other Distribution Channels
UK Office Furniture Industry Segmentation By Geography
-
1. North America
- 1.1. United States
- 1.2. Canada
- 1.3. Mexico
-
2. South America
- 2.1. Brazil
- 2.2. Argentina
- 2.3. Rest of South America
-
3. Europe
- 3.1. United Kingdom
- 3.2. Germany
- 3.3. France
- 3.4. Italy
- 3.5. Spain
- 3.6. Russia
- 3.7. Benelux
- 3.8. Nordics
- 3.9. Rest of Europe
-
4. Middle East & Africa
- 4.1. Turkey
- 4.2. Israel
- 4.3. GCC
- 4.4. North Africa
- 4.5. South Africa
- 4.6. Rest of Middle East & Africa
-
5. Asia Pacific
- 5.1. China
- 5.2. India
- 5.3. Japan
- 5.4. South Korea
- 5.5. ASEAN
- 5.6. Oceania
- 5.7. Rest of Asia Pacific
UK Office Furniture Industry REPORT HIGHLIGHTS
| Aspects | Details |
|---|---|
| Study Period | 2019-2033 |
| Base Year | 2024 |
| Estimated Year | 2025 |
| Forecast Period | 2025-2033 |
| Historical Period | 2019-2024 |
| Growth Rate | CAGR of 2.78% from 2019-2033 |
| Segmentation |
|
Table of Contents
- 1. Introduction
- 1.1. Research Scope
- 1.2. Market Segmentation
- 1.3. Research Methodology
- 1.4. Definitions and Assumptions
- 2. Executive Summary
- 2.1. Introduction
- 3. Market Dynamics
- 3.1. Introduction
- 3.2. Market Drivers
- 3.2.1. Tech-Integrated Furniture are Helping to Grow the Market
- 3.3. Market Restrains
- 3.3.1. Raw Material Cost Barrier to Growth
- 3.4. Market Trends
- 3.4.1. Growing Flexible Office Spaces in the Country
- 4. Market Factor Analysis
- 4.1. Porters Five Forces
- 4.2. Supply/Value Chain
- 4.3. PESTEL analysis
- 4.4. Market Entropy
- 4.5. Patent/Trademark Analysis
- 5. Global UK Office Furniture Industry Analysis, Insights and Forecast, 2019-2031
- 5.1. Market Analysis, Insights and Forecast - by Type
- 5.1.1. Seating
- 5.1.2. Tables
- 5.1.3. Storage
- 5.1.4. Other Office Furniture
- 5.2. Market Analysis, Insights and Forecast - by Distribution Channel
- 5.2.1. Home Centers
- 5.2.2. Flagship Stores
- 5.2.3. Specialty Stores
- 5.2.4. Online Stores
- 5.2.5. Other Distribution Channels
- 5.3. Market Analysis, Insights and Forecast - by Region
- 5.3.1. North America
- 5.3.2. South America
- 5.3.3. Europe
- 5.3.4. Middle East & Africa
- 5.3.5. Asia Pacific
- 5.1. Market Analysis, Insights and Forecast - by Type
- 6. North America UK Office Furniture Industry Analysis, Insights and Forecast, 2019-2031
- 6.1. Market Analysis, Insights and Forecast - by Type
- 6.1.1. Seating
- 6.1.2. Tables
- 6.1.3. Storage
- 6.1.4. Other Office Furniture
- 6.2. Market Analysis, Insights and Forecast - by Distribution Channel
- 6.2.1. Home Centers
- 6.2.2. Flagship Stores
- 6.2.3. Specialty Stores
- 6.2.4. Online Stores
- 6.2.5. Other Distribution Channels
- 6.1. Market Analysis, Insights and Forecast - by Type
- 7. South America UK Office Furniture Industry Analysis, Insights and Forecast, 2019-2031
- 7.1. Market Analysis, Insights and Forecast - by Type
- 7.1.1. Seating
- 7.1.2. Tables
- 7.1.3. Storage
- 7.1.4. Other Office Furniture
- 7.2. Market Analysis, Insights and Forecast - by Distribution Channel
- 7.2.1. Home Centers
- 7.2.2. Flagship Stores
- 7.2.3. Specialty Stores
- 7.2.4. Online Stores
- 7.2.5. Other Distribution Channels
- 7.1. Market Analysis, Insights and Forecast - by Type
- 8. Europe UK Office Furniture Industry Analysis, Insights and Forecast, 2019-2031
- 8.1. Market Analysis, Insights and Forecast - by Type
- 8.1.1. Seating
- 8.1.2. Tables
- 8.1.3. Storage
- 8.1.4. Other Office Furniture
- 8.2. Market Analysis, Insights and Forecast - by Distribution Channel
- 8.2.1. Home Centers
- 8.2.2. Flagship Stores
- 8.2.3. Specialty Stores
- 8.2.4. Online Stores
- 8.2.5. Other Distribution Channels
- 8.1. Market Analysis, Insights and Forecast - by Type
- 9. Middle East & Africa UK Office Furniture Industry Analysis, Insights and Forecast, 2019-2031
- 9.1. Market Analysis, Insights and Forecast - by Type
- 9.1.1. Seating
- 9.1.2. Tables
- 9.1.3. Storage
- 9.1.4. Other Office Furniture
- 9.2. Market Analysis, Insights and Forecast - by Distribution Channel
- 9.2.1. Home Centers
- 9.2.2. Flagship Stores
- 9.2.3. Specialty Stores
- 9.2.4. Online Stores
- 9.2.5. Other Distribution Channels
- 9.1. Market Analysis, Insights and Forecast - by Type
- 10. Asia Pacific UK Office Furniture Industry Analysis, Insights and Forecast, 2019-2031
- 10.1. Market Analysis, Insights and Forecast - by Type
- 10.1.1. Seating
- 10.1.2. Tables
- 10.1.3. Storage
- 10.1.4. Other Office Furniture
- 10.2. Market Analysis, Insights and Forecast - by Distribution Channel
- 10.2.1. Home Centers
- 10.2.2. Flagship Stores
- 10.2.3. Specialty Stores
- 10.2.4. Online Stores
- 10.2.5. Other Distribution Channels
- 10.1. Market Analysis, Insights and Forecast - by Type
- 11. England UK Office Furniture Industry Analysis, Insights and Forecast, 2019-2031
- 12. Wales UK Office Furniture Industry Analysis, Insights and Forecast, 2019-2031
- 13. Scotland UK Office Furniture Industry Analysis, Insights and Forecast, 2019-2031
- 14. Northern UK Office Furniture Industry Analysis, Insights and Forecast, 2019-2031
- 15. Ireland UK Office Furniture Industry Analysis, Insights and Forecast, 2019-2031
- 16. Competitive Analysis
- 16.1. Global Market Share Analysis 2024
- 16.2. Company Profiles
- 16.2.1 Tangent Office Furniture
- 16.2.1.1. Overview
- 16.2.1.2. Products
- 16.2.1.3. SWOT Analysis
- 16.2.1.4. Recent Developments
- 16.2.1.5. Financials (Based on Availability)
- 16.2.2 SteelCase
- 16.2.2.1. Overview
- 16.2.2.2. Products
- 16.2.2.3. SWOT Analysis
- 16.2.2.4. Recent Developments
- 16.2.2.5. Financials (Based on Availability)
- 16.2.3 Verve Workspace
- 16.2.3.1. Overview
- 16.2.3.2. Products
- 16.2.3.3. SWOT Analysis
- 16.2.3.4. Recent Developments
- 16.2.3.5. Financials (Based on Availability)
- 16.2.4 Flexiform Office Furniture
- 16.2.4.1. Overview
- 16.2.4.2. Products
- 16.2.4.3. SWOT Analysis
- 16.2.4.4. Recent Developments
- 16.2.4.5. Financials (Based on Availability)
- 16.2.5 Herman Miller
- 16.2.5.1. Overview
- 16.2.5.2. Products
- 16.2.5.3. SWOT Analysis
- 16.2.5.4. Recent Developments
- 16.2.5.5. Financials (Based on Availability)
- 16.2.6 Verco Office Furniture
- 16.2.6.1. Overview
- 16.2.6.2. Products
- 16.2.6.3. SWOT Analysis
- 16.2.6.4. Recent Developments
- 16.2.6.5. Financials (Based on Availability)
- 16.2.7 Lee & Plumpton
- 16.2.7.1. Overview
- 16.2.7.2. Products
- 16.2.7.3. SWOT Analysis
- 16.2.7.4. Recent Developments
- 16.2.7.5. Financials (Based on Availability)
- 16.2.8 The Frem Group
- 16.2.8.1. Overview
- 16.2.8.2. Products
- 16.2.8.3. SWOT Analysis
- 16.2.8.4. Recent Developments
- 16.2.8.5. Financials (Based on Availability)
- 16.2.9 Margolis Furniture
- 16.2.9.1. Overview
- 16.2.9.2. Products
- 16.2.9.3. SWOT Analysis
- 16.2.9.4. Recent Developments
- 16.2.9.5. Financials (Based on Availability)
- 16.2.10 Knoll
- 16.2.10.1. Overview
- 16.2.10.2. Products
- 16.2.10.3. SWOT Analysis
- 16.2.10.4. Recent Developments
- 16.2.10.5. Financials (Based on Availability)
- 16.2.11 Metric Office Furniture
- 16.2.11.1. Overview
- 16.2.11.2. Products
- 16.2.11.3. SWOT Analysis
- 16.2.11.4. Recent Developments
- 16.2.11.5. Financials (Based on Availability)
- 16.2.12 HumanScale
- 16.2.12.1. Overview
- 16.2.12.2. Products
- 16.2.12.3. SWOT Analysis
- 16.2.12.4. Recent Developments
- 16.2.12.5. Financials (Based on Availability)
- 16.2.13 Urban Office
- 16.2.13.1. Overview
- 16.2.13.2. Products
- 16.2.13.3. SWOT Analysis
- 16.2.13.4. Recent Developments
- 16.2.13.5. Financials (Based on Availability)
- 16.2.1 Tangent Office Furniture
List of Figures
- Figure 1: Global UK Office Furniture Industry Revenue Breakdown (Million, %) by Region 2024 & 2032
- Figure 2: Global UK Office Furniture Industry Volume Breakdown (K Unit, %) by Region 2024 & 2032
- Figure 3: United kingdom Region UK Office Furniture Industry Revenue (Million), by Country 2024 & 2032
- Figure 4: United kingdom Region UK Office Furniture Industry Volume (K Unit), by Country 2024 & 2032
- Figure 5: United kingdom Region UK Office Furniture Industry Revenue Share (%), by Country 2024 & 2032
- Figure 6: United kingdom Region UK Office Furniture Industry Volume Share (%), by Country 2024 & 2032
- Figure 7: North America UK Office Furniture Industry Revenue (Million), by Type 2024 & 2032
- Figure 8: North America UK Office Furniture Industry Volume (K Unit), by Type 2024 & 2032
- Figure 9: North America UK Office Furniture Industry Revenue Share (%), by Type 2024 & 2032
- Figure 10: North America UK Office Furniture Industry Volume Share (%), by Type 2024 & 2032
- Figure 11: North America UK Office Furniture Industry Revenue (Million), by Distribution Channel 2024 & 2032
- Figure 12: North America UK Office Furniture Industry Volume (K Unit), by Distribution Channel 2024 & 2032
- Figure 13: North America UK Office Furniture Industry Revenue Share (%), by Distribution Channel 2024 & 2032
- Figure 14: North America UK Office Furniture Industry Volume Share (%), by Distribution Channel 2024 & 2032
- Figure 15: North America UK Office Furniture Industry Revenue (Million), by Country 2024 & 2032
- Figure 16: North America UK Office Furniture Industry Volume (K Unit), by Country 2024 & 2032
- Figure 17: North America UK Office Furniture Industry Revenue Share (%), by Country 2024 & 2032
- Figure 18: North America UK Office Furniture Industry Volume Share (%), by Country 2024 & 2032
- Figure 19: South America UK Office Furniture Industry Revenue (Million), by Type 2024 & 2032
- Figure 20: South America UK Office Furniture Industry Volume (K Unit), by Type 2024 & 2032
- Figure 21: South America UK Office Furniture Industry Revenue Share (%), by Type 2024 & 2032
- Figure 22: South America UK Office Furniture Industry Volume Share (%), by Type 2024 & 2032
- Figure 23: South America UK Office Furniture Industry Revenue (Million), by Distribution Channel 2024 & 2032
- Figure 24: South America UK Office Furniture Industry Volume (K Unit), by Distribution Channel 2024 & 2032
- Figure 25: South America UK Office Furniture Industry Revenue Share (%), by Distribution Channel 2024 & 2032
- Figure 26: South America UK Office Furniture Industry Volume Share (%), by Distribution Channel 2024 & 2032
- Figure 27: South America UK Office Furniture Industry Revenue (Million), by Country 2024 & 2032
- Figure 28: South America UK Office Furniture Industry Volume (K Unit), by Country 2024 & 2032
- Figure 29: South America UK Office Furniture Industry Revenue Share (%), by Country 2024 & 2032
- Figure 30: South America UK Office Furniture Industry Volume Share (%), by Country 2024 & 2032
- Figure 31: Europe UK Office Furniture Industry Revenue (Million), by Type 2024 & 2032
- Figure 32: Europe UK Office Furniture Industry Volume (K Unit), by Type 2024 & 2032
- Figure 33: Europe UK Office Furniture Industry Revenue Share (%), by Type 2024 & 2032
- Figure 34: Europe UK Office Furniture Industry Volume Share (%), by Type 2024 & 2032
- Figure 35: Europe UK Office Furniture Industry Revenue (Million), by Distribution Channel 2024 & 2032
- Figure 36: Europe UK Office Furniture Industry Volume (K Unit), by Distribution Channel 2024 & 2032
- Figure 37: Europe UK Office Furniture Industry Revenue Share (%), by Distribution Channel 2024 & 2032
- Figure 38: Europe UK Office Furniture Industry Volume Share (%), by Distribution Channel 2024 & 2032
- Figure 39: Europe UK Office Furniture Industry Revenue (Million), by Country 2024 & 2032
- Figure 40: Europe UK Office Furniture Industry Volume (K Unit), by Country 2024 & 2032
- Figure 41: Europe UK Office Furniture Industry Revenue Share (%), by Country 2024 & 2032
- Figure 42: Europe UK Office Furniture Industry Volume Share (%), by Country 2024 & 2032
- Figure 43: Middle East & Africa UK Office Furniture Industry Revenue (Million), by Type 2024 & 2032
- Figure 44: Middle East & Africa UK Office Furniture Industry Volume (K Unit), by Type 2024 & 2032
- Figure 45: Middle East & Africa UK Office Furniture Industry Revenue Share (%), by Type 2024 & 2032
- Figure 46: Middle East & Africa UK Office Furniture Industry Volume Share (%), by Type 2024 & 2032
- Figure 47: Middle East & Africa UK Office Furniture Industry Revenue (Million), by Distribution Channel 2024 & 2032
- Figure 48: Middle East & Africa UK Office Furniture Industry Volume (K Unit), by Distribution Channel 2024 & 2032
- Figure 49: Middle East & Africa UK Office Furniture Industry Revenue Share (%), by Distribution Channel 2024 & 2032
- Figure 50: Middle East & Africa UK Office Furniture Industry Volume Share (%), by Distribution Channel 2024 & 2032
- Figure 51: Middle East & Africa UK Office Furniture Industry Revenue (Million), by Country 2024 & 2032
- Figure 52: Middle East & Africa UK Office Furniture Industry Volume (K Unit), by Country 2024 & 2032
- Figure 53: Middle East & Africa UK Office Furniture Industry Revenue Share (%), by Country 2024 & 2032
- Figure 54: Middle East & Africa UK Office Furniture Industry Volume Share (%), by Country 2024 & 2032
- Figure 55: Asia Pacific UK Office Furniture Industry Revenue (Million), by Type 2024 & 2032
- Figure 56: Asia Pacific UK Office Furniture Industry Volume (K Unit), by Type 2024 & 2032
- Figure 57: Asia Pacific UK Office Furniture Industry Revenue Share (%), by Type 2024 & 2032
- Figure 58: Asia Pacific UK Office Furniture Industry Volume Share (%), by Type 2024 & 2032
- Figure 59: Asia Pacific UK Office Furniture Industry Revenue (Million), by Distribution Channel 2024 & 2032
- Figure 60: Asia Pacific UK Office Furniture Industry Volume (K Unit), by Distribution Channel 2024 & 2032
- Figure 61: Asia Pacific UK Office Furniture Industry Revenue Share (%), by Distribution Channel 2024 & 2032
- Figure 62: Asia Pacific UK Office Furniture Industry Volume Share (%), by Distribution Channel 2024 & 2032
- Figure 63: Asia Pacific UK Office Furniture Industry Revenue (Million), by Country 2024 & 2032
- Figure 64: Asia Pacific UK Office Furniture Industry Volume (K Unit), by Country 2024 & 2032
- Figure 65: Asia Pacific UK Office Furniture Industry Revenue Share (%), by Country 2024 & 2032
- Figure 66: Asia Pacific UK Office Furniture Industry Volume Share (%), by Country 2024 & 2032
List of Tables
- Table 1: Global UK Office Furniture Industry Revenue Million Forecast, by Region 2019 & 2032
- Table 2: Global UK Office Furniture Industry Volume K Unit Forecast, by Region 2019 & 2032
- Table 3: Global UK Office Furniture Industry Revenue Million Forecast, by Type 2019 & 2032
- Table 4: Global UK Office Furniture Industry Volume K Unit Forecast, by Type 2019 & 2032
- Table 5: Global UK Office Furniture Industry Revenue Million Forecast, by Distribution Channel 2019 & 2032
- Table 6: Global UK Office Furniture Industry Volume K Unit Forecast, by Distribution Channel 2019 & 2032
- Table 7: Global UK Office Furniture Industry Revenue Million Forecast, by Region 2019 & 2032
- Table 8: Global UK Office Furniture Industry Volume K Unit Forecast, by Region 2019 & 2032
- Table 9: Global UK Office Furniture Industry Revenue Million Forecast, by Country 2019 & 2032
- Table 10: Global UK Office Furniture Industry Volume K Unit Forecast, by Country 2019 & 2032
- Table 11: England UK Office Furniture Industry Revenue (Million) Forecast, by Application 2019 & 2032
- Table 12: England UK Office Furniture Industry Volume (K Unit) Forecast, by Application 2019 & 2032
- Table 13: Wales UK Office Furniture Industry Revenue (Million) Forecast, by Application 2019 & 2032
- Table 14: Wales UK Office Furniture Industry Volume (K Unit) Forecast, by Application 2019 & 2032
- Table 15: Scotland UK Office Furniture Industry Revenue (Million) Forecast, by Application 2019 & 2032
- Table 16: Scotland UK Office Furniture Industry Volume (K Unit) Forecast, by Application 2019 & 2032
- Table 17: Northern UK Office Furniture Industry Revenue (Million) Forecast, by Application 2019 & 2032
- Table 18: Northern UK Office Furniture Industry Volume (K Unit) Forecast, by Application 2019 & 2032
- Table 19: Ireland UK Office Furniture Industry Revenue (Million) Forecast, by Application 2019 & 2032
- Table 20: Ireland UK Office Furniture Industry Volume (K Unit) Forecast, by Application 2019 & 2032
- Table 21: Global UK Office Furniture Industry Revenue Million Forecast, by Type 2019 & 2032
- Table 22: Global UK Office Furniture Industry Volume K Unit Forecast, by Type 2019 & 2032
- Table 23: Global UK Office Furniture Industry Revenue Million Forecast, by Distribution Channel 2019 & 2032
- Table 24: Global UK Office Furniture Industry Volume K Unit Forecast, by Distribution Channel 2019 & 2032
- Table 25: Global UK Office Furniture Industry Revenue Million Forecast, by Country 2019 & 2032
- Table 26: Global UK Office Furniture Industry Volume K Unit Forecast, by Country 2019 & 2032
- Table 27: United States UK Office Furniture Industry Revenue (Million) Forecast, by Application 2019 & 2032
- Table 28: United States UK Office Furniture Industry Volume (K Unit) Forecast, by Application 2019 & 2032
- Table 29: Canada UK Office Furniture Industry Revenue (Million) Forecast, by Application 2019 & 2032
- Table 30: Canada UK Office Furniture Industry Volume (K Unit) Forecast, by Application 2019 & 2032
- Table 31: Mexico UK Office Furniture Industry Revenue (Million) Forecast, by Application 2019 & 2032
- Table 32: Mexico UK Office Furniture Industry Volume (K Unit) Forecast, by Application 2019 & 2032
- Table 33: Global UK Office Furniture Industry Revenue Million Forecast, by Type 2019 & 2032
- Table 34: Global UK Office Furniture Industry Volume K Unit Forecast, by Type 2019 & 2032
- Table 35: Global UK Office Furniture Industry Revenue Million Forecast, by Distribution Channel 2019 & 2032
- Table 36: Global UK Office Furniture Industry Volume K Unit Forecast, by Distribution Channel 2019 & 2032
- Table 37: Global UK Office Furniture Industry Revenue Million Forecast, by Country 2019 & 2032
- Table 38: Global UK Office Furniture Industry Volume K Unit Forecast, by Country 2019 & 2032
- Table 39: Brazil UK Office Furniture Industry Revenue (Million) Forecast, by Application 2019 & 2032
- Table 40: Brazil UK Office Furniture Industry Volume (K Unit) Forecast, by Application 2019 & 2032
- Table 41: Argentina UK Office Furniture Industry Revenue (Million) Forecast, by Application 2019 & 2032
- Table 42: Argentina UK Office Furniture Industry Volume (K Unit) Forecast, by Application 2019 & 2032
- Table 43: Rest of South America UK Office Furniture Industry Revenue (Million) Forecast, by Application 2019 & 2032
- Table 44: Rest of South America UK Office Furniture Industry Volume (K Unit) Forecast, by Application 2019 & 2032
- Table 45: Global UK Office Furniture Industry Revenue Million Forecast, by Type 2019 & 2032
- Table 46: Global UK Office Furniture Industry Volume K Unit Forecast, by Type 2019 & 2032
- Table 47: Global UK Office Furniture Industry Revenue Million Forecast, by Distribution Channel 2019 & 2032
- Table 48: Global UK Office Furniture Industry Volume K Unit Forecast, by Distribution Channel 2019 & 2032
- Table 49: Global UK Office Furniture Industry Revenue Million Forecast, by Country 2019 & 2032
- Table 50: Global UK Office Furniture Industry Volume K Unit Forecast, by Country 2019 & 2032
- Table 51: United Kingdom UK Office Furniture Industry Revenue (Million) Forecast, by Application 2019 & 2032
- Table 52: United Kingdom UK Office Furniture Industry Volume (K Unit) Forecast, by Application 2019 & 2032
- Table 53: Germany UK Office Furniture Industry Revenue (Million) Forecast, by Application 2019 & 2032
- Table 54: Germany UK Office Furniture Industry Volume (K Unit) Forecast, by Application 2019 & 2032
- Table 55: France UK Office Furniture Industry Revenue (Million) Forecast, by Application 2019 & 2032
- Table 56: France UK Office Furniture Industry Volume (K Unit) Forecast, by Application 2019 & 2032
- Table 57: Italy UK Office Furniture Industry Revenue (Million) Forecast, by Application 2019 & 2032
- Table 58: Italy UK Office Furniture Industry Volume (K Unit) Forecast, by Application 2019 & 2032
- Table 59: Spain UK Office Furniture Industry Revenue (Million) Forecast, by Application 2019 & 2032
- Table 60: Spain UK Office Furniture Industry Volume (K Unit) Forecast, by Application 2019 & 2032
- Table 61: Russia UK Office Furniture Industry Revenue (Million) Forecast, by Application 2019 & 2032
- Table 62: Russia UK Office Furniture Industry Volume (K Unit) Forecast, by Application 2019 & 2032
- Table 63: Benelux UK Office Furniture Industry Revenue (Million) Forecast, by Application 2019 & 2032
- Table 64: Benelux UK Office Furniture Industry Volume (K Unit) Forecast, by Application 2019 & 2032
- Table 65: Nordics UK Office Furniture Industry Revenue (Million) Forecast, by Application 2019 & 2032
- Table 66: Nordics UK Office Furniture Industry Volume (K Unit) Forecast, by Application 2019 & 2032
- Table 67: Rest of Europe UK Office Furniture Industry Revenue (Million) Forecast, by Application 2019 & 2032
- Table 68: Rest of Europe UK Office Furniture Industry Volume (K Unit) Forecast, by Application 2019 & 2032
- Table 69: Global UK Office Furniture Industry Revenue Million Forecast, by Type 2019 & 2032
- Table 70: Global UK Office Furniture Industry Volume K Unit Forecast, by Type 2019 & 2032
- Table 71: Global UK Office Furniture Industry Revenue Million Forecast, by Distribution Channel 2019 & 2032
- Table 72: Global UK Office Furniture Industry Volume K Unit Forecast, by Distribution Channel 2019 & 2032
- Table 73: Global UK Office Furniture Industry Revenue Million Forecast, by Country 2019 & 2032
- Table 74: Global UK Office Furniture Industry Volume K Unit Forecast, by Country 2019 & 2032
- Table 75: Turkey UK Office Furniture Industry Revenue (Million) Forecast, by Application 2019 & 2032
- Table 76: Turkey UK Office Furniture Industry Volume (K Unit) Forecast, by Application 2019 & 2032
- Table 77: Israel UK Office Furniture Industry Revenue (Million) Forecast, by Application 2019 & 2032
- Table 78: Israel UK Office Furniture Industry Volume (K Unit) Forecast, by Application 2019 & 2032
- Table 79: GCC UK Office Furniture Industry Revenue (Million) Forecast, by Application 2019 & 2032
- Table 80: GCC UK Office Furniture Industry Volume (K Unit) Forecast, by Application 2019 & 2032
- Table 81: North Africa UK Office Furniture Industry Revenue (Million) Forecast, by Application 2019 & 2032
- Table 82: North Africa UK Office Furniture Industry Volume (K Unit) Forecast, by Application 2019 & 2032
- Table 83: South Africa UK Office Furniture Industry Revenue (Million) Forecast, by Application 2019 & 2032
- Table 84: South Africa UK Office Furniture Industry Volume (K Unit) Forecast, by Application 2019 & 2032
- Table 85: Rest of Middle East & Africa UK Office Furniture Industry Revenue (Million) Forecast, by Application 2019 & 2032
- Table 86: Rest of Middle East & Africa UK Office Furniture Industry Volume (K Unit) Forecast, by Application 2019 & 2032
- Table 87: Global UK Office Furniture Industry Revenue Million Forecast, by Type 2019 & 2032
- Table 88: Global UK Office Furniture Industry Volume K Unit Forecast, by Type 2019 & 2032
- Table 89: Global UK Office Furniture Industry Revenue Million Forecast, by Distribution Channel 2019 & 2032
- Table 90: Global UK Office Furniture Industry Volume K Unit Forecast, by Distribution Channel 2019 & 2032
- Table 91: Global UK Office Furniture Industry Revenue Million Forecast, by Country 2019 & 2032
- Table 92: Global UK Office Furniture Industry Volume K Unit Forecast, by Country 2019 & 2032
- Table 93: China UK Office Furniture Industry Revenue (Million) Forecast, by Application 2019 & 2032
- Table 94: China UK Office Furniture Industry Volume (K Unit) Forecast, by Application 2019 & 2032
- Table 95: India UK Office Furniture Industry Revenue (Million) Forecast, by Application 2019 & 2032
- Table 96: India UK Office Furniture Industry Volume (K Unit) Forecast, by Application 2019 & 2032
- Table 97: Japan UK Office Furniture Industry Revenue (Million) Forecast, by Application 2019 & 2032
- Table 98: Japan UK Office Furniture Industry Volume (K Unit) Forecast, by Application 2019 & 2032
- Table 99: South Korea UK Office Furniture Industry Revenue (Million) Forecast, by Application 2019 & 2032
- Table 100: South Korea UK Office Furniture Industry Volume (K Unit) Forecast, by Application 2019 & 2032
- Table 101: ASEAN UK Office Furniture Industry Revenue (Million) Forecast, by Application 2019 & 2032
- Table 102: ASEAN UK Office Furniture Industry Volume (K Unit) Forecast, by Application 2019 & 2032
- Table 103: Oceania UK Office Furniture Industry Revenue (Million) Forecast, by Application 2019 & 2032
- Table 104: Oceania UK Office Furniture Industry Volume (K Unit) Forecast, by Application 2019 & 2032
- Table 105: Rest of Asia Pacific UK Office Furniture Industry Revenue (Million) Forecast, by Application 2019 & 2032
- Table 106: Rest of Asia Pacific UK Office Furniture Industry Volume (K Unit) Forecast, by Application 2019 & 2032
Frequently Asked Questions
1. What is the projected Compound Annual Growth Rate (CAGR) of the UK Office Furniture Industry?
The projected CAGR is approximately 2.78%.
2. Which companies are prominent players in the UK Office Furniture Industry?
Key companies in the market include Tangent Office Furniture, SteelCase, Verve Workspace, Flexiform Office Furniture, Herman Miller, Verco Office Furniture, Lee & Plumpton, The Frem Group, Margolis Furniture, Knoll, Metric Office Furniture, HumanScale, Urban Office.
3. What are the main segments of the UK Office Furniture Industry?
The market segments include Type, Distribution Channel.
4. Can you provide details about the market size?
The market size is estimated to be USD 5.21 Million as of 2022.
5. What are some drivers contributing to market growth?
Tech-Integrated Furniture are Helping to Grow the Market.
6. What are the notable trends driving market growth?
Growing Flexible Office Spaces in the Country.
7. Are there any restraints impacting market growth?
Raw Material Cost Barrier to Growth.
8. Can you provide examples of recent developments in the market?
In 2022, Steelcase Inc. reported first-quarter revenue of USD 740.7 million, a net loss of USD 11.4 million, and an adjusted loss per share of USD 0.05. Steelcase Inc. acquired Halcon, a Minnesota-based designer and manufacturer of tailored wood furniture for the workplace, for USD 127.5 million in May 2022.
9. What pricing options are available for accessing the report?
Pricing options include single-user, multi-user, and enterprise licenses priced at USD 3800, USD 4500, and USD 5800 respectively.
10. Is the market size provided in terms of value or volume?
The market size is provided in terms of value, measured in Million and volume, measured in K Unit.
11. Are there any specific market keywords associated with the report?
Yes, the market keyword associated with the report is "UK Office Furniture Industry," which aids in identifying and referencing the specific market segment covered.
12. How do I determine which pricing option suits my needs best?
The pricing options vary based on user requirements and access needs. Individual users may opt for single-user licenses, while businesses requiring broader access may choose multi-user or enterprise licenses for cost-effective access to the report.
13. Are there any additional resources or data provided in the UK Office Furniture Industry report?
While the report offers comprehensive insights, it's advisable to review the specific contents or supplementary materials provided to ascertain if additional resources or data are available.
14. How can I stay updated on further developments or reports in the UK Office Furniture Industry?
To stay informed about further developments, trends, and reports in the UK Office Furniture Industry, consider subscribing to industry newsletters, following relevant companies and organizations, or regularly checking reputable industry news sources and publications.
Methodology
Step 1 - Identification of Relevant Samples Size from Population Database


Step 2 - Approaches for Defining Global Market Size (Value, Volume* & Price*)

Note*: In applicable scenarios
Step 3 - Data Sources
Primary Research
- Web Analytics
- Survey Reports
- Research Institute
- Latest Research Reports
- Opinion Leaders
Secondary Research
- Annual Reports
- White Paper
- Latest Press Release
- Industry Association
- Paid Database
- Investor Presentations

Step 4 - Data Triangulation
Involves using different sources of information in order to increase the validity of a study
These sources are likely to be stakeholders in a program - participants, other researchers, program staff, other community members, and so on.
Then we put all data in single framework & apply various statistical tools to find out the dynamic on the market.
During the analysis stage, feedback from the stakeholder groups would be compared to determine areas of agreement as well as areas of divergence


