

Key Insights
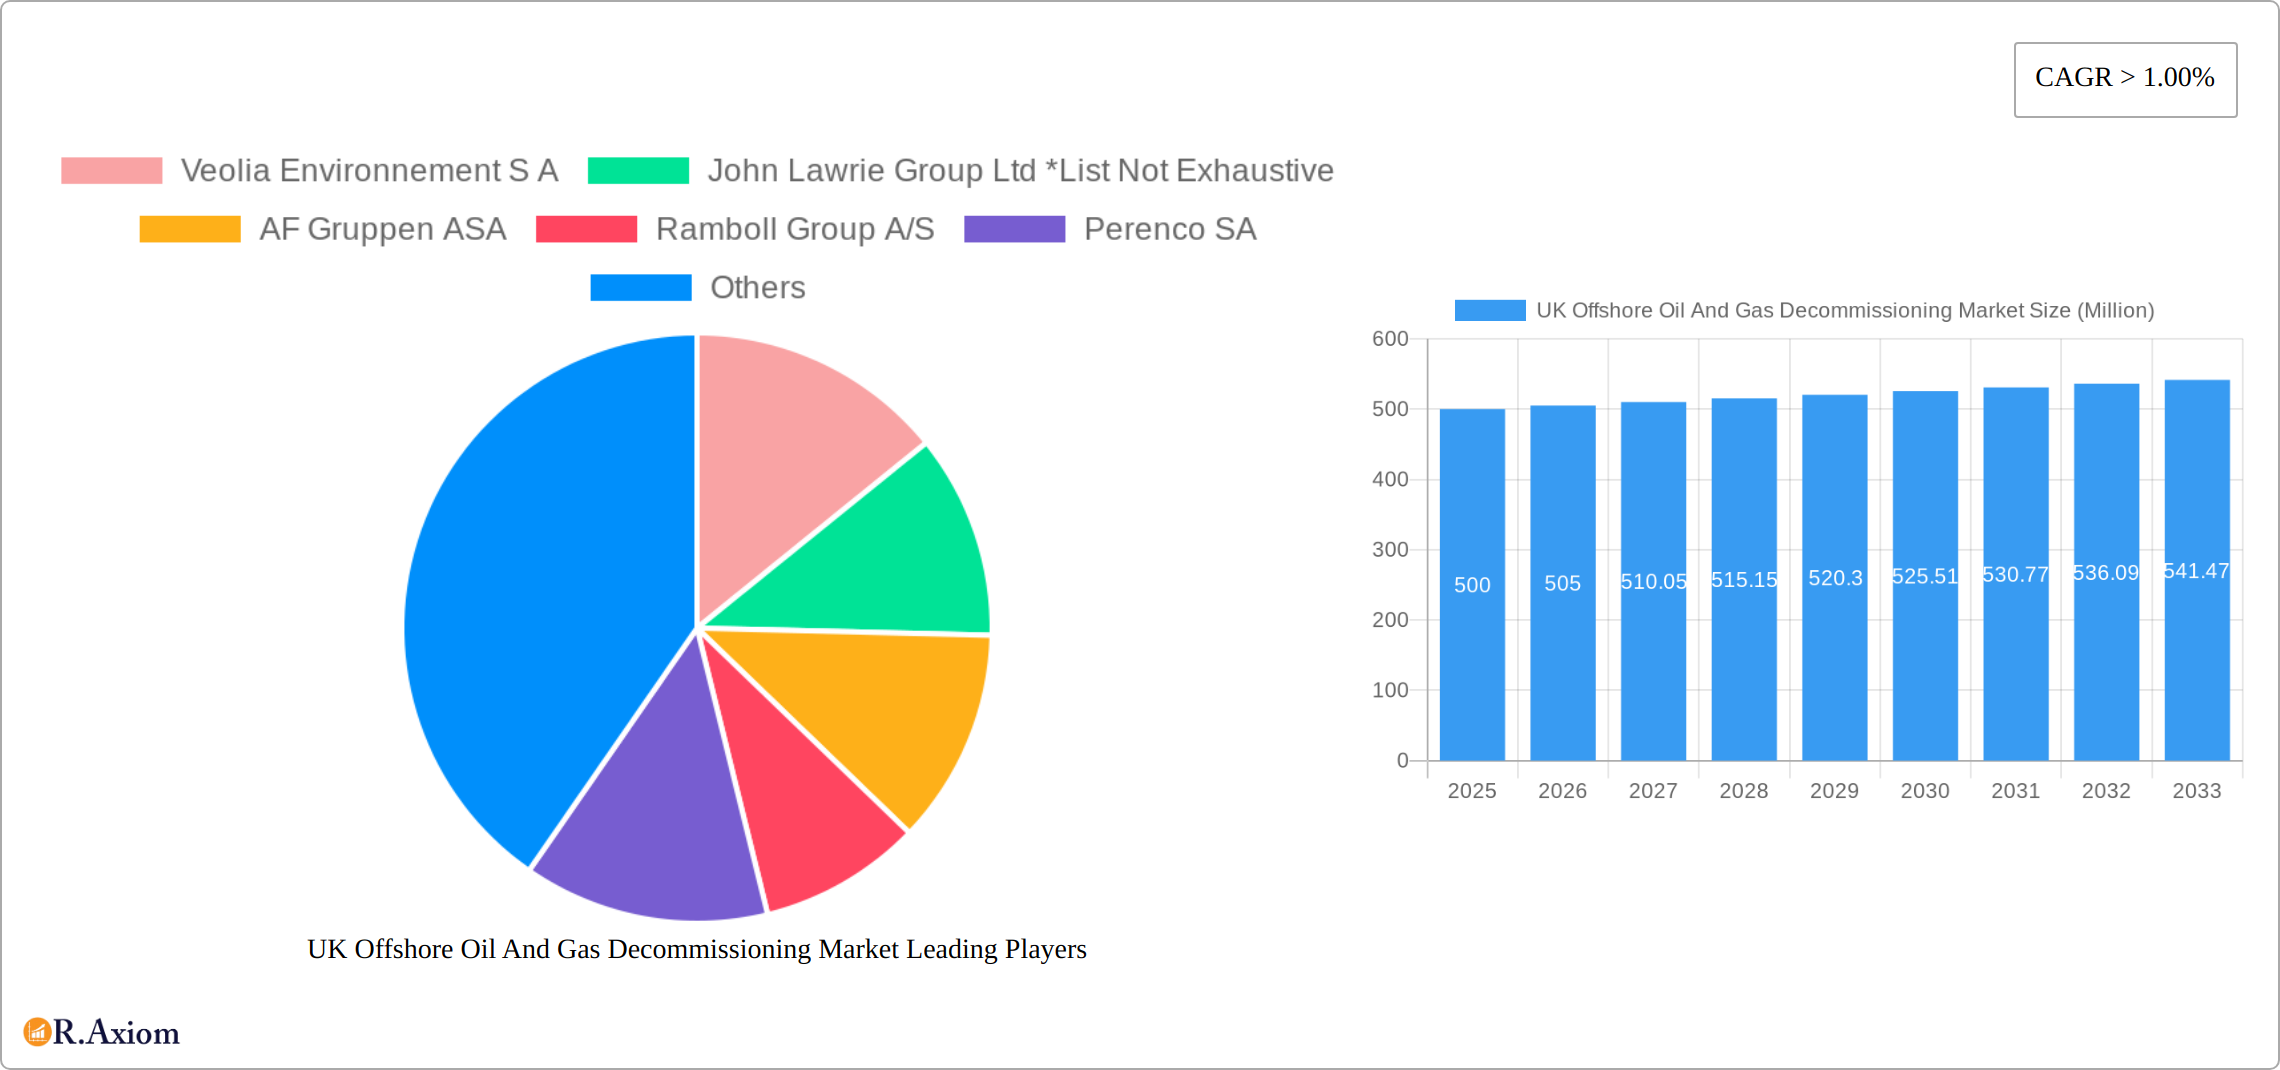
The UK offshore oil and gas decommissioning market is poised for significant expansion, driven by maturing North Sea fields and tightening environmental mandates. Projected to reach $11.1 billion by 2025, the market is forecast to grow at a Compound Annual Growth Rate (CAGR) of 6.5% between 2025 and 2033. Key growth drivers include aging infrastructure requiring substantial decommissioning, government policies promoting environmental protection, and the increasing complexity of subsea well abandonment, spurring innovation and specialized service demand. Leading industry players actively participating in this expanding market include Veolia Environnement S.A., John Lawrie Group Ltd., and AF Gruppen ASA.
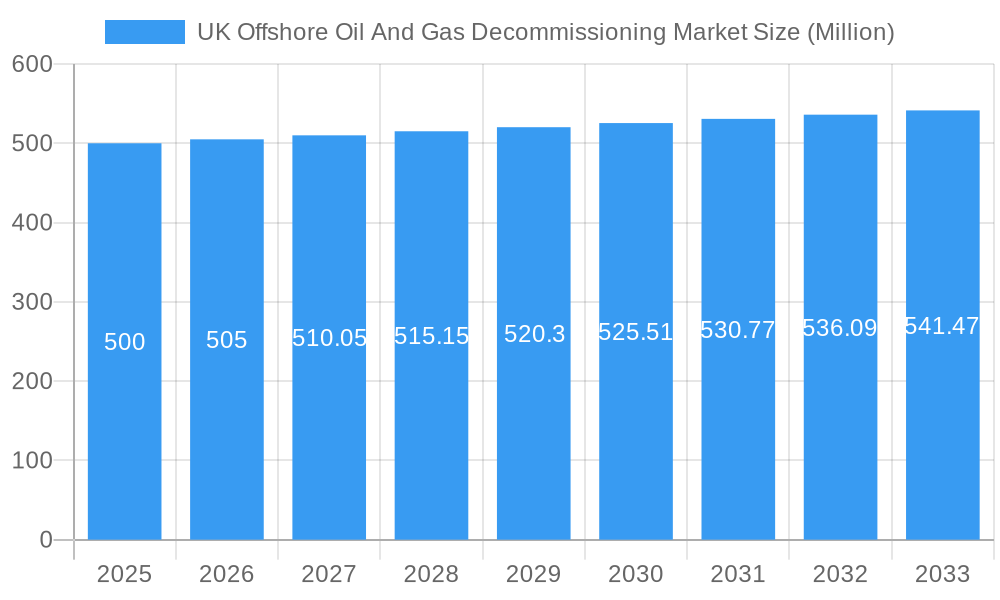
UK Offshore Oil And Gas Decommissioning Market Market Size (In Billion)
The market is segmented by service type into Plugging and Abandonment (P&A) and Pipeline Decommissioning. While P&A currently dominates, pipeline decommissioning is anticipated to experience substantial growth due to the rising number of aging pipelines necessitating removal. Geographically, the market is concentrated within the UK, encompassing England, Wales, Scotland, and Northern Ireland, aligning with the location of North Sea oil and gas assets. Evolving regulatory frameworks, including environmental legislation and carbon emission reduction targets, will shape future market dynamics. Industry participants are prioritizing sustainable and cost-effective decommissioning solutions, fostering innovation and strategic alliances. The forecast period of 2025-2033 indicates robust market growth, primarily attributed to the long-term commitment required for infrastructure removal and environmental remediation.
UK Offshore Oil And Gas Decommissioning Market Company Market Share
UK Offshore Oil & Gas Decommissioning Market: A Comprehensive Report (2019-2033)
This in-depth report provides a comprehensive analysis of the UK offshore oil and gas decommissioning market, offering valuable insights for industry stakeholders, investors, and strategic planners. The study covers the period from 2019 to 2033, with a focus on the 2025-2033 forecast period. Key market segments, including Plugging and Abandonment (P&A) and Pipeline Decommissioning, across both the Oil and Gas industries are meticulously analyzed. The report incorporates recent industry developments, highlighting key challenges and emerging opportunities. This analysis is crucial given the substantial EUR 20 billion worth of decommissioning operations projected in the North Sea alone.
UK Offshore Oil And Gas Decommissioning Market Market Concentration & Innovation
The UK offshore oil and gas decommissioning market exhibits a moderately concentrated landscape, with a few major players holding significant market share. While precise market share figures for each company remain commercially sensitive, the report provides a thorough estimation based on revenue and project wins. Innovation is driven by the need for cost-effective and environmentally sound decommissioning solutions, particularly concerning the large number of aging offshore installations. Regulatory frameworks, such as those set by the Offshore Energies UK (OEUK), play a crucial role in shaping market practices and fostering innovation. The market witnesses continuous product substitution, with newer technologies offering improved efficiency and reduced environmental impact. Significant M&A activity has consolidated the sector, with deal values reaching xx Million in recent years. End-user trends indicate a growing focus on sustainability and compliance with stringent environmental regulations.
- Key Market Players: Veolia Environnement S A, John Lawrie Group Ltd, AF Gruppen ASA, Ramboll Group A/S, Perenco SA, Derrick Services (UK) Ltd (List Not Exhaustive).
- Innovation Drivers: Technological advancements, stringent environmental regulations, cost optimization pressures.
- M&A Activity: Consolidation through acquisitions and mergers, driving market concentration. Deal values estimated at xx Million annually.
- Regulatory Framework: OEUK guidelines and other regulatory bodies significantly impact market operations and innovation.
UK Offshore Oil And Gas Decommissioning Market Industry Trends & Insights
The UK offshore oil and gas decommissioning market is experiencing robust growth, driven by the aging infrastructure and the increasing number of aging oil and gas fields reaching the end of their operational lives. This presents a significant market opportunity projected to witness substantial growth over the forecast period (2025-2033). This expansion is fueled by several key factors: technological advancements in decommissioning techniques leading to increased efficiency and cost reductions; stricter environmental regulations promoting sustainable practices; and a heightened awareness of environmental responsibility among stakeholders. The market is witnessing increased penetration of innovative technologies such as remotely operated vehicles (ROVs), advanced robotics, and AI-powered solutions, further optimizing processes and minimizing environmental impact. Competitive dynamics are complex, characterized by both strategic alliances and intense competition for lucrative decommissioning projects. A strong consumer preference for sustainable and environmentally conscious solutions creates a favorable environment for companies offering eco-friendly and cost-effective decommissioning methods. This focus on sustainability is further driving innovation within the sector.
Dominant Markets & Segments in UK Offshore Oil And Gas Decommissioning Market
The North Sea region remains the dominant force in the UK offshore oil and gas decommissioning market, characterized by a high concentration of aging oil and gas installations requiring decommissioning. Plugging and Abandonment (P&A) activities constitute the largest segment, accounting for a significant portion of the market, due to the substantial number of wells needing decommissioning. The Oil Industry segment represents the largest end-user, reflecting its larger share of the overall offshore infrastructure. However, the Gas Industry segment also presents a significant, and growing, market opportunity.
Key Drivers for North Sea Dominance: High concentration of aging oil and gas assets, established infrastructure, and proximity to key service providers.
Plugging and Abandonment (P&A) Segment Dominance: Large number of aging wells requiring decommissioning, complex technical challenges, and high cost per project, driving innovation and investment in specialized technologies.
Oil Industry End-User Dominance: Larger share of aging offshore installations and a well-established history of operations in the North Sea.
Pipeline Decommissioning Segment: This segment is experiencing strong growth driven by the extensive pipeline networks in the North Sea and the increasing focus on safe and efficient removal.
Gas Industry End-User Segment: While smaller than the Oil Industry segment, the Gas Industry represents a significant market opportunity, with a growing number of gas fields reaching the end of their operational life.
UK Offshore Oil And Gas Decommissioning Market Product Developments
Recent product innovations focus on enhancing efficiency, reducing environmental impact, and improving safety. Advanced robotic systems, remotely operated vehicles (ROVs), and improved subsea technologies are increasingly being deployed to perform complex decommissioning tasks with greater precision and lower risk. These innovations offer significant competitive advantages, allowing companies to bid more effectively and deliver projects more efficiently.
Report Scope & Segmentation Analysis
This report provides a comprehensive analysis of the UK offshore oil and gas decommissioning market, segmented by Type (Plugging and Abandonment (P&A), Pipeline Decommissioning, Platform Decommissioning, Subsea Decommissioning) and End-user (Oil Industry, Gas Industry). Each segment is analyzed based on market size, growth projections, key players, and competitive dynamics. The Plugging and Abandonment (P&A) segment is projected to experience significant growth, driven by the sheer volume of wells requiring decommissioning. Similarly, the Pipeline Decommissioning segment is expected to see considerable growth due to the extensive existing pipeline infrastructure. The Oil Industry and Gas Industry segments are analyzed to identify their specific needs and preferences in decommissioning services, highlighting the unique challenges and opportunities within each sector. The report also considers the evolving regulatory landscape and its impact on market dynamics.
Key Drivers of UK Offshore Oil And Gas Decommissioning Market Growth
The market's growth is propelled by several factors. The substantial number of aging offshore oil and gas installations approaching the end of their operational life represents a massive opportunity. Stringent environmental regulations are driving demand for environmentally sound decommissioning solutions. Technological advancements, such as improved robotics and subsea technologies, increase efficiency and reduce costs. Lastly, government policies supporting decommissioning activities incentivize market growth.
Challenges in the UK Offshore Oil And Gas Decommissioning Market Sector
The UK offshore oil and gas decommissioning market faces several significant challenges. High decommissioning costs remain a major financial burden for operators. Supply chain complexities, potential labor shortages, and the need for specialized skills can hinder project execution and timelines. Securing necessary regulatory approvals and permits can introduce significant delays, increasing project costs. Environmental concerns, public perception, and the need to minimize environmental impact are crucial considerations throughout the decommissioning process. These interconnected challenges impact overall efficiency and add complexities to decommissioning projects, demanding innovative solutions and strategic planning.
Emerging Opportunities in UK Offshore Oil And Gas Decommissioning Market
Emerging opportunities include the development and adoption of innovative technologies, such as AI-powered decommissioning solutions and sustainable recycling strategies. Growing awareness of environmental sustainability offers opportunities for companies offering eco-friendly decommissioning services. Expanding into new markets, such as decommissioning of wind farm infrastructure, creates additional growth potential.
Leading Players in the UK Offshore Oil And Gas Decommissioning Market Market
- Veolia Environnement S A
- John Lawrie Group Ltd
- AF Gruppen ASA
- Ramboll Group A/S
- Perenco SA
- Derrick Services (UK) Ltd
Key Developments in UK Offshore Oil And Gas Decommissioning Market Industry
- November 2022: OEUK reported over 2,000 abandoned oil and gas wells in the North Sea, signaling a significant increase in upcoming decommissioning activity valued at EUR 20 billion, underscoring the massive scale of the market opportunity.
- September 2022: The Nuclear Decommissioning Authority (NDA) and the National Decommissioning Centre (NDC) of the UK signed a collaborative research agreement, fostering knowledge sharing and technological advancements between the nuclear and oil and gas decommissioning sectors, leading to potential synergies and efficiency gains.
- [Add another recent key development here with date and brief description]
Strategic Outlook for UK Offshore Oil And Gas Decommissioning Market Market
The UK offshore oil and gas decommissioning market presents significant long-term growth potential. Continued technological advancements, coupled with supportive government policies and environmental regulations, will drive market expansion. Companies focusing on innovation, sustainability, and efficient project execution are best positioned to capitalize on the opportunities within this rapidly evolving sector. The market is predicted to be worth xx Million by 2033.
UK Offshore Oil And Gas Decommissioning Market Segmentation
- 1. Shallow Water
- 2. Deepwater and Ultra-Deep Water
UK Offshore Oil And Gas Decommissioning Market Segmentation By Geography
-
1. North America
- 1.1. United States
- 1.2. Canada
- 1.3. Mexico
-
2. South America
- 2.1. Brazil
- 2.2. Argentina
- 2.3. Rest of South America
-
3. Europe
- 3.1. United Kingdom
- 3.2. Germany
- 3.3. France
- 3.4. Italy
- 3.5. Spain
- 3.6. Russia
- 3.7. Benelux
- 3.8. Nordics
- 3.9. Rest of Europe
-
4. Middle East & Africa
- 4.1. Turkey
- 4.2. Israel
- 4.3. GCC
- 4.4. North Africa
- 4.5. South Africa
- 4.6. Rest of Middle East & Africa
-
5. Asia Pacific
- 5.1. China
- 5.2. India
- 5.3. Japan
- 5.4. South Korea
- 5.5. ASEAN
- 5.6. Oceania
- 5.7. Rest of Asia Pacific
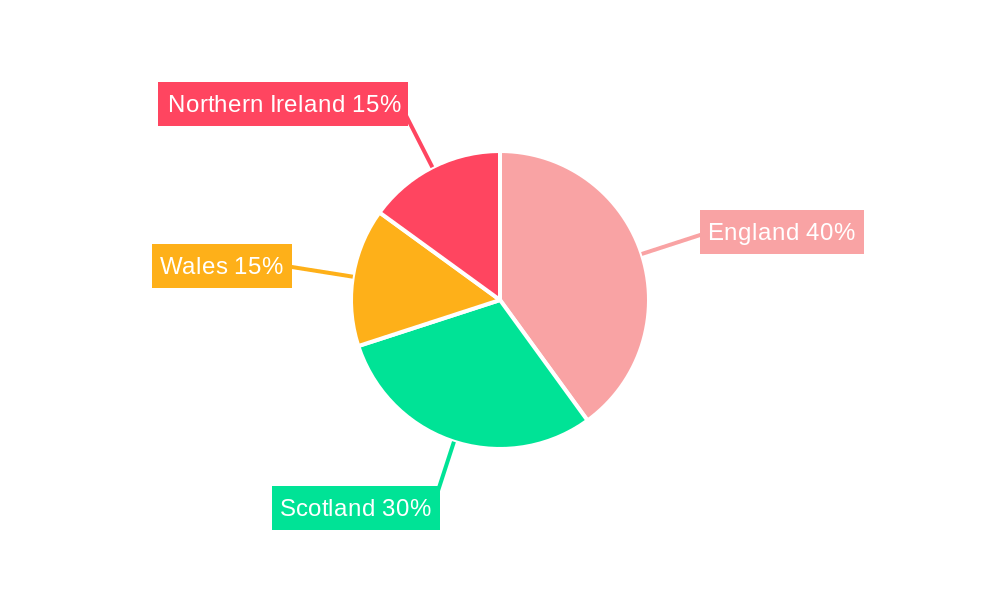
UK Offshore Oil And Gas Decommissioning Market Regional Market Share
Geographic Coverage of UK Offshore Oil And Gas Decommissioning Market
UK Offshore Oil And Gas Decommissioning Market REPORT HIGHLIGHTS
| Aspects | Details |
|---|---|
| Study Period | 2020-2034 |
| Base Year | 2025 |
| Estimated Year | 2026 |
| Forecast Period | 2026-2034 |
| Historical Period | 2020-2025 |
| Growth Rate | CAGR of 6.5% from 2020-2034 |
| Segmentation |
|
Table of Contents
- 1. Introduction
- 1.1. Research Scope
- 1.2. Market Segmentation
- 1.3. Research Objective
- 1.4. Definitions and Assumptions
- 2. Executive Summary
- 2.1. Market Snapshot
- 3. Market Dynamics
- 3.1. Market Drivers
- 3.2. Market Restrains
- 3.3. Market Trends
- 3.4. Market Opportunities
- 4. Market Factor Analysis
- 4.1. Porters Five Forces
- 4.1.1. Bargaining Power of Suppliers
- 4.1.2. Bargaining Power of Buyers
- 4.1.3. Threat of New Entrants
- 4.1.4. Threat of Substitutes
- 4.1.5. Competitive Rivalry
- 4.2. PESTEL analysis
- 4.3. BCG Analysis
- 4.3.1. Stars (High Growth, High Market Share)
- 4.3.2. Cash Cows (Low Growth, High Market Share)
- 4.3.3. Question Mark (High Growth, Low Market Share)
- 4.3.4. Dogs (Low Growth, Low Market Share)
- 4.4. Ansoff Matrix Analysis
- 4.5. Supply Chain Analysis
- 4.6. Regulatory Landscape
- 4.7. Current Market Potential and Opportunity Assessment (TAM–SAM–SOM Framework)
- 4.8. RAX Analyst Note
- 4.1. Porters Five Forces
- 5. Market Analysis, Insights and Forecast 2021-2033
- 5.1. Market Analysis, Insights and Forecast - by Shallow Water
- 5.2. Market Analysis, Insights and Forecast - by Deepwater and Ultra-Deep Water
- 5.3. Market Analysis, Insights and Forecast - by Region
- 5.3.1. North America
- 5.3.2. South America
- 5.3.3. Europe
- 5.3.4. Middle East & Africa
- 5.3.5. Asia Pacific
- 6. Global UK Offshore Oil And Gas Decommissioning Market Analysis, Insights and Forecast, 2021-2033
- 6.1. Market Analysis, Insights and Forecast - by Shallow Water
- 6.2. Market Analysis, Insights and Forecast - by Deepwater and Ultra-Deep Water
- 7. North America UK Offshore Oil And Gas Decommissioning Market Analysis, Insights and Forecast, 2020-2032
- 7.1. Market Analysis, Insights and Forecast - by Shallow Water
- 7.2. Market Analysis, Insights and Forecast - by Deepwater and Ultra-Deep Water
- 8. South America UK Offshore Oil And Gas Decommissioning Market Analysis, Insights and Forecast, 2020-2032
- 8.1. Market Analysis, Insights and Forecast - by Shallow Water
- 8.2. Market Analysis, Insights and Forecast - by Deepwater and Ultra-Deep Water
- 9. Europe UK Offshore Oil And Gas Decommissioning Market Analysis, Insights and Forecast, 2020-2032
- 9.1. Market Analysis, Insights and Forecast - by Shallow Water
- 9.2. Market Analysis, Insights and Forecast - by Deepwater and Ultra-Deep Water
- 10. Middle East & Africa UK Offshore Oil And Gas Decommissioning Market Analysis, Insights and Forecast, 2020-2032
- 10.1. Market Analysis, Insights and Forecast - by Shallow Water
- 10.2. Market Analysis, Insights and Forecast - by Deepwater and Ultra-Deep Water
- 11. Asia Pacific UK Offshore Oil And Gas Decommissioning Market Analysis, Insights and Forecast, 2020-2032
- 11.1. Market Analysis, Insights and Forecast - by Shallow Water
- 11.2. Market Analysis, Insights and Forecast - by Deepwater and Ultra-Deep Water
- 12. Competitive Analysis
- 12.1. Company Profiles
- 12.1.1 Veolia Environnement S A
- 12.1.1.1. Company Overview
- 12.1.1.2. Products
- 12.1.1.3. Company Financials
- 12.1.1.4. SWOT Analysis
- 12.1.2 John Lawrie Group Ltd *List Not Exhaustive
- 12.1.2.1. Company Overview
- 12.1.2.2. Products
- 12.1.2.3. Company Financials
- 12.1.2.4. SWOT Analysis
- 12.1.3 AF Gruppen ASA
- 12.1.3.1. Company Overview
- 12.1.3.2. Products
- 12.1.3.3. Company Financials
- 12.1.3.4. SWOT Analysis
- 12.1.4 Ramboll Group A/S
- 12.1.4.1. Company Overview
- 12.1.4.2. Products
- 12.1.4.3. Company Financials
- 12.1.4.4. SWOT Analysis
- 12.1.5 Perenco SA
- 12.1.5.1. Company Overview
- 12.1.5.2. Products
- 12.1.5.3. Company Financials
- 12.1.5.4. SWOT Analysis
- 12.1.6 Derrick Services (UK) Ltd
- 12.1.6.1. Company Overview
- 12.1.6.2. Products
- 12.1.6.3. Company Financials
- 12.1.6.4. SWOT Analysis
- 12.1.1 Veolia Environnement S A
- 12.2. Market Entropy
- 12.2.1 Company's Key Areas Served
- 12.2.2 Recent Developments
- 12.3. Company Market Share Analysis 2025
- 12.3.1 Top 5 Companies Market Share Analysis
- 12.3.2 Top 3 Companies Market Share Analysis
- 12.4. List of Potential Customers
- 13. Research Methodology
List of Figures
- Figure 1: Global UK Offshore Oil And Gas Decommissioning Market Revenue Breakdown (billion, %) by Region 2025 & 2033
- Figure 2: Global UK Offshore Oil And Gas Decommissioning Market Volume Breakdown (K Units, %) by Region 2025 & 2033
- Figure 3: North America UK Offshore Oil And Gas Decommissioning Market Revenue (billion), by Shallow Water 2025 & 2033
- Figure 4: North America UK Offshore Oil And Gas Decommissioning Market Volume (K Units), by Shallow Water 2025 & 2033
- Figure 5: North America UK Offshore Oil And Gas Decommissioning Market Revenue Share (%), by Shallow Water 2025 & 2033
- Figure 6: North America UK Offshore Oil And Gas Decommissioning Market Volume Share (%), by Shallow Water 2025 & 2033
- Figure 7: North America UK Offshore Oil And Gas Decommissioning Market Revenue (billion), by Deepwater and Ultra-Deep Water 2025 & 2033
- Figure 8: North America UK Offshore Oil And Gas Decommissioning Market Volume (K Units), by Deepwater and Ultra-Deep Water 2025 & 2033
- Figure 9: North America UK Offshore Oil And Gas Decommissioning Market Revenue Share (%), by Deepwater and Ultra-Deep Water 2025 & 2033
- Figure 10: North America UK Offshore Oil And Gas Decommissioning Market Volume Share (%), by Deepwater and Ultra-Deep Water 2025 & 2033
- Figure 11: North America UK Offshore Oil And Gas Decommissioning Market Revenue (billion), by Country 2025 & 2033
- Figure 12: North America UK Offshore Oil And Gas Decommissioning Market Volume (K Units), by Country 2025 & 2033
- Figure 13: North America UK Offshore Oil And Gas Decommissioning Market Revenue Share (%), by Country 2025 & 2033
- Figure 14: North America UK Offshore Oil And Gas Decommissioning Market Volume Share (%), by Country 2025 & 2033
- Figure 15: South America UK Offshore Oil And Gas Decommissioning Market Revenue (billion), by Shallow Water 2025 & 2033
- Figure 16: South America UK Offshore Oil And Gas Decommissioning Market Volume (K Units), by Shallow Water 2025 & 2033
- Figure 17: South America UK Offshore Oil And Gas Decommissioning Market Revenue Share (%), by Shallow Water 2025 & 2033
- Figure 18: South America UK Offshore Oil And Gas Decommissioning Market Volume Share (%), by Shallow Water 2025 & 2033
- Figure 19: South America UK Offshore Oil And Gas Decommissioning Market Revenue (billion), by Deepwater and Ultra-Deep Water 2025 & 2033
- Figure 20: South America UK Offshore Oil And Gas Decommissioning Market Volume (K Units), by Deepwater and Ultra-Deep Water 2025 & 2033
- Figure 21: South America UK Offshore Oil And Gas Decommissioning Market Revenue Share (%), by Deepwater and Ultra-Deep Water 2025 & 2033
- Figure 22: South America UK Offshore Oil And Gas Decommissioning Market Volume Share (%), by Deepwater and Ultra-Deep Water 2025 & 2033
- Figure 23: South America UK Offshore Oil And Gas Decommissioning Market Revenue (billion), by Country 2025 & 2033
- Figure 24: South America UK Offshore Oil And Gas Decommissioning Market Volume (K Units), by Country 2025 & 2033
- Figure 25: South America UK Offshore Oil And Gas Decommissioning Market Revenue Share (%), by Country 2025 & 2033
- Figure 26: South America UK Offshore Oil And Gas Decommissioning Market Volume Share (%), by Country 2025 & 2033
- Figure 27: Europe UK Offshore Oil And Gas Decommissioning Market Revenue (billion), by Shallow Water 2025 & 2033
- Figure 28: Europe UK Offshore Oil And Gas Decommissioning Market Volume (K Units), by Shallow Water 2025 & 2033
- Figure 29: Europe UK Offshore Oil And Gas Decommissioning Market Revenue Share (%), by Shallow Water 2025 & 2033
- Figure 30: Europe UK Offshore Oil And Gas Decommissioning Market Volume Share (%), by Shallow Water 2025 & 2033
- Figure 31: Europe UK Offshore Oil And Gas Decommissioning Market Revenue (billion), by Deepwater and Ultra-Deep Water 2025 & 2033
- Figure 32: Europe UK Offshore Oil And Gas Decommissioning Market Volume (K Units), by Deepwater and Ultra-Deep Water 2025 & 2033
- Figure 33: Europe UK Offshore Oil And Gas Decommissioning Market Revenue Share (%), by Deepwater and Ultra-Deep Water 2025 & 2033
- Figure 34: Europe UK Offshore Oil And Gas Decommissioning Market Volume Share (%), by Deepwater and Ultra-Deep Water 2025 & 2033
- Figure 35: Europe UK Offshore Oil And Gas Decommissioning Market Revenue (billion), by Country 2025 & 2033
- Figure 36: Europe UK Offshore Oil And Gas Decommissioning Market Volume (K Units), by Country 2025 & 2033
- Figure 37: Europe UK Offshore Oil And Gas Decommissioning Market Revenue Share (%), by Country 2025 & 2033
- Figure 38: Europe UK Offshore Oil And Gas Decommissioning Market Volume Share (%), by Country 2025 & 2033
- Figure 39: Middle East & Africa UK Offshore Oil And Gas Decommissioning Market Revenue (billion), by Shallow Water 2025 & 2033
- Figure 40: Middle East & Africa UK Offshore Oil And Gas Decommissioning Market Volume (K Units), by Shallow Water 2025 & 2033
- Figure 41: Middle East & Africa UK Offshore Oil And Gas Decommissioning Market Revenue Share (%), by Shallow Water 2025 & 2033
- Figure 42: Middle East & Africa UK Offshore Oil And Gas Decommissioning Market Volume Share (%), by Shallow Water 2025 & 2033
- Figure 43: Middle East & Africa UK Offshore Oil And Gas Decommissioning Market Revenue (billion), by Deepwater and Ultra-Deep Water 2025 & 2033
- Figure 44: Middle East & Africa UK Offshore Oil And Gas Decommissioning Market Volume (K Units), by Deepwater and Ultra-Deep Water 2025 & 2033
- Figure 45: Middle East & Africa UK Offshore Oil And Gas Decommissioning Market Revenue Share (%), by Deepwater and Ultra-Deep Water 2025 & 2033
- Figure 46: Middle East & Africa UK Offshore Oil And Gas Decommissioning Market Volume Share (%), by Deepwater and Ultra-Deep Water 2025 & 2033
- Figure 47: Middle East & Africa UK Offshore Oil And Gas Decommissioning Market Revenue (billion), by Country 2025 & 2033
- Figure 48: Middle East & Africa UK Offshore Oil And Gas Decommissioning Market Volume (K Units), by Country 2025 & 2033
- Figure 49: Middle East & Africa UK Offshore Oil And Gas Decommissioning Market Revenue Share (%), by Country 2025 & 2033
- Figure 50: Middle East & Africa UK Offshore Oil And Gas Decommissioning Market Volume Share (%), by Country 2025 & 2033
- Figure 51: Asia Pacific UK Offshore Oil And Gas Decommissioning Market Revenue (billion), by Shallow Water 2025 & 2033
- Figure 52: Asia Pacific UK Offshore Oil And Gas Decommissioning Market Volume (K Units), by Shallow Water 2025 & 2033
- Figure 53: Asia Pacific UK Offshore Oil And Gas Decommissioning Market Revenue Share (%), by Shallow Water 2025 & 2033
- Figure 54: Asia Pacific UK Offshore Oil And Gas Decommissioning Market Volume Share (%), by Shallow Water 2025 & 2033
- Figure 55: Asia Pacific UK Offshore Oil And Gas Decommissioning Market Revenue (billion), by Deepwater and Ultra-Deep Water 2025 & 2033
- Figure 56: Asia Pacific UK Offshore Oil And Gas Decommissioning Market Volume (K Units), by Deepwater and Ultra-Deep Water 2025 & 2033
- Figure 57: Asia Pacific UK Offshore Oil And Gas Decommissioning Market Revenue Share (%), by Deepwater and Ultra-Deep Water 2025 & 2033
- Figure 58: Asia Pacific UK Offshore Oil And Gas Decommissioning Market Volume Share (%), by Deepwater and Ultra-Deep Water 2025 & 2033
- Figure 59: Asia Pacific UK Offshore Oil And Gas Decommissioning Market Revenue (billion), by Country 2025 & 2033
- Figure 60: Asia Pacific UK Offshore Oil And Gas Decommissioning Market Volume (K Units), by Country 2025 & 2033
- Figure 61: Asia Pacific UK Offshore Oil And Gas Decommissioning Market Revenue Share (%), by Country 2025 & 2033
- Figure 62: Asia Pacific UK Offshore Oil And Gas Decommissioning Market Volume Share (%), by Country 2025 & 2033
List of Tables
- Table 1: Global UK Offshore Oil And Gas Decommissioning Market Revenue billion Forecast, by Shallow Water 2020 & 2033
- Table 2: Global UK Offshore Oil And Gas Decommissioning Market Volume K Units Forecast, by Shallow Water 2020 & 2033
- Table 3: Global UK Offshore Oil And Gas Decommissioning Market Revenue billion Forecast, by Deepwater and Ultra-Deep Water 2020 & 2033
- Table 4: Global UK Offshore Oil And Gas Decommissioning Market Volume K Units Forecast, by Deepwater and Ultra-Deep Water 2020 & 2033
- Table 5: Global UK Offshore Oil And Gas Decommissioning Market Revenue billion Forecast, by Region 2020 & 2033
- Table 6: Global UK Offshore Oil And Gas Decommissioning Market Volume K Units Forecast, by Region 2020 & 2033
- Table 7: Global UK Offshore Oil And Gas Decommissioning Market Revenue billion Forecast, by Shallow Water 2020 & 2033
- Table 8: Global UK Offshore Oil And Gas Decommissioning Market Volume K Units Forecast, by Shallow Water 2020 & 2033
- Table 9: Global UK Offshore Oil And Gas Decommissioning Market Revenue billion Forecast, by Deepwater and Ultra-Deep Water 2020 & 2033
- Table 10: Global UK Offshore Oil And Gas Decommissioning Market Volume K Units Forecast, by Deepwater and Ultra-Deep Water 2020 & 2033
- Table 11: Global UK Offshore Oil And Gas Decommissioning Market Revenue billion Forecast, by Country 2020 & 2033
- Table 12: Global UK Offshore Oil And Gas Decommissioning Market Volume K Units Forecast, by Country 2020 & 2033
- Table 13: United States UK Offshore Oil And Gas Decommissioning Market Revenue (billion) Forecast, by Application 2020 & 2033
- Table 14: United States UK Offshore Oil And Gas Decommissioning Market Volume (K Units) Forecast, by Application 2020 & 2033
- Table 15: Canada UK Offshore Oil And Gas Decommissioning Market Revenue (billion) Forecast, by Application 2020 & 2033
- Table 16: Canada UK Offshore Oil And Gas Decommissioning Market Volume (K Units) Forecast, by Application 2020 & 2033
- Table 17: Mexico UK Offshore Oil And Gas Decommissioning Market Revenue (billion) Forecast, by Application 2020 & 2033
- Table 18: Mexico UK Offshore Oil And Gas Decommissioning Market Volume (K Units) Forecast, by Application 2020 & 2033
- Table 19: Global UK Offshore Oil And Gas Decommissioning Market Revenue billion Forecast, by Shallow Water 2020 & 2033
- Table 20: Global UK Offshore Oil And Gas Decommissioning Market Volume K Units Forecast, by Shallow Water 2020 & 2033
- Table 21: Global UK Offshore Oil And Gas Decommissioning Market Revenue billion Forecast, by Deepwater and Ultra-Deep Water 2020 & 2033
- Table 22: Global UK Offshore Oil And Gas Decommissioning Market Volume K Units Forecast, by Deepwater and Ultra-Deep Water 2020 & 2033
- Table 23: Global UK Offshore Oil And Gas Decommissioning Market Revenue billion Forecast, by Country 2020 & 2033
- Table 24: Global UK Offshore Oil And Gas Decommissioning Market Volume K Units Forecast, by Country 2020 & 2033
- Table 25: Brazil UK Offshore Oil And Gas Decommissioning Market Revenue (billion) Forecast, by Application 2020 & 2033
- Table 26: Brazil UK Offshore Oil And Gas Decommissioning Market Volume (K Units) Forecast, by Application 2020 & 2033
- Table 27: Argentina UK Offshore Oil And Gas Decommissioning Market Revenue (billion) Forecast, by Application 2020 & 2033
- Table 28: Argentina UK Offshore Oil And Gas Decommissioning Market Volume (K Units) Forecast, by Application 2020 & 2033
- Table 29: Rest of South America UK Offshore Oil And Gas Decommissioning Market Revenue (billion) Forecast, by Application 2020 & 2033
- Table 30: Rest of South America UK Offshore Oil And Gas Decommissioning Market Volume (K Units) Forecast, by Application 2020 & 2033
- Table 31: Global UK Offshore Oil And Gas Decommissioning Market Revenue billion Forecast, by Shallow Water 2020 & 2033
- Table 32: Global UK Offshore Oil And Gas Decommissioning Market Volume K Units Forecast, by Shallow Water 2020 & 2033
- Table 33: Global UK Offshore Oil And Gas Decommissioning Market Revenue billion Forecast, by Deepwater and Ultra-Deep Water 2020 & 2033
- Table 34: Global UK Offshore Oil And Gas Decommissioning Market Volume K Units Forecast, by Deepwater and Ultra-Deep Water 2020 & 2033
- Table 35: Global UK Offshore Oil And Gas Decommissioning Market Revenue billion Forecast, by Country 2020 & 2033
- Table 36: Global UK Offshore Oil And Gas Decommissioning Market Volume K Units Forecast, by Country 2020 & 2033
- Table 37: United Kingdom UK Offshore Oil And Gas Decommissioning Market Revenue (billion) Forecast, by Application 2020 & 2033
- Table 38: United Kingdom UK Offshore Oil And Gas Decommissioning Market Volume (K Units) Forecast, by Application 2020 & 2033
- Table 39: Germany UK Offshore Oil And Gas Decommissioning Market Revenue (billion) Forecast, by Application 2020 & 2033
- Table 40: Germany UK Offshore Oil And Gas Decommissioning Market Volume (K Units) Forecast, by Application 2020 & 2033
- Table 41: France UK Offshore Oil And Gas Decommissioning Market Revenue (billion) Forecast, by Application 2020 & 2033
- Table 42: France UK Offshore Oil And Gas Decommissioning Market Volume (K Units) Forecast, by Application 2020 & 2033
- Table 43: Italy UK Offshore Oil And Gas Decommissioning Market Revenue (billion) Forecast, by Application 2020 & 2033
- Table 44: Italy UK Offshore Oil And Gas Decommissioning Market Volume (K Units) Forecast, by Application 2020 & 2033
- Table 45: Spain UK Offshore Oil And Gas Decommissioning Market Revenue (billion) Forecast, by Application 2020 & 2033
- Table 46: Spain UK Offshore Oil And Gas Decommissioning Market Volume (K Units) Forecast, by Application 2020 & 2033
- Table 47: Russia UK Offshore Oil And Gas Decommissioning Market Revenue (billion) Forecast, by Application 2020 & 2033
- Table 48: Russia UK Offshore Oil And Gas Decommissioning Market Volume (K Units) Forecast, by Application 2020 & 2033
- Table 49: Benelux UK Offshore Oil And Gas Decommissioning Market Revenue (billion) Forecast, by Application 2020 & 2033
- Table 50: Benelux UK Offshore Oil And Gas Decommissioning Market Volume (K Units) Forecast, by Application 2020 & 2033
- Table 51: Nordics UK Offshore Oil And Gas Decommissioning Market Revenue (billion) Forecast, by Application 2020 & 2033
- Table 52: Nordics UK Offshore Oil And Gas Decommissioning Market Volume (K Units) Forecast, by Application 2020 & 2033
- Table 53: Rest of Europe UK Offshore Oil And Gas Decommissioning Market Revenue (billion) Forecast, by Application 2020 & 2033
- Table 54: Rest of Europe UK Offshore Oil And Gas Decommissioning Market Volume (K Units) Forecast, by Application 2020 & 2033
- Table 55: Global UK Offshore Oil And Gas Decommissioning Market Revenue billion Forecast, by Shallow Water 2020 & 2033
- Table 56: Global UK Offshore Oil And Gas Decommissioning Market Volume K Units Forecast, by Shallow Water 2020 & 2033
- Table 57: Global UK Offshore Oil And Gas Decommissioning Market Revenue billion Forecast, by Deepwater and Ultra-Deep Water 2020 & 2033
- Table 58: Global UK Offshore Oil And Gas Decommissioning Market Volume K Units Forecast, by Deepwater and Ultra-Deep Water 2020 & 2033
- Table 59: Global UK Offshore Oil And Gas Decommissioning Market Revenue billion Forecast, by Country 2020 & 2033
- Table 60: Global UK Offshore Oil And Gas Decommissioning Market Volume K Units Forecast, by Country 2020 & 2033
- Table 61: Turkey UK Offshore Oil And Gas Decommissioning Market Revenue (billion) Forecast, by Application 2020 & 2033
- Table 62: Turkey UK Offshore Oil And Gas Decommissioning Market Volume (K Units) Forecast, by Application 2020 & 2033
- Table 63: Israel UK Offshore Oil And Gas Decommissioning Market Revenue (billion) Forecast, by Application 2020 & 2033
- Table 64: Israel UK Offshore Oil And Gas Decommissioning Market Volume (K Units) Forecast, by Application 2020 & 2033
- Table 65: GCC UK Offshore Oil And Gas Decommissioning Market Revenue (billion) Forecast, by Application 2020 & 2033
- Table 66: GCC UK Offshore Oil And Gas Decommissioning Market Volume (K Units) Forecast, by Application 2020 & 2033
- Table 67: North Africa UK Offshore Oil And Gas Decommissioning Market Revenue (billion) Forecast, by Application 2020 & 2033
- Table 68: North Africa UK Offshore Oil And Gas Decommissioning Market Volume (K Units) Forecast, by Application 2020 & 2033
- Table 69: South Africa UK Offshore Oil And Gas Decommissioning Market Revenue (billion) Forecast, by Application 2020 & 2033
- Table 70: South Africa UK Offshore Oil And Gas Decommissioning Market Volume (K Units) Forecast, by Application 2020 & 2033
- Table 71: Rest of Middle East & Africa UK Offshore Oil And Gas Decommissioning Market Revenue (billion) Forecast, by Application 2020 & 2033
- Table 72: Rest of Middle East & Africa UK Offshore Oil And Gas Decommissioning Market Volume (K Units) Forecast, by Application 2020 & 2033
- Table 73: Global UK Offshore Oil And Gas Decommissioning Market Revenue billion Forecast, by Shallow Water 2020 & 2033
- Table 74: Global UK Offshore Oil And Gas Decommissioning Market Volume K Units Forecast, by Shallow Water 2020 & 2033
- Table 75: Global UK Offshore Oil And Gas Decommissioning Market Revenue billion Forecast, by Deepwater and Ultra-Deep Water 2020 & 2033
- Table 76: Global UK Offshore Oil And Gas Decommissioning Market Volume K Units Forecast, by Deepwater and Ultra-Deep Water 2020 & 2033
- Table 77: Global UK Offshore Oil And Gas Decommissioning Market Revenue billion Forecast, by Country 2020 & 2033
- Table 78: Global UK Offshore Oil And Gas Decommissioning Market Volume K Units Forecast, by Country 2020 & 2033
- Table 79: China UK Offshore Oil And Gas Decommissioning Market Revenue (billion) Forecast, by Application 2020 & 2033
- Table 80: China UK Offshore Oil And Gas Decommissioning Market Volume (K Units) Forecast, by Application 2020 & 2033
- Table 81: India UK Offshore Oil And Gas Decommissioning Market Revenue (billion) Forecast, by Application 2020 & 2033
- Table 82: India UK Offshore Oil And Gas Decommissioning Market Volume (K Units) Forecast, by Application 2020 & 2033
- Table 83: Japan UK Offshore Oil And Gas Decommissioning Market Revenue (billion) Forecast, by Application 2020 & 2033
- Table 84: Japan UK Offshore Oil And Gas Decommissioning Market Volume (K Units) Forecast, by Application 2020 & 2033
- Table 85: South Korea UK Offshore Oil And Gas Decommissioning Market Revenue (billion) Forecast, by Application 2020 & 2033
- Table 86: South Korea UK Offshore Oil And Gas Decommissioning Market Volume (K Units) Forecast, by Application 2020 & 2033
- Table 87: ASEAN UK Offshore Oil And Gas Decommissioning Market Revenue (billion) Forecast, by Application 2020 & 2033
- Table 88: ASEAN UK Offshore Oil And Gas Decommissioning Market Volume (K Units) Forecast, by Application 2020 & 2033
- Table 89: Oceania UK Offshore Oil And Gas Decommissioning Market Revenue (billion) Forecast, by Application 2020 & 2033
- Table 90: Oceania UK Offshore Oil And Gas Decommissioning Market Volume (K Units) Forecast, by Application 2020 & 2033
- Table 91: Rest of Asia Pacific UK Offshore Oil And Gas Decommissioning Market Revenue (billion) Forecast, by Application 2020 & 2033
- Table 92: Rest of Asia Pacific UK Offshore Oil And Gas Decommissioning Market Volume (K Units) Forecast, by Application 2020 & 2033
Frequently Asked Questions
1. What is the projected Compound Annual Growth Rate (CAGR) of the UK Offshore Oil And Gas Decommissioning Market?
The projected CAGR is approximately 6.5%.
2. Which companies are prominent players in the UK Offshore Oil And Gas Decommissioning Market?
Key companies in the market include Veolia Environnement S A, John Lawrie Group Ltd *List Not Exhaustive, AF Gruppen ASA, Ramboll Group A/S, Perenco SA, Derrick Services (UK) Ltd.
3. What are the main segments of the UK Offshore Oil And Gas Decommissioning Market?
The market segments include Shallow Water, Deepwater and Ultra-Deep Water.
4. Can you provide details about the market size?
The market size is estimated to be USD 11.1 billion as of 2022.
5. What are some drivers contributing to market growth?
4.; Supportive Government Policies in Developing Solar Energy4.; Abundant Solar Resources Across the Country.
6. What are the notable trends driving market growth?
Increasing Decommissioning Projects to Drive the Market.
7. Are there any restraints impacting market growth?
4.; Competition from Conventional Energy Sources.
8. Can you provide examples of recent developments in the market?
November 2022: there were more than 2,000 abandoned oil and gas wells in the North Sea begin, The high number of abandoned wells is expected to lead to an increase in activity as operations worth EUR 20 billion are decommissioned and shut down. The research was conducted by industry group Offshore Energies UK (OEUK), formerly Oil & Gas UK, which provides fresh insight into petroleum decommissioning efforts.
9. What pricing options are available for accessing the report?
Pricing options include single-user, multi-user, and enterprise licenses priced at USD 3800, USD 4500, and USD 5800 respectively.
10. Is the market size provided in terms of value or volume?
The market size is provided in terms of value, measured in billion and volume, measured in K Units.
11. Are there any specific market keywords associated with the report?
Yes, the market keyword associated with the report is "UK Offshore Oil And Gas Decommissioning Market," which aids in identifying and referencing the specific market segment covered.
12. How do I determine which pricing option suits my needs best?
The pricing options vary based on user requirements and access needs. Individual users may opt for single-user licenses, while businesses requiring broader access may choose multi-user or enterprise licenses for cost-effective access to the report.
13. Are there any additional resources or data provided in the UK Offshore Oil And Gas Decommissioning Market report?
While the report offers comprehensive insights, it's advisable to review the specific contents or supplementary materials provided to ascertain if additional resources or data are available.
14. How can I stay updated on further developments or reports in the UK Offshore Oil And Gas Decommissioning Market?
To stay informed about further developments, trends, and reports in the UK Offshore Oil And Gas Decommissioning Market, consider subscribing to industry newsletters, following relevant companies and organizations, or regularly checking reputable industry news sources and publications.
Methodology
Step 1 - Identification of Relevant Samples Size from Population Database


Step 2 - Approaches for Defining Global Market Size (Value, Volume* & Price*)

Note*: In applicable scenarios
Step 3 - Data Sources
Primary Research
- Web Analytics
- Survey Reports
- Research Institute
- Latest Research Reports
- Opinion Leaders
Secondary Research
- Annual Reports
- White Paper
- Latest Press Release
- Industry Association
- Paid Database
- Investor Presentations

Step 4 - Data Triangulation
Involves using different sources of information in order to increase the validity of a study
These sources are likely to be stakeholders in a program - participants, other researchers, program staff, other community members, and so on.
Then we put all data in single framework & apply various statistical tools to find out the dynamic on the market.
During the analysis stage, feedback from the stakeholder groups would be compared to determine areas of agreement as well as areas of divergence