
Key Insights
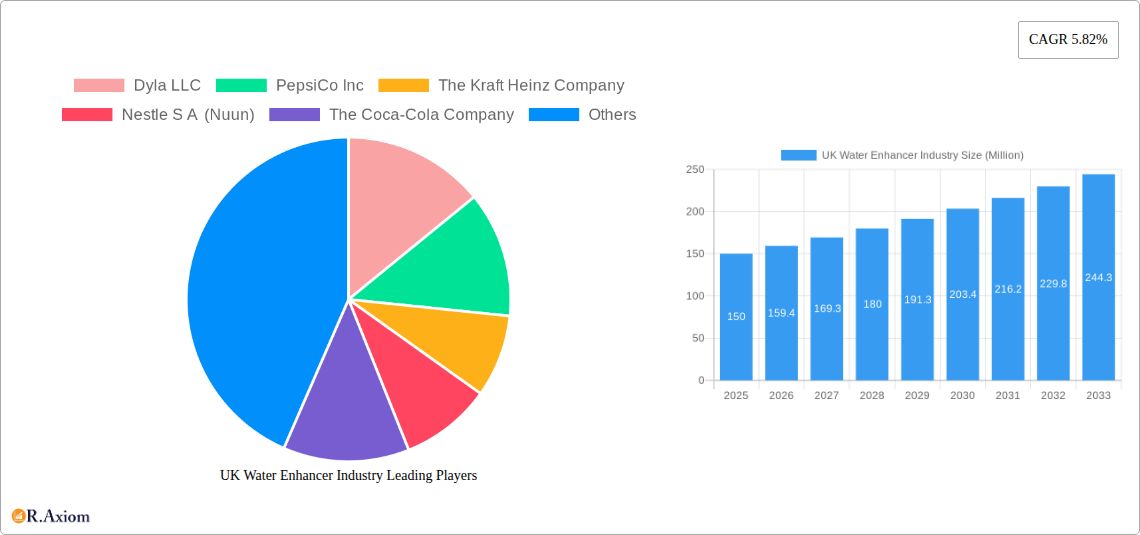
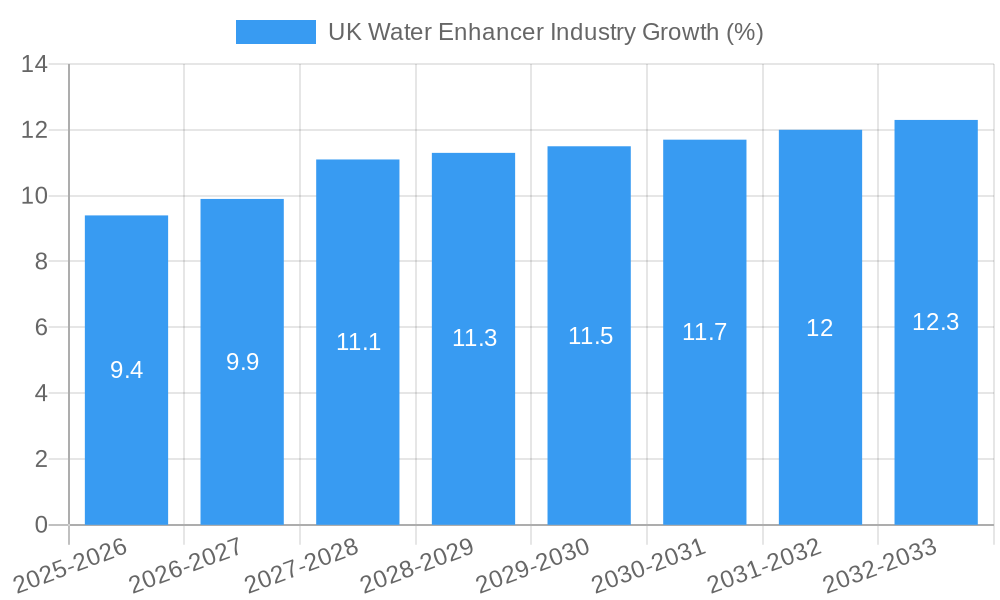
The UK water enhancer market, valued at approximately £150 million in 2025, is projected to experience robust growth, exhibiting a compound annual growth rate (CAGR) of 5.82% from 2025 to 2033. This expansion is driven by several key factors. The rising consumer awareness of health and wellness, coupled with a growing preference for healthier beverage alternatives to sugary drinks, fuels significant demand. The convenience and versatility of water enhancers, allowing for easy customization of flavor and sweetness levels, further contribute to their popularity. Moreover, the increasing availability of water enhancers across diverse distribution channels, including hypermarkets, supermarkets, convenience stores, and online retail platforms, enhances market accessibility. The presence of established players like PepsiCo, Nestle, and Coca-Cola, alongside smaller specialized brands, fosters competition and innovation within the sector, resulting in a diverse product landscape catering to a wide range of consumer preferences.
However, the market is not without its challenges. Price sensitivity among consumers, particularly in the current economic climate, could restrain market growth. Furthermore, the emergence of competing products, such as flavored sparkling water and naturally infused waters, presents a competitive landscape. To maintain growth trajectory, companies must focus on product innovation, such as the development of functional water enhancers with added vitamins or electrolytes, to cater to evolving consumer needs and preferences. Effective marketing strategies highlighting the health benefits and convenience of water enhancers are also crucial for sustaining market momentum in the years to come. Targeting specific demographics with tailored marketing campaigns will be key to driving continued expansion in this dynamic market segment.
This comprehensive report provides a detailed analysis of the UK water enhancer industry, covering market size, growth trends, competitive landscape, and future prospects. The study period spans from 2019 to 2033, with 2025 serving as the base and estimated year. The report is invaluable for industry stakeholders, investors, and businesses seeking to understand and capitalize on opportunities within this dynamic market.
UK Water Enhancer Industry Market Concentration & Innovation
The UK water enhancer market exhibits a moderately concentrated landscape, with key players holding significant market share. PepsiCo Inc., The Coca-Cola Company, and Nestle S.A. (Nuun) are among the major players, commanding a combined xx% market share in 2025 (estimated). Smaller players like Dyla LLC and Britvic plc contribute significantly to the overall market dynamism. Market concentration is influenced by factors such as brand recognition, distribution networks, and product innovation.
- Innovation Drivers: The market is driven by consumer demand for healthier beverage options, leading to innovations in natural flavorings, added vitamins and minerals, and functional benefits. Sugar-free and low-calorie options are gaining significant traction.
- Regulatory Framework: Regulations surrounding food and beverage labeling, health claims, and sugar content significantly impact product development and marketing strategies. Compliance with these regulations is crucial for market success.
- Product Substitutes: The industry faces competition from other hydration options like plain water, fruit juices, and sports drinks. The key to success lies in differentiating through unique flavors, health benefits, and convenient formats.
- End-User Trends: Health-conscious consumers are driving demand for water enhancers with functional benefits. Convenience and portability are also key factors influencing purchasing decisions. The rising popularity of on-the-go lifestyles supports the growth of single-serve and portable formats.
- M&A Activities: The UK water enhancer market has witnessed xx M&A deals between 2019 and 2024, with a total estimated value of £xx Million. These activities often involve strategic acquisitions by major players aiming to expand their product portfolios and distribution networks. Deal values are expected to continue to rise reflecting the attractiveness of this market.
UK Water Enhancer Industry Industry Trends & Insights
The UK water enhancer market is experiencing robust growth, driven by several key factors. The market exhibited a CAGR of xx% during the historical period (2019-2024) and is projected to grow at a CAGR of xx% during the forecast period (2025-2033), reaching a market value of £xx Million by 2033.
Market growth is fueled by increased consumer awareness of hydration importance and a preference for healthier beverage alternatives. This preference aligns with ongoing trends toward healthier lifestyles and increased spending on wellness products. The rising popularity of functional beverages, which offer added health benefits beyond simple hydration, is a key factor. Technological advancements, such as improved flavoring technologies and sustainable packaging solutions, also contribute to market growth. Competitive dynamics are intense, with companies focusing on product innovation, marketing, and distribution to gain market share. Market penetration increased from xx% in 2019 to xx% in 2024 and is predicted to reach xx% by 2033.
Dominant Markets & Segments in UK Water Enhancer Industry
The hypermarket/supermarket segment dominates the UK water enhancer market, accounting for approximately xx% of total sales in 2025. This dominance stems from the extensive reach and established distribution networks of these retailers. Convenience stores hold a significant share, reflecting the high demand for on-the-go hydration solutions. Online retail stores are experiencing rapid growth, driven by increasing e-commerce penetration and consumer convenience.
Hypermarket/Supermarket:
- Strong established distribution networks.
- Wide range of products available.
- Competitive pricing strategies.
- Large consumer base.
Convenience Stores:
- High foot traffic in convenient locations.
- Focus on impulse purchases.
- High margins on smaller pack sizes.
Online Retail Stores:
- Increasing convenience and accessibility.
- Wide product selection.
- Targeted advertising capabilities.
Other Distribution Channels: This segment includes smaller independent retailers, specialized health food stores, and direct-to-consumer channels, each contributing modestly to the overall market.
UK Water Enhancer Industry Product Developments
Recent product innovations focus on enhanced flavors, functional benefits (e.g., added vitamins, electrolytes, and natural caffeine), and convenient packaging formats like single-serve sachets and drops. The growing demand for sugar-free and low-calorie options is driving the development of natural sweeteners and flavor enhancers. These trends reflect a strategic shift by manufacturers to cater to a health-conscious consumer base seeking both taste and functionality. Technological advancements in flavor delivery and stabilization, and sustainable packaging materials, are contributing to product differentiation and improved consumer appeal.
Report Scope & Segmentation Analysis
This report comprehensively analyzes the UK water enhancer market across four key distribution channels: Hypermarket/Supermarket, Convenience Store, Online Retail Stores, and Other Distribution Channels. Each segment is analyzed in terms of market size, growth rate, and competitive dynamics. Growth projections, detailed market size estimations, and a competitive landscape assessment are included for each channel, providing a granular overview of market opportunities and competitive dynamics.
- Hypermarket/Supermarket: This segment is projected to maintain its leading position with consistent growth, driven by the continued expansion of retail chains and increased consumer spending.
- Convenience Stores: This segment will exhibit steady growth propelled by the growing demand for convenient, on-the-go hydration solutions.
- Online Retail Stores: This segment is expected to experience the fastest growth, driven by the escalating adoption of e-commerce and online shopping preferences.
- Other Distribution Channels: This segment presents niche opportunities but will contribute comparatively less to the overall market growth.
Key Drivers of UK Water Enhancer Industry Growth
The UK water enhancer market is experiencing significant growth due to several factors:
- Health and Wellness Trend: Growing consumer awareness of hydration's importance fuels demand for healthier beverage alternatives.
- Functional Benefits: The increasing popularity of functional beverages with added vitamins, minerals, and other beneficial ingredients are creating new market segments and driving demand.
- Convenience: The availability of convenient packaging options, such as single-serve sachets and portable bottles, boosts market penetration across various lifestyle situations.
- Product Innovation: Continuous innovation in flavours, formulations, and packaging increases market appeal and encourages repeat purchases.
Challenges in the UK Water Enhancer Industry Sector
The industry faces challenges including:
- Intense Competition: The presence of established beverage giants and smaller, specialized brands creates a highly competitive market environment.
- Health and Regulatory Concerns: Stringent regulations related to food safety and labeling and ongoing health consciousness concerns impact product development and marketing strategies.
- Supply Chain Disruptions: Global supply chain vulnerabilities can affect raw material availability and production costs, impacting market stability.
Emerging Opportunities in UK Water Enhancer Industry
Significant emerging opportunities exist for growth and innovation in this market, including:
- Premiumization: Consumers are increasingly willing to pay more for high-quality, premium water enhancers with unique flavours and added functional benefits.
- Sustainability: Demand for sustainable packaging and ethically sourced ingredients provides opportunities for brands committed to environmental responsibility.
- Functional Beverages: The development of functional beverages with specific health benefits (e.g., immunity support, energy boosts) offers high growth potential.
Leading Players in the UK Water Enhancer Industry Market
- Dyla LLC
- PepsiCo Inc
- The Kraft Heinz Company
- Nestle S.A. (Nuun)
- The Coca-Cola Company
- Jelsert (Starburst)
- Refresco
- Wisdom Natural Brands
- Exante Diet Ltd
- Britvic plc
Key Developments in UK Water Enhancer Industry Industry
- July 2021: Crème de la Cream launched Chupa Chups-flavored Lolly Drops, a sugar-free water enhancer line. This expansion into licensed brands significantly broadened market appeal.
- November 2021: Waterdrop introduced NERO, a natural energy microdrink with vitamins and caffeine. This highlights a trend towards functional water enhancers.
- April 2022: Britvic plc launched Robinsons Benefit Drops, vitamin-infused water enhancers in a convenient portable format. This innovation caters to the growing demand for on-the-go hydration solutions with added health benefits.
Strategic Outlook for UK Water Enhancer Industry Market
The UK water enhancer market presents significant growth opportunities. Continued innovation in product development, focusing on health and wellness trends, coupled with effective marketing and distribution strategies, will be crucial for success. Market players are anticipated to increasingly concentrate on sustainability, premiumization, and expansion into online channels. The market’s future growth is promising given the rising demand for healthier beverages and convenient hydration options.
UK Water Enhancer Industry Segmentation
-
1. Distribution Channel
- 1.1. Hypermarket/Supermarket
- 1.2. Convenience Store
- 1.3. Online Retails Stores
- 1.4. Other Distribution Channels
UK Water Enhancer Industry Segmentation By Geography
-
1. North America
- 1.1. United States
- 1.2. Canada
- 1.3. Mexico
-
2. South America
- 2.1. Brazil
- 2.2. Argentina
- 2.3. Rest of South America
-
3. Europe
- 3.1. United Kingdom
- 3.2. Germany
- 3.3. France
- 3.4. Italy
- 3.5. Spain
- 3.6. Russia
- 3.7. Benelux
- 3.8. Nordics
- 3.9. Rest of Europe
-
4. Middle East & Africa
- 4.1. Turkey
- 4.2. Israel
- 4.3. GCC
- 4.4. North Africa
- 4.5. South Africa
- 4.6. Rest of Middle East & Africa
-
5. Asia Pacific
- 5.1. China
- 5.2. India
- 5.3. Japan
- 5.4. South Korea
- 5.5. ASEAN
- 5.6. Oceania
- 5.7. Rest of Asia Pacific
UK Water Enhancer Industry REPORT HIGHLIGHTS
| Aspects | Details |
|---|---|
| Study Period | 2019-2033 |
| Base Year | 2024 |
| Estimated Year | 2025 |
| Forecast Period | 2025-2033 |
| Historical Period | 2019-2024 |
| Growth Rate | CAGR of 5.82% from 2019-2033 |
| Segmentation |
|
Table of Contents
- 1. Introduction
- 1.1. Research Scope
- 1.2. Market Segmentation
- 1.3. Research Methodology
- 1.4. Definitions and Assumptions
- 2. Executive Summary
- 2.1. Introduction
- 3. Market Dynamics
- 3.1. Introduction
- 3.2. Market Drivers
- 3.2.1. Rise of e-commerce has made it easier for consumers to access a wide variety of water enhancers
- 3.3. Market Restrains
- 3.3.1. Economic downturns or fluctuations in disposable income can impact consumer spending on non-essential products
- 3.4. Market Trends
- 3.4.1. Growing trend towards personalized nutrition and functional beverages supports the market for water enhancers
- 4. Market Factor Analysis
- 4.1. Porters Five Forces
- 4.2. Supply/Value Chain
- 4.3. PESTEL analysis
- 4.4. Market Entropy
- 4.5. Patent/Trademark Analysis
- 5. Global UK Water Enhancer Industry Analysis, Insights and Forecast, 2019-2031
- 5.1. Market Analysis, Insights and Forecast - by Distribution Channel
- 5.1.1. Hypermarket/Supermarket
- 5.1.2. Convenience Store
- 5.1.3. Online Retails Stores
- 5.1.4. Other Distribution Channels
- 5.2. Market Analysis, Insights and Forecast - by Region
- 5.2.1. North America
- 5.2.2. South America
- 5.2.3. Europe
- 5.2.4. Middle East & Africa
- 5.2.5. Asia Pacific
- 5.1. Market Analysis, Insights and Forecast - by Distribution Channel
- 6. North America UK Water Enhancer Industry Analysis, Insights and Forecast, 2019-2031
- 6.1. Market Analysis, Insights and Forecast - by Distribution Channel
- 6.1.1. Hypermarket/Supermarket
- 6.1.2. Convenience Store
- 6.1.3. Online Retails Stores
- 6.1.4. Other Distribution Channels
- 6.1. Market Analysis, Insights and Forecast - by Distribution Channel
- 7. South America UK Water Enhancer Industry Analysis, Insights and Forecast, 2019-2031
- 7.1. Market Analysis, Insights and Forecast - by Distribution Channel
- 7.1.1. Hypermarket/Supermarket
- 7.1.2. Convenience Store
- 7.1.3. Online Retails Stores
- 7.1.4. Other Distribution Channels
- 7.1. Market Analysis, Insights and Forecast - by Distribution Channel
- 8. Europe UK Water Enhancer Industry Analysis, Insights and Forecast, 2019-2031
- 8.1. Market Analysis, Insights and Forecast - by Distribution Channel
- 8.1.1. Hypermarket/Supermarket
- 8.1.2. Convenience Store
- 8.1.3. Online Retails Stores
- 8.1.4. Other Distribution Channels
- 8.1. Market Analysis, Insights and Forecast - by Distribution Channel
- 9. Middle East & Africa UK Water Enhancer Industry Analysis, Insights and Forecast, 2019-2031
- 9.1. Market Analysis, Insights and Forecast - by Distribution Channel
- 9.1.1. Hypermarket/Supermarket
- 9.1.2. Convenience Store
- 9.1.3. Online Retails Stores
- 9.1.4. Other Distribution Channels
- 9.1. Market Analysis, Insights and Forecast - by Distribution Channel
- 10. Asia Pacific UK Water Enhancer Industry Analysis, Insights and Forecast, 2019-2031
- 10.1. Market Analysis, Insights and Forecast - by Distribution Channel
- 10.1.1. Hypermarket/Supermarket
- 10.1.2. Convenience Store
- 10.1.3. Online Retails Stores
- 10.1.4. Other Distribution Channels
- 10.1. Market Analysis, Insights and Forecast - by Distribution Channel
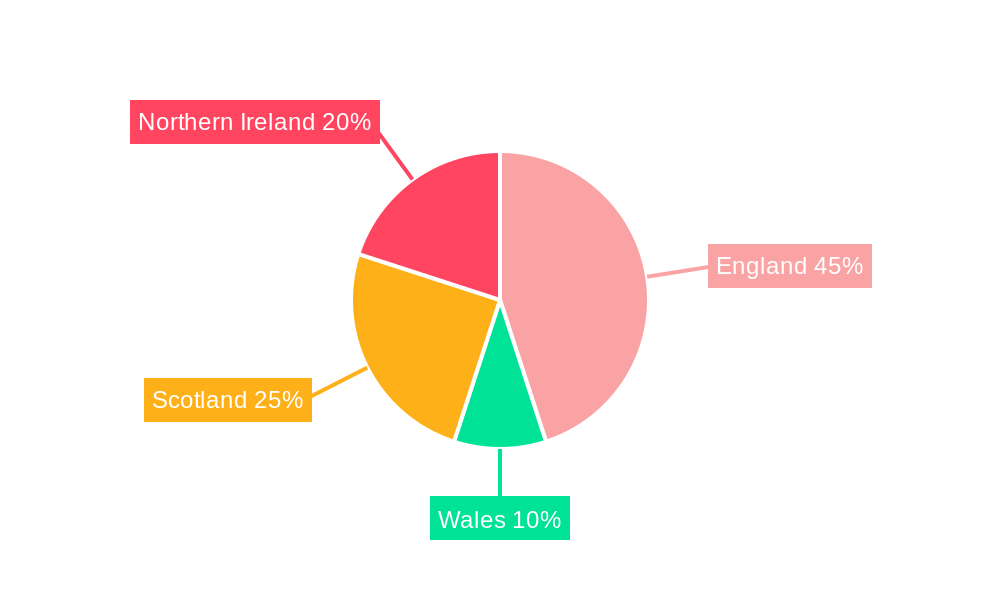
- 11. England UK Water Enhancer Industry Analysis, Insights and Forecast, 2019-2031
- 12. Wales UK Water Enhancer Industry Analysis, Insights and Forecast, 2019-2031
- 13. Scotland UK Water Enhancer Industry Analysis, Insights and Forecast, 2019-2031
- 14. Northern UK Water Enhancer Industry Analysis, Insights and Forecast, 2019-2031
- 15. Ireland UK Water Enhancer Industry Analysis, Insights and Forecast, 2019-2031
- 16. Competitive Analysis
- 16.1. Global Market Share Analysis 2024
- 16.2. Company Profiles
- 16.2.1 Dyla LLC
- 16.2.1.1. Overview
- 16.2.1.2. Products
- 16.2.1.3. SWOT Analysis
- 16.2.1.4. Recent Developments
- 16.2.1.5. Financials (Based on Availability)
- 16.2.2 PepsiCo Inc
- 16.2.2.1. Overview
- 16.2.2.2. Products
- 16.2.2.3. SWOT Analysis
- 16.2.2.4. Recent Developments
- 16.2.2.5. Financials (Based on Availability)
- 16.2.3 The Kraft Heinz Company
- 16.2.3.1. Overview
- 16.2.3.2. Products
- 16.2.3.3. SWOT Analysis
- 16.2.3.4. Recent Developments
- 16.2.3.5. Financials (Based on Availability)
- 16.2.4 Nestle S A (Nuun)
- 16.2.4.1. Overview
- 16.2.4.2. Products
- 16.2.4.3. SWOT Analysis
- 16.2.4.4. Recent Developments
- 16.2.4.5. Financials (Based on Availability)
- 16.2.5 The Coca-Cola Company
- 16.2.5.1. Overview
- 16.2.5.2. Products
- 16.2.5.3. SWOT Analysis
- 16.2.5.4. Recent Developments
- 16.2.5.5. Financials (Based on Availability)
- 16.2.6 Jelsert (Starburst)
- 16.2.6.1. Overview
- 16.2.6.2. Products
- 16.2.6.3. SWOT Analysis
- 16.2.6.4. Recent Developments
- 16.2.6.5. Financials (Based on Availability)
- 16.2.7 Refresco
- 16.2.7.1. Overview
- 16.2.7.2. Products
- 16.2.7.3. SWOT Analysis
- 16.2.7.4. Recent Developments
- 16.2.7.5. Financials (Based on Availability)
- 16.2.8 Wisdom Natural Brands
- 16.2.8.1. Overview
- 16.2.8.2. Products
- 16.2.8.3. SWOT Analysis
- 16.2.8.4. Recent Developments
- 16.2.8.5. Financials (Based on Availability)
- 16.2.9 Exante Diet Ltd
- 16.2.9.1. Overview
- 16.2.9.2. Products
- 16.2.9.3. SWOT Analysis
- 16.2.9.4. Recent Developments
- 16.2.9.5. Financials (Based on Availability)
- 16.2.10 Britvic plc
- 16.2.10.1. Overview
- 16.2.10.2. Products
- 16.2.10.3. SWOT Analysis
- 16.2.10.4. Recent Developments
- 16.2.10.5. Financials (Based on Availability)
- 16.2.1 Dyla LLC
List of Figures
- Figure 1: Global UK Water Enhancer Industry Revenue Breakdown (Million, %) by Region 2024 & 2032
- Figure 2: United kingdom Region UK Water Enhancer Industry Revenue (Million), by Country 2024 & 2032
- Figure 3: United kingdom Region UK Water Enhancer Industry Revenue Share (%), by Country 2024 & 2032
- Figure 4: North America UK Water Enhancer Industry Revenue (Million), by Distribution Channel 2024 & 2032
- Figure 5: North America UK Water Enhancer Industry Revenue Share (%), by Distribution Channel 2024 & 2032
- Figure 6: North America UK Water Enhancer Industry Revenue (Million), by Country 2024 & 2032
- Figure 7: North America UK Water Enhancer Industry Revenue Share (%), by Country 2024 & 2032
- Figure 8: South America UK Water Enhancer Industry Revenue (Million), by Distribution Channel 2024 & 2032
- Figure 9: South America UK Water Enhancer Industry Revenue Share (%), by Distribution Channel 2024 & 2032
- Figure 10: South America UK Water Enhancer Industry Revenue (Million), by Country 2024 & 2032
- Figure 11: South America UK Water Enhancer Industry Revenue Share (%), by Country 2024 & 2032
- Figure 12: Europe UK Water Enhancer Industry Revenue (Million), by Distribution Channel 2024 & 2032
- Figure 13: Europe UK Water Enhancer Industry Revenue Share (%), by Distribution Channel 2024 & 2032
- Figure 14: Europe UK Water Enhancer Industry Revenue (Million), by Country 2024 & 2032
- Figure 15: Europe UK Water Enhancer Industry Revenue Share (%), by Country 2024 & 2032
- Figure 16: Middle East & Africa UK Water Enhancer Industry Revenue (Million), by Distribution Channel 2024 & 2032
- Figure 17: Middle East & Africa UK Water Enhancer Industry Revenue Share (%), by Distribution Channel 2024 & 2032
- Figure 18: Middle East & Africa UK Water Enhancer Industry Revenue (Million), by Country 2024 & 2032
- Figure 19: Middle East & Africa UK Water Enhancer Industry Revenue Share (%), by Country 2024 & 2032
- Figure 20: Asia Pacific UK Water Enhancer Industry Revenue (Million), by Distribution Channel 2024 & 2032
- Figure 21: Asia Pacific UK Water Enhancer Industry Revenue Share (%), by Distribution Channel 2024 & 2032
- Figure 22: Asia Pacific UK Water Enhancer Industry Revenue (Million), by Country 2024 & 2032
- Figure 23: Asia Pacific UK Water Enhancer Industry Revenue Share (%), by Country 2024 & 2032
List of Tables
- Table 1: Global UK Water Enhancer Industry Revenue Million Forecast, by Region 2019 & 2032
- Table 2: Global UK Water Enhancer Industry Revenue Million Forecast, by Distribution Channel 2019 & 2032
- Table 3: Global UK Water Enhancer Industry Revenue Million Forecast, by Region 2019 & 2032
- Table 4: Global UK Water Enhancer Industry Revenue Million Forecast, by Country 2019 & 2032
- Table 5: England UK Water Enhancer Industry Revenue (Million) Forecast, by Application 2019 & 2032
- Table 6: Wales UK Water Enhancer Industry Revenue (Million) Forecast, by Application 2019 & 2032
- Table 7: Scotland UK Water Enhancer Industry Revenue (Million) Forecast, by Application 2019 & 2032
- Table 8: Northern UK Water Enhancer Industry Revenue (Million) Forecast, by Application 2019 & 2032
- Table 9: Ireland UK Water Enhancer Industry Revenue (Million) Forecast, by Application 2019 & 2032
- Table 10: Global UK Water Enhancer Industry Revenue Million Forecast, by Distribution Channel 2019 & 2032
- Table 11: Global UK Water Enhancer Industry Revenue Million Forecast, by Country 2019 & 2032
- Table 12: United States UK Water Enhancer Industry Revenue (Million) Forecast, by Application 2019 & 2032
- Table 13: Canada UK Water Enhancer Industry Revenue (Million) Forecast, by Application 2019 & 2032
- Table 14: Mexico UK Water Enhancer Industry Revenue (Million) Forecast, by Application 2019 & 2032
- Table 15: Global UK Water Enhancer Industry Revenue Million Forecast, by Distribution Channel 2019 & 2032
- Table 16: Global UK Water Enhancer Industry Revenue Million Forecast, by Country 2019 & 2032
- Table 17: Brazil UK Water Enhancer Industry Revenue (Million) Forecast, by Application 2019 & 2032
- Table 18: Argentina UK Water Enhancer Industry Revenue (Million) Forecast, by Application 2019 & 2032
- Table 19: Rest of South America UK Water Enhancer Industry Revenue (Million) Forecast, by Application 2019 & 2032
- Table 20: Global UK Water Enhancer Industry Revenue Million Forecast, by Distribution Channel 2019 & 2032
- Table 21: Global UK Water Enhancer Industry Revenue Million Forecast, by Country 2019 & 2032
- Table 22: United Kingdom UK Water Enhancer Industry Revenue (Million) Forecast, by Application 2019 & 2032
- Table 23: Germany UK Water Enhancer Industry Revenue (Million) Forecast, by Application 2019 & 2032
- Table 24: France UK Water Enhancer Industry Revenue (Million) Forecast, by Application 2019 & 2032
- Table 25: Italy UK Water Enhancer Industry Revenue (Million) Forecast, by Application 2019 & 2032
- Table 26: Spain UK Water Enhancer Industry Revenue (Million) Forecast, by Application 2019 & 2032
- Table 27: Russia UK Water Enhancer Industry Revenue (Million) Forecast, by Application 2019 & 2032
- Table 28: Benelux UK Water Enhancer Industry Revenue (Million) Forecast, by Application 2019 & 2032
- Table 29: Nordics UK Water Enhancer Industry Revenue (Million) Forecast, by Application 2019 & 2032
- Table 30: Rest of Europe UK Water Enhancer Industry Revenue (Million) Forecast, by Application 2019 & 2032
- Table 31: Global UK Water Enhancer Industry Revenue Million Forecast, by Distribution Channel 2019 & 2032
- Table 32: Global UK Water Enhancer Industry Revenue Million Forecast, by Country 2019 & 2032
- Table 33: Turkey UK Water Enhancer Industry Revenue (Million) Forecast, by Application 2019 & 2032
- Table 34: Israel UK Water Enhancer Industry Revenue (Million) Forecast, by Application 2019 & 2032
- Table 35: GCC UK Water Enhancer Industry Revenue (Million) Forecast, by Application 2019 & 2032
- Table 36: North Africa UK Water Enhancer Industry Revenue (Million) Forecast, by Application 2019 & 2032
- Table 37: South Africa UK Water Enhancer Industry Revenue (Million) Forecast, by Application 2019 & 2032
- Table 38: Rest of Middle East & Africa UK Water Enhancer Industry Revenue (Million) Forecast, by Application 2019 & 2032
- Table 39: Global UK Water Enhancer Industry Revenue Million Forecast, by Distribution Channel 2019 & 2032
- Table 40: Global UK Water Enhancer Industry Revenue Million Forecast, by Country 2019 & 2032
- Table 41: China UK Water Enhancer Industry Revenue (Million) Forecast, by Application 2019 & 2032
- Table 42: India UK Water Enhancer Industry Revenue (Million) Forecast, by Application 2019 & 2032
- Table 43: Japan UK Water Enhancer Industry Revenue (Million) Forecast, by Application 2019 & 2032
- Table 44: South Korea UK Water Enhancer Industry Revenue (Million) Forecast, by Application 2019 & 2032
- Table 45: ASEAN UK Water Enhancer Industry Revenue (Million) Forecast, by Application 2019 & 2032
- Table 46: Oceania UK Water Enhancer Industry Revenue (Million) Forecast, by Application 2019 & 2032
- Table 47: Rest of Asia Pacific UK Water Enhancer Industry Revenue (Million) Forecast, by Application 2019 & 2032
Frequently Asked Questions
1. What is the projected Compound Annual Growth Rate (CAGR) of the UK Water Enhancer Industry?
The projected CAGR is approximately 5.82%.
2. Which companies are prominent players in the UK Water Enhancer Industry?
Key companies in the market include Dyla LLC, PepsiCo Inc, The Kraft Heinz Company, Nestle S A (Nuun), The Coca-Cola Company, Jelsert (Starburst), Refresco, Wisdom Natural Brands, Exante Diet Ltd, Britvic plc.
3. What are the main segments of the UK Water Enhancer Industry?
The market segments include Distribution Channel.
4. Can you provide details about the market size?
The market size is estimated to be USD XX Million as of 2022.
5. What are some drivers contributing to market growth?
Rise of e-commerce has made it easier for consumers to access a wide variety of water enhancers.
6. What are the notable trends driving market growth?
Growing trend towards personalized nutrition and functional beverages supports the market for water enhancers.
7. Are there any restraints impacting market growth?
Economic downturns or fluctuations in disposable income can impact consumer spending on non-essential products.
8. Can you provide examples of recent developments in the market?
In April 2022, Robinsons, a brand of Britvic plc launched water enhancer new Benefit Drops with added vitamins in four different flavors. Benefit drops are the perfect portable format for consumers on the go as they deliver great taste and additional vitamins in their water consumption.
9. What pricing options are available for accessing the report?
Pricing options include single-user, multi-user, and enterprise licenses priced at USD 3800, USD 4500, and USD 5800 respectively.
10. Is the market size provided in terms of value or volume?
The market size is provided in terms of value, measured in Million.
11. Are there any specific market keywords associated with the report?
Yes, the market keyword associated with the report is "UK Water Enhancer Industry," which aids in identifying and referencing the specific market segment covered.
12. How do I determine which pricing option suits my needs best?
The pricing options vary based on user requirements and access needs. Individual users may opt for single-user licenses, while businesses requiring broader access may choose multi-user or enterprise licenses for cost-effective access to the report.
13. Are there any additional resources or data provided in the UK Water Enhancer Industry report?
While the report offers comprehensive insights, it's advisable to review the specific contents or supplementary materials provided to ascertain if additional resources or data are available.
14. How can I stay updated on further developments or reports in the UK Water Enhancer Industry?
To stay informed about further developments, trends, and reports in the UK Water Enhancer Industry, consider subscribing to industry newsletters, following relevant companies and organizations, or regularly checking reputable industry news sources and publications.
Methodology
Step 1 - Identification of Relevant Samples Size from Population Database


Step 2 - Approaches for Defining Global Market Size (Value, Volume* & Price*)

Note*: In applicable scenarios
Step 3 - Data Sources
Primary Research
- Web Analytics
- Survey Reports
- Research Institute
- Latest Research Reports
- Opinion Leaders
Secondary Research
- Annual Reports
- White Paper
- Latest Press Release
- Industry Association
- Paid Database
- Investor Presentations

Step 4 - Data Triangulation
Involves using different sources of information in order to increase the validity of a study
These sources are likely to be stakeholders in a program - participants, other researchers, program staff, other community members, and so on.
Then we put all data in single framework & apply various statistical tools to find out the dynamic on the market.
During the analysis stage, feedback from the stakeholder groups would be compared to determine areas of agreement as well as areas of divergence


