Key Insights
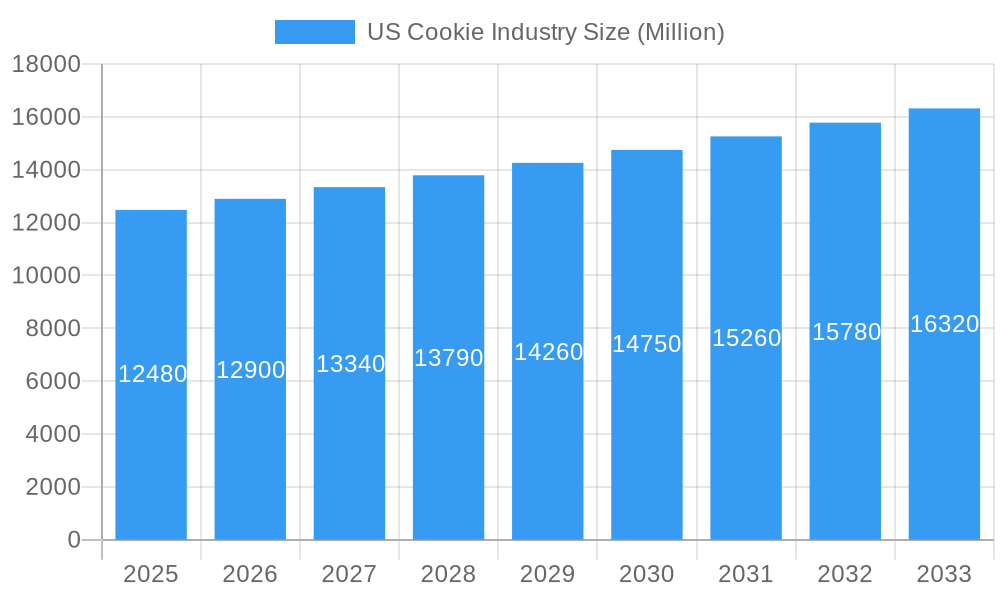
The US cookie market, a significant segment of the broader baked goods industry, is projected to experience steady growth over the forecast period (2025-2033). With a 2025 market size estimated at $12.48 billion (based on the provided global value and assuming a substantial US market share), a Compound Annual Growth Rate (CAGR) of 3.38% is anticipated. This growth is driven by several factors. The increasing popularity of convenient snack options fuels demand for individually portioned cookies and on-the-go packaging. Furthermore, the rising trend of premiumization, with consumers seeking higher-quality ingredients and unique flavors, is boosting the sales of specialty cookies and better-for-you options. Innovation in flavors, textures, and formats, including healthier alternatives with reduced sugar or gluten-free options, caters to evolving consumer preferences and contributes to market expansion. Major players like Mondelez International, General Mills, and Grupo Bimbo are strategically investing in product diversification, brand expansion, and targeted marketing campaigns to capitalize on these trends. The robust online retail channel is also a significant contributor, facilitating direct-to-consumer sales and expanding market reach. However, challenges such as fluctuating raw material prices and increasing health concerns related to sugar consumption may present headwinds to the market's growth trajectory.
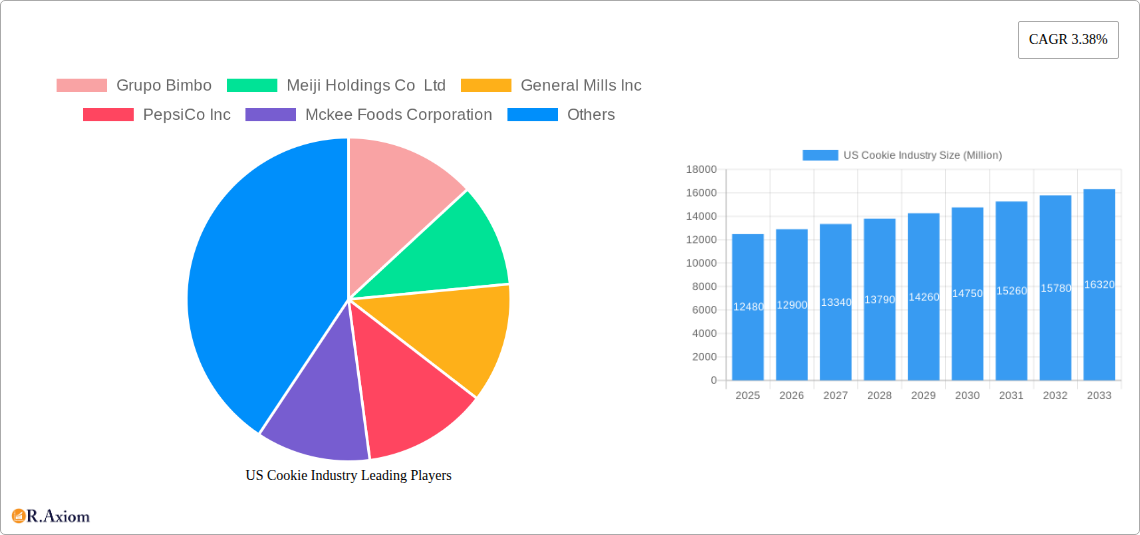
US Cookie Industry Market Size (In Billion)
The distribution landscape is diversified across hypermarkets/supermarkets, convenience stores, specialist retailers, and online platforms. Hypermarkets and supermarkets remain dominant channels, but convenience stores and online retailers are gaining traction due to their accessibility and convenience. The segmentation within the market reflects a wide range of consumer preferences, from traditional plain biscuits to gourmet chocolate-coated options and health-conscious better-for-you alternatives. While filled biscuits, chocolate-coated biscuits, and sandwich biscuits are significant segments, the "Other Types" category reflects the dynamic nature of the market and the continuous introduction of innovative product offerings. The competitive landscape is fiercely contested, with both large multinational corporations and smaller niche players vying for market share, highlighting the potential for further consolidation and innovation in the years to come.
US Cookie Industry Company Market Share
This comprehensive report provides an in-depth analysis of the US cookie industry, offering invaluable insights for stakeholders seeking to navigate this dynamic market. Covering the period from 2019 to 2033, with a focus on 2025, this report offers historical data, current market estimations, and future projections to empower strategic decision-making.
US Cookie Industry Market Concentration & Innovation
The US cookie market exhibits a moderately concentrated structure, with key players like Mondelez International Inc, Grupo Bimbo, and General Mills Inc commanding significant market share. However, the presence of numerous smaller regional and specialty brands contributes to a competitive landscape. Market share data for 2025 estimates Mondelez at approximately 25%, Grupo Bimbo at 18%, and General Mills at 12%, with the remaining share distributed among other players. Innovation is driven by evolving consumer preferences for healthier options (e.g., better-for-you cookies), premium ingredients, and unique flavors. Regulatory frameworks, primarily concerning labeling and ingredient standards, influence product formulations. The market faces competition from substitute snacks like cakes, crackers, and granola bars. End-user trends lean toward convenient, on-the-go snacking and personalized experiences. Mergers and acquisitions (M&A) activity is moderate, with deal values in the past five years averaging approximately $xx Million annually. Recent M&A activity has mainly focused on smaller players being acquired by larger conglomerates aiming to expand their product portfolios.
US Cookie Industry Industry Trends & Insights
The US cookie market is projected to experience a Compound Annual Growth Rate (CAGR) of xx% during the forecast period (2025-2033). This growth is propelled by several key factors: rising disposable incomes, increasing snacking frequency, and the introduction of innovative product offerings. Technological disruptions, such as advanced baking techniques and automated production lines, are enhancing efficiency and product quality. However, concerns about sugar content and artificial ingredients are driving a shift towards healthier alternatives. This trend is evidenced by the growing market penetration of "better-for-you" cookies, expected to reach xx% by 2033. Competitive dynamics are intensifying with the entry of new players and the expansion of existing brands into premium segments. Market penetration of online retailers is also significantly increasing, projected to reach xx% by 2033, fueled by the growth of e-commerce.
Dominant Markets & Segments in US Cookie Industry
The dominant segment within the US cookie market varies across different categories.
By Type: Cookies remain the dominant type, commanding the largest market share due to their versatility and widespread appeal. Other significant segments include chocolate-coated and filled biscuits.
By Category: The conventional cookie segment dominates in terms of volume sales, but the "better-for-you" segment showcases the most significant growth potential, reflecting the increasing health consciousness among consumers.
By Distribution Channel: Hypermarkets/supermarkets remain the primary distribution channel, but online retailers and convenience stores are experiencing rapid growth due to changing shopping habits and increased consumer demand.
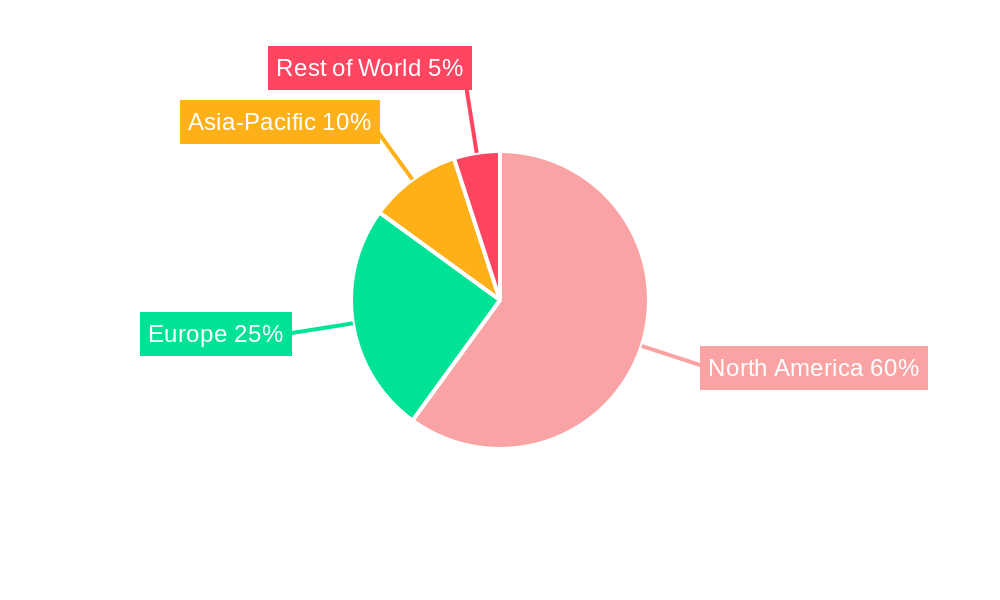
Key drivers for the dominance of specific segments include economic factors (disposable income), evolving consumer preferences (health & convenience), and the effectiveness of marketing and distribution strategies employed by leading brands. The Eastern and Western regions, due to their higher population density and greater disposable incomes, demonstrate higher per capita consumption of cookies compared to other regions.
US Cookie Industry Product Developments
Recent product innovations include the rise of gourmet cookies with unique flavors and premium ingredients, along with functional cookies that incorporate health benefits such as added fiber or protein. Technological advancements in baking processes and packaging are leading to longer shelf life and improved product consistency. These innovations cater to evolving consumer demand for healthier and more sophisticated snacking experiences, enhancing competitive advantage for brands.
Report Scope & Segmentation Analysis
This report segments the US cookie market based on Type (Filled Biscuits, Chocolate-coated Biscuits, Cookies, Sandwich Biscuits, Plain Biscuits, Other Types), Category (Conventional, Better for You), and Distribution Channel (Hypermarkets/Supermarkets, Convenience Stores, Specialist Retailers, Online Retailers, Other Distribution Channels). Each segment's growth projection, market size (in Millions), and competitive landscape are thoroughly analyzed, offering a comprehensive overview of the market dynamics within each segment. The "better-for-you" category demonstrates the highest projected CAGR among segments, highlighting significant growth opportunities.
Key Drivers of US Cookie Industry Growth
Several key factors are driving growth in the US cookie industry. These include the growing demand for convenient snacks, increased disposable incomes enabling higher discretionary spending, and the continuous innovation of new flavors and product formats. Favorable economic conditions and supportive government policies contribute to the overall positive market outlook. Furthermore, technological advancements in production and distribution efficiency improve cost-effectiveness and scalability.
Challenges in the US Cookie Industry Sector
The US cookie industry faces challenges, including increasing competition from substitute snacks, fluctuating raw material prices impacting profitability, and stringent regulatory compliance requirements related to labeling and ingredients. Supply chain disruptions can also lead to production delays and increased costs. These factors collectively put pressure on profit margins and operational efficiency.
Emerging Opportunities in US Cookie Industry
Emerging opportunities in the US cookie market include the expanding demand for organic and sustainably sourced ingredients, the rise of personalized and customized cookie options, and the growing popularity of functional cookies with added health benefits. Exploration of new flavor profiles and creative product formats can unlock further growth potential. Furthermore, leveraging digital marketing strategies to enhance brand awareness and target specific consumer demographics presents considerable opportunities.
Leading Players in the US Cookie Industry Market
- Grupo Bimbo
- Meiji Holdings Co Ltd
- General Mills Inc
- PepsiCo Inc
- McKee Foods Corporation
- Ferrero Group
- Hostess Brands LLC
- Girl Scouts of the USA
- Mondelez International Inc
- Campbell Soup Company
Key Developments in US Cookie Industry Industry
- Jul 2022: The Greater Goods Snacking Company launched new cracker, cookie, and biscotti lines, signifying a push towards healthier snacking options.
- Jun 2022: Rich's and Nestlé launched a new bake-in-store cookie range, enhancing in-store bakery offerings.
- Jun 2022: Crumbl Cookies opened a new store, reflecting the expanding market and consumer demand for specialty cookies.
Strategic Outlook for US Cookie Industry Market
The US cookie market is poised for continued growth, driven by consumer demand for convenient and indulgent snacks, along with the industry's ability to innovate and adapt to changing preferences. Opportunities lie in expanding into niche segments, such as organic and functional cookies, and in strengthening online distribution channels. Strategic partnerships and acquisitions will also play a vital role in shaping the future competitive landscape.
US Cookie Industry Segmentation
-
1. Type
- 1.1. Filled Biscuits
- 1.2. Chocolate-coated Biscuits
- 1.3. Cookies
- 1.4. Sandwich Biscuits
- 1.5. Plain Biscuits
- 1.6. Other Types
-
2. Category
- 2.1. Conventional
-
2.2. Better for You
- 2.2.1. Low Calorie
- 2.2.2. Cholesterol-free
- 2.2.3. Gluten-free
- 2.2.4. Organic
- 2.2.5. Other Categories
-
3. Distribution Channel
- 3.1. Hypermarkets/Supermarkets
- 3.2. Convenience Stores
- 3.3. Specialist Retailers
- 3.4. Online Retailers
- 3.5. Other Distribution Channels
US Cookie Industry Segmentation By Geography
-
1. North America
- 1.1. United States
- 1.2. Canada
- 1.3. Mexico
-
2. South America
- 2.1. Brazil
- 2.2. Argentina
- 2.3. Rest of South America
-
3. Europe
- 3.1. United Kingdom
- 3.2. Germany
- 3.3. France
- 3.4. Italy
- 3.5. Spain
- 3.6. Russia
- 3.7. Benelux
- 3.8. Nordics
- 3.9. Rest of Europe
-
4. Middle East & Africa
- 4.1. Turkey
- 4.2. Israel
- 4.3. GCC
- 4.4. North Africa
- 4.5. South Africa
- 4.6. Rest of Middle East & Africa
-
5. Asia Pacific
- 5.1. China
- 5.2. India
- 5.3. Japan
- 5.4. South Korea
- 5.5. ASEAN
- 5.6. Oceania
- 5.7. Rest of Asia Pacific
US Cookie Industry Regional Market Share
Geographic Coverage of US Cookie Industry
US Cookie Industry REPORT HIGHLIGHTS
| Aspects | Details |
|---|---|
| Study Period | 2020-2034 |
| Base Year | 2025 |
| Estimated Year | 2026 |
| Forecast Period | 2026-2034 |
| Historical Period | 2020-2025 |
| Growth Rate | CAGR of 3.38% from 2020-2034 |
| Segmentation |
|
Table of Contents
- 1. Introduction
- 1.1. Research Scope
- 1.2. Market Segmentation
- 1.3. Research Objective
- 1.4. Definitions and Assumptions
- 2. Executive Summary
- 2.1. Market Snapshot
- 3. Market Dynamics
- 3.1. Market Drivers
- 3.2. Market Restrains
- 3.3. Market Trends
- 3.4. Market Opportunities
- 4. Market Factor Analysis
- 4.1. Porters Five Forces
- 4.1.1. Bargaining Power of Suppliers
- 4.1.2. Bargaining Power of Buyers
- 4.1.3. Threat of New Entrants
- 4.1.4. Threat of Substitutes
- 4.1.5. Competitive Rivalry
- 4.2. PESTEL analysis
- 4.3. BCG Analysis
- 4.3.1. Stars (High Growth, High Market Share)
- 4.3.2. Cash Cows (Low Growth, High Market Share)
- 4.3.3. Question Mark (High Growth, Low Market Share)
- 4.3.4. Dogs (Low Growth, Low Market Share)
- 4.4. Ansoff Matrix Analysis
- 4.5. Supply Chain Analysis
- 4.6. Regulatory Landscape
- 4.7. Current Market Potential and Opportunity Assessment (TAM–SAM–SOM Framework)
- 4.8. RAX Analyst Note
- 4.1. Porters Five Forces
- 5. Market Analysis, Insights and Forecast 2021-2033
- 5.1. Market Analysis, Insights and Forecast - by Type
- 5.1.1. Filled Biscuits
- 5.1.2. Chocolate-coated Biscuits
- 5.1.3. Cookies
- 5.1.4. Sandwich Biscuits
- 5.1.5. Plain Biscuits
- 5.1.6. Other Types
- 5.2. Market Analysis, Insights and Forecast - by Category
- 5.2.1. Conventional
- 5.2.2. Better for You
- 5.2.2.1. Low Calorie
- 5.2.2.2. Cholesterol-free
- 5.2.2.3. Gluten-free
- 5.2.2.4. Organic
- 5.2.2.5. Other Categories
- 5.3. Market Analysis, Insights and Forecast - by Distribution Channel
- 5.3.1. Hypermarkets/Supermarkets
- 5.3.2. Convenience Stores
- 5.3.3. Specialist Retailers
- 5.3.4. Online Retailers
- 5.3.5. Other Distribution Channels
- 5.4. Market Analysis, Insights and Forecast - by Region
- 5.4.1. North America
- 5.4.2. South America
- 5.4.3. Europe
- 5.4.4. Middle East & Africa
- 5.4.5. Asia Pacific
- 5.1. Market Analysis, Insights and Forecast - by Type
- 6. Global US Cookie Industry Analysis, Insights and Forecast, 2021-2033
- 6.1. Market Analysis, Insights and Forecast - by Type
- 6.1.1. Filled Biscuits
- 6.1.2. Chocolate-coated Biscuits
- 6.1.3. Cookies
- 6.1.4. Sandwich Biscuits
- 6.1.5. Plain Biscuits
- 6.1.6. Other Types
- 6.2. Market Analysis, Insights and Forecast - by Category
- 6.2.1. Conventional
- 6.2.2. Better for You
- 6.2.2.1. Low Calorie
- 6.2.2.2. Cholesterol-free
- 6.2.2.3. Gluten-free
- 6.2.2.4. Organic
- 6.2.2.5. Other Categories
- 6.3. Market Analysis, Insights and Forecast - by Distribution Channel
- 6.3.1. Hypermarkets/Supermarkets
- 6.3.2. Convenience Stores
- 6.3.3. Specialist Retailers
- 6.3.4. Online Retailers
- 6.3.5. Other Distribution Channels
- 6.1. Market Analysis, Insights and Forecast - by Type
- 7. North America US Cookie Industry Analysis, Insights and Forecast, 2020-2032
- 7.1. Market Analysis, Insights and Forecast - by Type
- 7.1.1. Filled Biscuits
- 7.1.2. Chocolate-coated Biscuits
- 7.1.3. Cookies
- 7.1.4. Sandwich Biscuits
- 7.1.5. Plain Biscuits
- 7.1.6. Other Types
- 7.2. Market Analysis, Insights and Forecast - by Category
- 7.2.1. Conventional
- 7.2.2. Better for You
- 7.2.2.1. Low Calorie
- 7.2.2.2. Cholesterol-free
- 7.2.2.3. Gluten-free
- 7.2.2.4. Organic
- 7.2.2.5. Other Categories
- 7.3. Market Analysis, Insights and Forecast - by Distribution Channel
- 7.3.1. Hypermarkets/Supermarkets
- 7.3.2. Convenience Stores
- 7.3.3. Specialist Retailers
- 7.3.4. Online Retailers
- 7.3.5. Other Distribution Channels
- 7.1. Market Analysis, Insights and Forecast - by Type
- 8. South America US Cookie Industry Analysis, Insights and Forecast, 2020-2032
- 8.1. Market Analysis, Insights and Forecast - by Type
- 8.1.1. Filled Biscuits
- 8.1.2. Chocolate-coated Biscuits
- 8.1.3. Cookies
- 8.1.4. Sandwich Biscuits
- 8.1.5. Plain Biscuits
- 8.1.6. Other Types
- 8.2. Market Analysis, Insights and Forecast - by Category
- 8.2.1. Conventional
- 8.2.2. Better for You
- 8.2.2.1. Low Calorie
- 8.2.2.2. Cholesterol-free
- 8.2.2.3. Gluten-free
- 8.2.2.4. Organic
- 8.2.2.5. Other Categories
- 8.3. Market Analysis, Insights and Forecast - by Distribution Channel
- 8.3.1. Hypermarkets/Supermarkets
- 8.3.2. Convenience Stores
- 8.3.3. Specialist Retailers
- 8.3.4. Online Retailers
- 8.3.5. Other Distribution Channels
- 8.1. Market Analysis, Insights and Forecast - by Type
- 9. Europe US Cookie Industry Analysis, Insights and Forecast, 2020-2032
- 9.1. Market Analysis, Insights and Forecast - by Type
- 9.1.1. Filled Biscuits
- 9.1.2. Chocolate-coated Biscuits
- 9.1.3. Cookies
- 9.1.4. Sandwich Biscuits
- 9.1.5. Plain Biscuits
- 9.1.6. Other Types
- 9.2. Market Analysis, Insights and Forecast - by Category
- 9.2.1. Conventional
- 9.2.2. Better for You
- 9.2.2.1. Low Calorie
- 9.2.2.2. Cholesterol-free
- 9.2.2.3. Gluten-free
- 9.2.2.4. Organic
- 9.2.2.5. Other Categories
- 9.3. Market Analysis, Insights and Forecast - by Distribution Channel
- 9.3.1. Hypermarkets/Supermarkets
- 9.3.2. Convenience Stores
- 9.3.3. Specialist Retailers
- 9.3.4. Online Retailers
- 9.3.5. Other Distribution Channels
- 9.1. Market Analysis, Insights and Forecast - by Type
- 10. Middle East & Africa US Cookie Industry Analysis, Insights and Forecast, 2020-2032
- 10.1. Market Analysis, Insights and Forecast - by Type
- 10.1.1. Filled Biscuits
- 10.1.2. Chocolate-coated Biscuits
- 10.1.3. Cookies
- 10.1.4. Sandwich Biscuits
- 10.1.5. Plain Biscuits
- 10.1.6. Other Types
- 10.2. Market Analysis, Insights and Forecast - by Category
- 10.2.1. Conventional
- 10.2.2. Better for You
- 10.2.2.1. Low Calorie
- 10.2.2.2. Cholesterol-free
- 10.2.2.3. Gluten-free
- 10.2.2.4. Organic
- 10.2.2.5. Other Categories
- 10.3. Market Analysis, Insights and Forecast - by Distribution Channel
- 10.3.1. Hypermarkets/Supermarkets
- 10.3.2. Convenience Stores
- 10.3.3. Specialist Retailers
- 10.3.4. Online Retailers
- 10.3.5. Other Distribution Channels
- 10.1. Market Analysis, Insights and Forecast - by Type
- 11. Asia Pacific US Cookie Industry Analysis, Insights and Forecast, 2020-2032
- 11.1. Market Analysis, Insights and Forecast - by Type
- 11.1.1. Filled Biscuits
- 11.1.2. Chocolate-coated Biscuits
- 11.1.3. Cookies
- 11.1.4. Sandwich Biscuits
- 11.1.5. Plain Biscuits
- 11.1.6. Other Types
- 11.2. Market Analysis, Insights and Forecast - by Category
- 11.2.1. Conventional
- 11.2.2. Better for You
- 11.2.2.1. Low Calorie
- 11.2.2.2. Cholesterol-free
- 11.2.2.3. Gluten-free
- 11.2.2.4. Organic
- 11.2.2.5. Other Categories
- 11.3. Market Analysis, Insights and Forecast - by Distribution Channel
- 11.3.1. Hypermarkets/Supermarkets
- 11.3.2. Convenience Stores
- 11.3.3. Specialist Retailers
- 11.3.4. Online Retailers
- 11.3.5. Other Distribution Channels
- 11.1. Market Analysis, Insights and Forecast - by Type
- 12. Competitive Analysis
- 12.1. Company Profiles
- 12.1.1 Grupo Bimbo
- 12.1.1.1. Company Overview
- 12.1.1.2. Products
- 12.1.1.3. Company Financials
- 12.1.1.4. SWOT Analysis
- 12.1.2 Meiji Holdings Co Ltd
- 12.1.2.1. Company Overview
- 12.1.2.2. Products
- 12.1.2.3. Company Financials
- 12.1.2.4. SWOT Analysis
- 12.1.3 General Mills Inc
- 12.1.3.1. Company Overview
- 12.1.3.2. Products
- 12.1.3.3. Company Financials
- 12.1.3.4. SWOT Analysis
- 12.1.4 PepsiCo Inc
- 12.1.4.1. Company Overview
- 12.1.4.2. Products
- 12.1.4.3. Company Financials
- 12.1.4.4. SWOT Analysis
- 12.1.5 Mckee Foods Corporation
- 12.1.5.1. Company Overview
- 12.1.5.2. Products
- 12.1.5.3. Company Financials
- 12.1.5.4. SWOT Analysis
- 12.1.6 Ferrero Group
- 12.1.6.1. Company Overview
- 12.1.6.2. Products
- 12.1.6.3. Company Financials
- 12.1.6.4. SWOT Analysis
- 12.1.7 Hostess Brands LLC*List Not Exhaustive
- 12.1.7.1. Company Overview
- 12.1.7.2. Products
- 12.1.7.3. Company Financials
- 12.1.7.4. SWOT Analysis
- 12.1.8 Girl Scouts of the USA
- 12.1.8.1. Company Overview
- 12.1.8.2. Products
- 12.1.8.3. Company Financials
- 12.1.8.4. SWOT Analysis
- 12.1.9 Mondelez International Inc
- 12.1.9.1. Company Overview
- 12.1.9.2. Products
- 12.1.9.3. Company Financials
- 12.1.9.4. SWOT Analysis
- 12.1.10 Campbell Soup Company
- 12.1.10.1. Company Overview
- 12.1.10.2. Products
- 12.1.10.3. Company Financials
- 12.1.10.4. SWOT Analysis
- 12.1.1 Grupo Bimbo
- 12.2. Market Entropy
- 12.2.1 Company's Key Areas Served
- 12.2.2 Recent Developments
- 12.3. Company Market Share Analysis 2025
- 12.3.1 Top 5 Companies Market Share Analysis
- 12.3.2 Top 3 Companies Market Share Analysis
- 12.4. List of Potential Customers
- 13. Research Methodology
List of Figures
- Figure 1: Global US Cookie Industry Revenue Breakdown (Million, %) by Region 2025 & 2033
- Figure 2: North America US Cookie Industry Revenue (Million), by Type 2025 & 2033
- Figure 3: North America US Cookie Industry Revenue Share (%), by Type 2025 & 2033
- Figure 4: North America US Cookie Industry Revenue (Million), by Category 2025 & 2033
- Figure 5: North America US Cookie Industry Revenue Share (%), by Category 2025 & 2033
- Figure 6: North America US Cookie Industry Revenue (Million), by Distribution Channel 2025 & 2033
- Figure 7: North America US Cookie Industry Revenue Share (%), by Distribution Channel 2025 & 2033
- Figure 8: North America US Cookie Industry Revenue (Million), by Country 2025 & 2033
- Figure 9: North America US Cookie Industry Revenue Share (%), by Country 2025 & 2033
- Figure 10: South America US Cookie Industry Revenue (Million), by Type 2025 & 2033
- Figure 11: South America US Cookie Industry Revenue Share (%), by Type 2025 & 2033
- Figure 12: South America US Cookie Industry Revenue (Million), by Category 2025 & 2033
- Figure 13: South America US Cookie Industry Revenue Share (%), by Category 2025 & 2033
- Figure 14: South America US Cookie Industry Revenue (Million), by Distribution Channel 2025 & 2033
- Figure 15: South America US Cookie Industry Revenue Share (%), by Distribution Channel 2025 & 2033
- Figure 16: South America US Cookie Industry Revenue (Million), by Country 2025 & 2033
- Figure 17: South America US Cookie Industry Revenue Share (%), by Country 2025 & 2033
- Figure 18: Europe US Cookie Industry Revenue (Million), by Type 2025 & 2033
- Figure 19: Europe US Cookie Industry Revenue Share (%), by Type 2025 & 2033
- Figure 20: Europe US Cookie Industry Revenue (Million), by Category 2025 & 2033
- Figure 21: Europe US Cookie Industry Revenue Share (%), by Category 2025 & 2033
- Figure 22: Europe US Cookie Industry Revenue (Million), by Distribution Channel 2025 & 2033
- Figure 23: Europe US Cookie Industry Revenue Share (%), by Distribution Channel 2025 & 2033
- Figure 24: Europe US Cookie Industry Revenue (Million), by Country 2025 & 2033
- Figure 25: Europe US Cookie Industry Revenue Share (%), by Country 2025 & 2033
- Figure 26: Middle East & Africa US Cookie Industry Revenue (Million), by Type 2025 & 2033
- Figure 27: Middle East & Africa US Cookie Industry Revenue Share (%), by Type 2025 & 2033
- Figure 28: Middle East & Africa US Cookie Industry Revenue (Million), by Category 2025 & 2033
- Figure 29: Middle East & Africa US Cookie Industry Revenue Share (%), by Category 2025 & 2033
- Figure 30: Middle East & Africa US Cookie Industry Revenue (Million), by Distribution Channel 2025 & 2033
- Figure 31: Middle East & Africa US Cookie Industry Revenue Share (%), by Distribution Channel 2025 & 2033
- Figure 32: Middle East & Africa US Cookie Industry Revenue (Million), by Country 2025 & 2033
- Figure 33: Middle East & Africa US Cookie Industry Revenue Share (%), by Country 2025 & 2033
- Figure 34: Asia Pacific US Cookie Industry Revenue (Million), by Type 2025 & 2033
- Figure 35: Asia Pacific US Cookie Industry Revenue Share (%), by Type 2025 & 2033
- Figure 36: Asia Pacific US Cookie Industry Revenue (Million), by Category 2025 & 2033
- Figure 37: Asia Pacific US Cookie Industry Revenue Share (%), by Category 2025 & 2033
- Figure 38: Asia Pacific US Cookie Industry Revenue (Million), by Distribution Channel 2025 & 2033
- Figure 39: Asia Pacific US Cookie Industry Revenue Share (%), by Distribution Channel 2025 & 2033
- Figure 40: Asia Pacific US Cookie Industry Revenue (Million), by Country 2025 & 2033
- Figure 41: Asia Pacific US Cookie Industry Revenue Share (%), by Country 2025 & 2033
List of Tables
- Table 1: Global US Cookie Industry Revenue Million Forecast, by Type 2020 & 2033
- Table 2: Global US Cookie Industry Revenue Million Forecast, by Category 2020 & 2033
- Table 3: Global US Cookie Industry Revenue Million Forecast, by Distribution Channel 2020 & 2033
- Table 4: Global US Cookie Industry Revenue Million Forecast, by Region 2020 & 2033
- Table 5: Global US Cookie Industry Revenue Million Forecast, by Type 2020 & 2033
- Table 6: Global US Cookie Industry Revenue Million Forecast, by Category 2020 & 2033
- Table 7: Global US Cookie Industry Revenue Million Forecast, by Distribution Channel 2020 & 2033
- Table 8: Global US Cookie Industry Revenue Million Forecast, by Country 2020 & 2033
- Table 9: United States US Cookie Industry Revenue (Million) Forecast, by Application 2020 & 2033
- Table 10: Canada US Cookie Industry Revenue (Million) Forecast, by Application 2020 & 2033
- Table 11: Mexico US Cookie Industry Revenue (Million) Forecast, by Application 2020 & 2033
- Table 12: Global US Cookie Industry Revenue Million Forecast, by Type 2020 & 2033
- Table 13: Global US Cookie Industry Revenue Million Forecast, by Category 2020 & 2033
- Table 14: Global US Cookie Industry Revenue Million Forecast, by Distribution Channel 2020 & 2033
- Table 15: Global US Cookie Industry Revenue Million Forecast, by Country 2020 & 2033
- Table 16: Brazil US Cookie Industry Revenue (Million) Forecast, by Application 2020 & 2033
- Table 17: Argentina US Cookie Industry Revenue (Million) Forecast, by Application 2020 & 2033
- Table 18: Rest of South America US Cookie Industry Revenue (Million) Forecast, by Application 2020 & 2033
- Table 19: Global US Cookie Industry Revenue Million Forecast, by Type 2020 & 2033
- Table 20: Global US Cookie Industry Revenue Million Forecast, by Category 2020 & 2033
- Table 21: Global US Cookie Industry Revenue Million Forecast, by Distribution Channel 2020 & 2033
- Table 22: Global US Cookie Industry Revenue Million Forecast, by Country 2020 & 2033
- Table 23: United Kingdom US Cookie Industry Revenue (Million) Forecast, by Application 2020 & 2033
- Table 24: Germany US Cookie Industry Revenue (Million) Forecast, by Application 2020 & 2033
- Table 25: France US Cookie Industry Revenue (Million) Forecast, by Application 2020 & 2033
- Table 26: Italy US Cookie Industry Revenue (Million) Forecast, by Application 2020 & 2033
- Table 27: Spain US Cookie Industry Revenue (Million) Forecast, by Application 2020 & 2033
- Table 28: Russia US Cookie Industry Revenue (Million) Forecast, by Application 2020 & 2033
- Table 29: Benelux US Cookie Industry Revenue (Million) Forecast, by Application 2020 & 2033
- Table 30: Nordics US Cookie Industry Revenue (Million) Forecast, by Application 2020 & 2033
- Table 31: Rest of Europe US Cookie Industry Revenue (Million) Forecast, by Application 2020 & 2033
- Table 32: Global US Cookie Industry Revenue Million Forecast, by Type 2020 & 2033
- Table 33: Global US Cookie Industry Revenue Million Forecast, by Category 2020 & 2033
- Table 34: Global US Cookie Industry Revenue Million Forecast, by Distribution Channel 2020 & 2033
- Table 35: Global US Cookie Industry Revenue Million Forecast, by Country 2020 & 2033
- Table 36: Turkey US Cookie Industry Revenue (Million) Forecast, by Application 2020 & 2033
- Table 37: Israel US Cookie Industry Revenue (Million) Forecast, by Application 2020 & 2033
- Table 38: GCC US Cookie Industry Revenue (Million) Forecast, by Application 2020 & 2033
- Table 39: North Africa US Cookie Industry Revenue (Million) Forecast, by Application 2020 & 2033
- Table 40: South Africa US Cookie Industry Revenue (Million) Forecast, by Application 2020 & 2033
- Table 41: Rest of Middle East & Africa US Cookie Industry Revenue (Million) Forecast, by Application 2020 & 2033
- Table 42: Global US Cookie Industry Revenue Million Forecast, by Type 2020 & 2033
- Table 43: Global US Cookie Industry Revenue Million Forecast, by Category 2020 & 2033
- Table 44: Global US Cookie Industry Revenue Million Forecast, by Distribution Channel 2020 & 2033
- Table 45: Global US Cookie Industry Revenue Million Forecast, by Country 2020 & 2033
- Table 46: China US Cookie Industry Revenue (Million) Forecast, by Application 2020 & 2033
- Table 47: India US Cookie Industry Revenue (Million) Forecast, by Application 2020 & 2033
- Table 48: Japan US Cookie Industry Revenue (Million) Forecast, by Application 2020 & 2033
- Table 49: South Korea US Cookie Industry Revenue (Million) Forecast, by Application 2020 & 2033
- Table 50: ASEAN US Cookie Industry Revenue (Million) Forecast, by Application 2020 & 2033
- Table 51: Oceania US Cookie Industry Revenue (Million) Forecast, by Application 2020 & 2033
- Table 52: Rest of Asia Pacific US Cookie Industry Revenue (Million) Forecast, by Application 2020 & 2033
Frequently Asked Questions
1. What is the projected Compound Annual Growth Rate (CAGR) of the US Cookie Industry?
The projected CAGR is approximately 3.38%.
2. Which companies are prominent players in the US Cookie Industry?
Key companies in the market include Grupo Bimbo, Meiji Holdings Co Ltd, General Mills Inc, PepsiCo Inc, Mckee Foods Corporation, Ferrero Group, Hostess Brands LLC*List Not Exhaustive, Girl Scouts of the USA, Mondelez International Inc, Campbell Soup Company.
3. What are the main segments of the US Cookie Industry?
The market segments include Type, Category, Distribution Channel.
4. Can you provide details about the market size?
The market size is estimated to be USD 12.48 Million as of 2022.
5. What are some drivers contributing to market growth?
Innovation in Vanillin Synthesis; Diverse Functionality of Vanillin In End-use Industries.
6. What are the notable trends driving market growth?
Increasing Demand for Innovative and Creative Cookies.
7. Are there any restraints impacting market growth?
Supply Chain Variability Impacting Vanilla Bean Availability For Flavor Production.
8. Can you provide examples of recent developments in the market?
JUL 2022: The Greater Goods Snacking Company, a snack brand focusing on better-for-you snacks, launched three different product lines in the United States, i.e., crackers, cookies, and biscotti.
9. What pricing options are available for accessing the report?
Pricing options include single-user, multi-user, and enterprise licenses priced at USD 3800, USD 4500, and USD 5800 respectively.
10. Is the market size provided in terms of value or volume?
The market size is provided in terms of value, measured in Million.
11. Are there any specific market keywords associated with the report?
Yes, the market keyword associated with the report is "US Cookie Industry," which aids in identifying and referencing the specific market segment covered.
12. How do I determine which pricing option suits my needs best?
The pricing options vary based on user requirements and access needs. Individual users may opt for single-user licenses, while businesses requiring broader access may choose multi-user or enterprise licenses for cost-effective access to the report.
13. Are there any additional resources or data provided in the US Cookie Industry report?
While the report offers comprehensive insights, it's advisable to review the specific contents or supplementary materials provided to ascertain if additional resources or data are available.
14. How can I stay updated on further developments or reports in the US Cookie Industry?
To stay informed about further developments, trends, and reports in the US Cookie Industry, consider subscribing to industry newsletters, following relevant companies and organizations, or regularly checking reputable industry news sources and publications.
Methodology
Step 1 - Identification of Relevant Samples Size from Population Database


Step 2 - Approaches for Defining Global Market Size (Value, Volume* & Price*)

Note*: In applicable scenarios
Step 3 - Data Sources
Primary Research
- Web Analytics
- Survey Reports
- Research Institute
- Latest Research Reports
- Opinion Leaders
Secondary Research
- Annual Reports
- White Paper
- Latest Press Release
- Industry Association
- Paid Database
- Investor Presentations

Step 4 - Data Triangulation
Involves using different sources of information in order to increase the validity of a study
These sources are likely to be stakeholders in a program - participants, other researchers, program staff, other community members, and so on.
Then we put all data in single framework & apply various statistical tools to find out the dynamic on the market.
During the analysis stage, feedback from the stakeholder groups would be compared to determine areas of agreement as well as areas of divergence

