

Key Insights
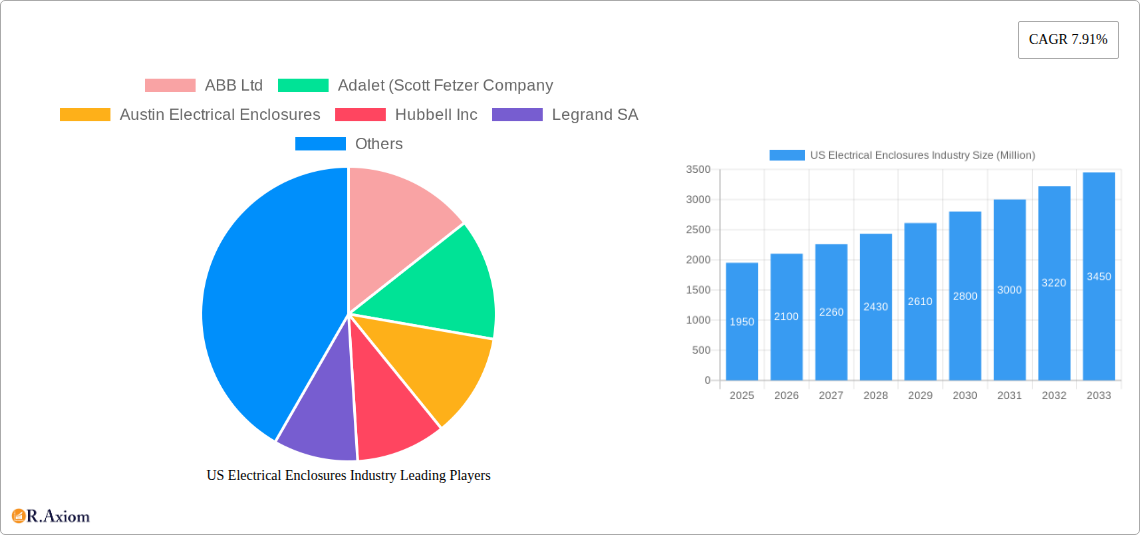
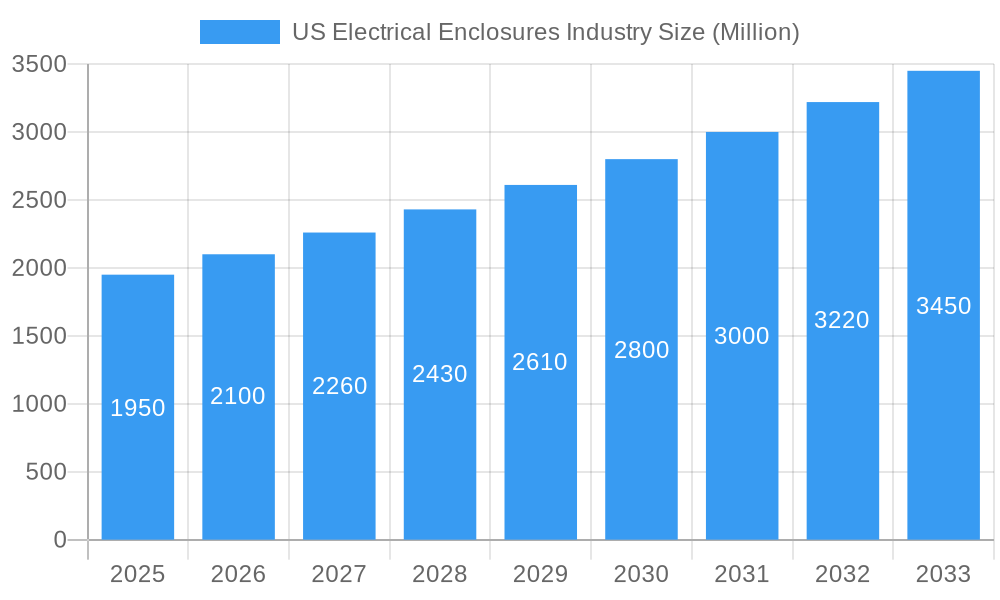
The US electrical enclosures market is poised for significant expansion, projected to reach an estimated value of $1.95 billion by 2025. This growth is fueled by a robust Compound Annual Growth Rate (CAGR) of 7.91%, indicating a dynamic and thriving industry. Key drivers for this surge include the escalating demand for reliable power infrastructure, particularly in the power generation and distribution sector, which requires robust and secure enclosure solutions. The ongoing modernization and expansion of electrical grids, coupled with the increasing adoption of renewable energy sources, necessitate advanced enclosure systems that can withstand harsh environments and ensure operational safety. Furthermore, the growing emphasis on industrial automation and smart manufacturing across sectors like oil and gas, metal and mining, and process industries is a critical growth stimulant. These sectors rely heavily on sophisticated electrical control systems, all of which are housed within protective enclosures designed for durability and performance.
US Electrical Enclosures Industry Market Size (In Billion)
The market's trajectory is also shaped by evolving trends in material innovation and application diversification. While metallic enclosures remain a dominant segment due to their inherent strength and durability, the increasing use of advanced non-metallic materials is gaining traction, offering advantages in terms of corrosion resistance and lighter weight for certain applications. The transportation sector, with its electrification initiatives and growing need for robust electrical management systems in vehicles and infrastructure, presents a promising avenue for growth. Commercial spaces and buildings are also contributing to market expansion, driven by smart building technologies, increased electrical loads from data centers and advanced HVAC systems, and the need for aesthetically pleasing yet highly functional enclosure solutions. Residential applications, while currently a smaller segment, are expected to witness steady growth with the rise of smart home technologies and increased electrical density. Despite the positive outlook, potential restraints such as fluctuating raw material prices and the complexity of regulatory compliance could present challenges to sustained growth, requiring manufacturers to focus on efficient supply chain management and adherence to evolving standards.
US Electrical Enclosures Industry Company Market Share
Here is a detailed SEO-optimized report description for the US Electrical Enclosures Industry, designed for immediate use without further modification.
US Electrical Enclosures Industry Market Concentration & Innovation
The US electrical enclosures market exhibits a moderate to high degree of market concentration, driven by the presence of large multinational corporations alongside specialized regional players. Innovation is a critical differentiator, with companies actively investing in R&D to develop smart enclosures, advanced materials, and solutions that cater to evolving industry needs such as increased power density and environmental resilience. Regulatory frameworks, including NEC (National Electrical Code) and UL standards, play a significant role in shaping product development and market access. The threat of product substitutes, while present in the form of modular solutions or integrated systems, is generally mitigated by the fundamental need for protective and organized electrical infrastructure. End-user trends, such as the growing demand for automation, digitalization, and sustainable energy solutions, are pushing manufacturers to innovate. Mergers and acquisitions (M&A) activities are a notable feature, with major players acquiring smaller, specialized companies to expand their product portfolios and geographic reach. For instance, M&A deal values are anticipated to reach several hundred million dollars annually, reflecting strategic consolidation and the pursuit of market leadership.
- Market Share: Leading players like Schneider Electric, Siemens AG, and Eaton Corporation hold substantial market shares, estimated to be between 15% and 25% individually.
- M&A Deal Values: Significant M&A activities are projected, with aggregate deal values expected to reach approximately USD 500 Million annually, driven by strategic market consolidation.
- Innovation Drivers: Smart enclosure technology, advanced material science, cybersecurity integration, and compliance with evolving safety standards.
US Electrical Enclosures Industry Industry Trends & Insights
The US electrical enclosures market is poised for robust growth, fueled by several interconnected trends. A significant driver is the continuous expansion and modernization of the nation's power generation and distribution infrastructure, necessitating a steady demand for reliable and advanced electrical enclosures. Furthermore, the increasing adoption of renewable energy sources, such as solar and wind power, requires specialized enclosures designed for harsh environments and advanced monitoring capabilities. The surge in data center construction and the proliferation of IoT devices are also creating substantial demand for high-density, thermally managed enclosures. In the industrial sector, automation and Industry 4.0 initiatives are driving the need for enclosures that can house complex control systems and facilitate seamless integration with networked machinery. The residential and commercial construction sectors, while subject to economic fluctuations, continue to represent a significant market due to ongoing development and renovation projects. Technological advancements are at the forefront, with a notable shift towards smart enclosures equipped with sensors for environmental monitoring, predictive maintenance, and remote access. The development of advanced materials, including corrosion-resistant alloys and high-performance polymers, is enhancing the durability and lifespan of enclosures, particularly in challenging applications like oil and gas. Competitive dynamics are characterized by intense price competition in standard product segments, while innovation and customization drive higher margins in specialized applications. The market penetration of advanced enclosure solutions is projected to increase significantly, driven by the perceived value in improved operational efficiency, reduced downtime, and enhanced safety. The estimated Compound Annual Growth Rate (CAGR) for the US electrical enclosures industry is approximately 6.5% for the forecast period of 2025–2033.
Dominant Markets & Segments in US Electrical Enclosures Industry
The US electrical enclosures industry demonstrates distinct dominance across various segments, reflecting the nation's economic and infrastructural landscape.
- Leading Region/Country: The United States itself represents the dominant market, driven by its extensive industrial base, aging infrastructure requiring upgrades, and significant investments in new construction and energy projects.
- Material Type Dominance: Metallic enclosures, particularly those made from steel and aluminum, continue to dominate due to their superior strength, durability, and cost-effectiveness for a wide range of applications. However, non-metallic enclosures are witnessing strong growth, especially in corrosive environments and for specific applications requiring electrical insulation and weight reduction.
- Application Dominance:
- Power Generation and Distribution: This segment is a powerhouse, driven by the need to protect critical electrical infrastructure, including substations, transmission lines, and renewable energy installations. Significant investments in grid modernization and renewable energy integration bolster this segment.
- Industrial: This broad segment encompasses manufacturing, process industries, and mining, all of which rely heavily on robust enclosures for housing machinery controls, power distribution units, and automation systems. The push for automation and smart manufacturing further fuels demand.
- Commercial Spaces and Buildings: This segment includes office buildings, retail spaces, and healthcare facilities, where electrical enclosures are essential for power distribution, lighting control, and HVAC systems. The growth in smart building technologies contributes to this segment's expansion.
- End-User Dominance:
- Industrial: This remains the largest end-user segment due to the sheer volume of manufacturing facilities, processing plants, and heavy industries that require electrical enclosures.
- Commercial: The expanding commercial real estate sector and the integration of advanced building management systems make this a significant and growing end-user.
Key drivers for this dominance include substantial government infrastructure spending, private sector investment in industrial automation, the ongoing energy transition, and stringent safety regulations that mandate the use of protective enclosures. The economic policies supporting domestic manufacturing and the continuous development of smart grid technologies also play a crucial role in shaping these dominant segments.
US Electrical Enclosures Industry Product Developments
Product developments in the US electrical enclosures market are characterized by an emphasis on enhanced functionality, connectivity, and sustainability. Manufacturers are increasingly integrating smart features, such as embedded sensors for temperature, humidity, and vibration monitoring, enabling predictive maintenance and reducing downtime. Advanced materials are being employed to improve resistance to harsh environmental conditions, corrosion, and impact, extending product lifespan. The trend towards modular designs and customizable solutions allows for greater flexibility and faster deployment in diverse applications. Cybersecurity features are also being incorporated into smart enclosures to protect sensitive control systems from external threats. These innovations offer competitive advantages by addressing critical end-user needs for reliability, efficiency, and safety in an increasingly complex electrical landscape.
Report Scope & Segmentation Analysis
This report provides a comprehensive analysis of the US electrical enclosures market, segmented by material type, application, and end-user.
- Material Type: The market is analyzed across Metallic and Non-metallic enclosures. Metallic enclosures, favored for their robustness, are expected to maintain a strong market share. Non-metallic enclosures are projected to experience higher growth due to their suitability for corrosive environments and applications requiring electrical insulation.
- Application: Key applications covered include Power Generation and Distribution, Metal and Mining, Transportation, Oil and Gas, Commercial Spaces and Buildings, Process Industries, and Other Applications. The Power Generation and Distribution segment, driven by infrastructure upgrades, is anticipated to lead in market size.
- End-User: The analysis covers Industrial, Commercial, and Residential end-users. The Industrial segment is projected to dominate in terms of market size, owing to extensive manufacturing and processing activities. The Commercial segment is expected to exhibit robust growth driven by new construction and smart building initiatives.
The market size for each segment is projected to grow, with specific CAGRs varying based on underlying demand drivers and technological adoption rates. Competitive dynamics within each segment will be shaped by product innovation, pricing strategies, and the ability to cater to specific industry requirements.
Key Drivers of US Electrical Enclosures Industry Growth
The US electrical enclosures industry's growth is propelled by a confluence of technological advancements, economic stimulus, and evolving regulatory demands. The ongoing expansion and modernization of electrical infrastructure, particularly in the power generation and distribution sectors, are fundamental drivers. Increased investment in renewable energy projects, coupled with the need for robust enclosures to house associated equipment, significantly boosts demand. The accelerating adoption of automation and Industry 4.0 principles across manufacturing and process industries necessitates sophisticated enclosures for control systems and smart machinery. Furthermore, government initiatives aimed at infrastructure development and energy efficiency contribute to market expansion. The increasing prevalence of smart buildings and data centers, requiring advanced thermal management and high-density solutions, also fuels growth.
- Infrastructure Modernization: Significant investments in upgrading aging power grids and expanding transmission capacity.
- Renewable Energy Growth: The expanding solar, wind, and other renewable energy sectors require specialized and durable enclosures.
- Industrial Automation & IoT: The drive towards smart manufacturing and the proliferation of connected devices in industrial settings.
- Government Initiatives: Infrastructure spending bills and policies promoting energy efficiency and domestic manufacturing.
Challenges in the US Electrical Enclosures Industry Sector
Despite robust growth prospects, the US electrical enclosures industry faces several challenges that can impede its full potential. Intense competition, particularly in the commoditized segments of the market, exerts downward pressure on profit margins. Supply chain disruptions, including raw material price volatility and availability issues, can lead to production delays and increased costs. Stringent and evolving safety and environmental regulations, while crucial for product quality, can also increase compliance costs and necessitate significant R&D investment for manufacturers. The high initial capital expenditure required for advanced manufacturing facilities and specialized tooling can act as a barrier to entry for smaller players. Furthermore, the threat of obsolescence due to rapid technological advancements requires continuous innovation and product updates, which can be resource-intensive.
- Intense Competition: Price wars in standard enclosure segments impacting profitability.
- Supply Chain Volatility: Fluctuations in raw material prices (e.g., steel, aluminum) and potential shortages.
- Regulatory Compliance Costs: The expense and complexity of meeting evolving safety and environmental standards.
- Rapid Technological Advancements: The need for continuous investment in R&D to stay competitive.
Emerging Opportunities in US Electrical Enclosures Industry
The US electrical enclosures market is ripe with emerging opportunities driven by technological innovation and evolving industry needs. The burgeoning smart grid initiatives present a significant avenue for growth, requiring enclosures designed for advanced metering infrastructure and distributed energy resources. The expansion of electric vehicle (EV) charging infrastructure creates demand for specialized enclosures for charging stations and battery management systems. The increasing focus on data security and cybersecurity within industrial control systems opens doors for manufacturers offering enclosures with enhanced tamper-proofing and integrated security features. The growing demand for sustainable and energy-efficient buildings is also driving the need for enclosures that can accommodate advanced building management systems and renewable energy integration. Furthermore, the rise of modular construction and prefabricated electrical systems offers opportunities for manufacturers capable of providing integrated enclosure solutions.
- Smart Grid Integration: Enclosures for smart meters, distributed energy resource management, and grid modernization.
- Electric Vehicle Infrastructure: Demand for enclosures for EV charging stations and related power electronics.
- Enhanced Cybersecurity: Opportunities for enclosures with integrated security features for critical infrastructure.
- Sustainable Building Solutions: Enclosures for advanced building automation and energy-efficient systems.
Leading Players in the US Electrical Enclosures Industry Market
- ABB Ltd
- Adalet (Scott Fetzer Company)
- Austin Electrical Enclosures
- Hubbell Inc
- Legrand SA
- Emerson Electric Co
- Siemens AG
- Schneider Electric SE
- Rittal GmbH & Co Kg
- AZZ Inc
- Nvent Electric PLC
- Hammond Manufacturing Ltd
- Eaton Corporation
Key Developments in US Electrical Enclosures Industry Industry
- August 2021 - Hammond Manufacturing Ltd announced a USD 24 million expansion to provide more painting and metal fabrication capacity. The new 96,000-sq. Ft facility is scheduled to be operational by the end of 2022. The company manufactures electronic and electrical products, including metallic and non-metallic enclosures, racks, small cases, outlet strips, surge suppressors, and electronic transformers. This development indicates a strategic move to increase production capacity and meet growing demand.
- March 2021 - Hubbell Control Solutions in South Carolina, the United States, announced the release of a new and improved NX Distributed Intelligence Lighting Control Panel (NXP2 Series) that centralizes connection points in an enclosure providing a solution that reduces time and costs to deploy code-compliant lighting control. It comes with surface mount and flushes mount enclosure options. This product launch highlights innovation in smart control solutions and ease of installation within enclosures.
Strategic Outlook for US Electrical Enclosures Industry Market
The strategic outlook for the US electrical enclosures industry remains highly positive, driven by sustained demand from critical sectors and ongoing technological advancements. The industry will continue to benefit from the robust investments in power infrastructure, renewable energy integration, and the widespread adoption of automation and smart technologies. Manufacturers focusing on innovation in smart enclosures, advanced materials, and customized solutions will likely gain a competitive edge. Strategic partnerships and acquisitions will continue to shape the market landscape, enabling companies to expand their product portfolios and market reach. Addressing supply chain resilience and adapting to evolving regulatory requirements will be crucial for long-term success. The industry is well-positioned to capitalize on the ongoing digital transformation across all end-user segments, ensuring sustained growth and development.
US Electrical Enclosures Industry Segmentation
-
1. Material Type
- 1.1. Metallic
- 1.2. Non-metallic
-
2. Application
- 2.1. Power Generation and Distribution
- 2.2. Metal and Mining
- 2.3. Transportation
- 2.4. Oil and Gas
- 2.5. Commercial Spaces and Buildings
- 2.6. Process Industries
- 2.7. Other Applications
-
3. End-User
- 3.1. Industrial
- 3.2. Commercial
- 3.3. Residential
US Electrical Enclosures Industry Segmentation By Geography
-
1. North America
- 1.1. United States
- 1.2. Canada
- 1.3. Mexico
-
2. South America
- 2.1. Brazil
- 2.2. Argentina
- 2.3. Rest of South America
-
3. Europe
- 3.1. United Kingdom
- 3.2. Germany
- 3.3. France
- 3.4. Italy
- 3.5. Spain
- 3.6. Russia
- 3.7. Benelux
- 3.8. Nordics
- 3.9. Rest of Europe
-
4. Middle East & Africa
- 4.1. Turkey
- 4.2. Israel
- 4.3. GCC
- 4.4. North Africa
- 4.5. South Africa
- 4.6. Rest of Middle East & Africa
-
5. Asia Pacific
- 5.1. China
- 5.2. India
- 5.3. Japan
- 5.4. South Korea
- 5.5. ASEAN
- 5.6. Oceania
- 5.7. Rest of Asia Pacific
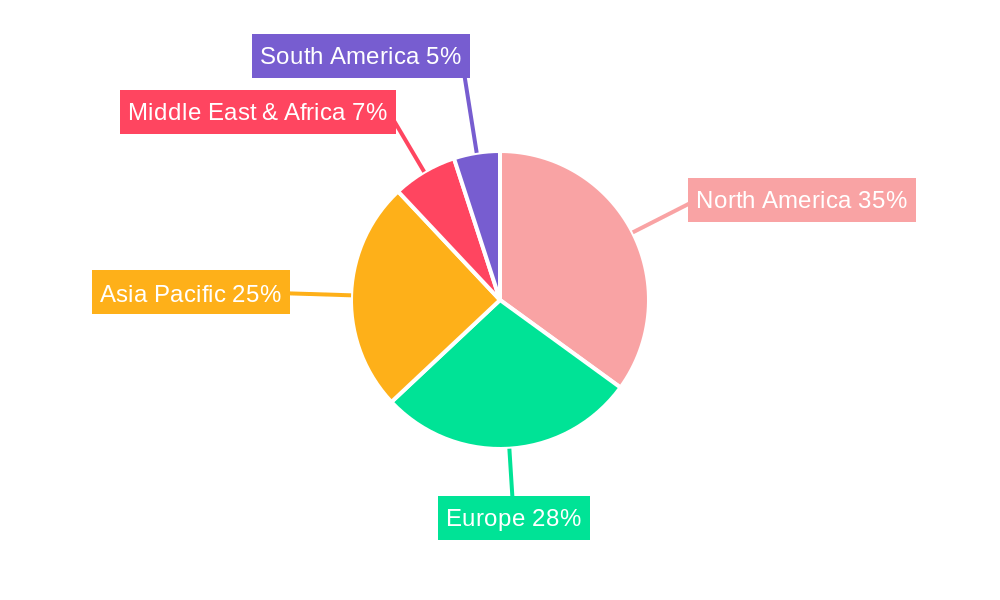
US Electrical Enclosures Industry Regional Market Share
Geographic Coverage of US Electrical Enclosures Industry
US Electrical Enclosures Industry REPORT HIGHLIGHTS
| Aspects | Details |
|---|---|
| Study Period | 2020-2034 |
| Base Year | 2025 |
| Estimated Year | 2026 |
| Forecast Period | 2026-2034 |
| Historical Period | 2020-2025 |
| Growth Rate | CAGR of 7.91% from 2020-2034 |
| Segmentation |
|
Table of Contents
- 1. Introduction
- 1.1. Research Scope
- 1.2. Market Segmentation
- 1.3. Research Objective
- 1.4. Definitions and Assumptions
- 2. Executive Summary
- 2.1. Market Snapshot
- 3. Market Dynamics
- 3.1. Market Drivers
- 3.2. Market Restrains
- 3.3. Market Trends
- 3.4. Market Opportunities
- 4. Market Factor Analysis
- 4.1. Porters Five Forces
- 4.1.1. Bargaining Power of Suppliers
- 4.1.2. Bargaining Power of Buyers
- 4.1.3. Threat of New Entrants
- 4.1.4. Threat of Substitutes
- 4.1.5. Competitive Rivalry
- 4.2. PESTEL analysis
- 4.3. BCG Analysis
- 4.3.1. Stars (High Growth, High Market Share)
- 4.3.2. Cash Cows (Low Growth, High Market Share)
- 4.3.3. Question Mark (High Growth, Low Market Share)
- 4.3.4. Dogs (Low Growth, Low Market Share)
- 4.4. Ansoff Matrix Analysis
- 4.5. Supply Chain Analysis
- 4.6. Regulatory Landscape
- 4.7. Current Market Potential and Opportunity Assessment (TAM–SAM–SOM Framework)
- 4.8. RAX Analyst Note
- 4.1. Porters Five Forces
- 5. Market Analysis, Insights and Forecast 2021-2033
- 5.1. Market Analysis, Insights and Forecast - by Material Type
- 5.1.1. Metallic
- 5.1.2. Non-metallic
- 5.2. Market Analysis, Insights and Forecast - by Application
- 5.2.1. Power Generation and Distribution
- 5.2.2. Metal and Mining
- 5.2.3. Transportation
- 5.2.4. Oil and Gas
- 5.2.5. Commercial Spaces and Buildings
- 5.2.6. Process Industries
- 5.2.7. Other Applications
- 5.3. Market Analysis, Insights and Forecast - by End-User
- 5.3.1. Industrial
- 5.3.2. Commercial
- 5.3.3. Residential
- 5.4. Market Analysis, Insights and Forecast - by Region
- 5.4.1. North America
- 5.4.2. South America
- 5.4.3. Europe
- 5.4.4. Middle East & Africa
- 5.4.5. Asia Pacific
- 5.1. Market Analysis, Insights and Forecast - by Material Type
- 6. Global US Electrical Enclosures Industry Analysis, Insights and Forecast, 2021-2033
- 6.1. Market Analysis, Insights and Forecast - by Material Type
- 6.1.1. Metallic
- 6.1.2. Non-metallic
- 6.2. Market Analysis, Insights and Forecast - by Application
- 6.2.1. Power Generation and Distribution
- 6.2.2. Metal and Mining
- 6.2.3. Transportation
- 6.2.4. Oil and Gas
- 6.2.5. Commercial Spaces and Buildings
- 6.2.6. Process Industries
- 6.2.7. Other Applications
- 6.3. Market Analysis, Insights and Forecast - by End-User
- 6.3.1. Industrial
- 6.3.2. Commercial
- 6.3.3. Residential
- 6.1. Market Analysis, Insights and Forecast - by Material Type
- 7. North America US Electrical Enclosures Industry Analysis, Insights and Forecast, 2020-2032
- 7.1. Market Analysis, Insights and Forecast - by Material Type
- 7.1.1. Metallic
- 7.1.2. Non-metallic
- 7.2. Market Analysis, Insights and Forecast - by Application
- 7.2.1. Power Generation and Distribution
- 7.2.2. Metal and Mining
- 7.2.3. Transportation
- 7.2.4. Oil and Gas
- 7.2.5. Commercial Spaces and Buildings
- 7.2.6. Process Industries
- 7.2.7. Other Applications
- 7.3. Market Analysis, Insights and Forecast - by End-User
- 7.3.1. Industrial
- 7.3.2. Commercial
- 7.3.3. Residential
- 7.1. Market Analysis, Insights and Forecast - by Material Type
- 8. South America US Electrical Enclosures Industry Analysis, Insights and Forecast, 2020-2032
- 8.1. Market Analysis, Insights and Forecast - by Material Type
- 8.1.1. Metallic
- 8.1.2. Non-metallic
- 8.2. Market Analysis, Insights and Forecast - by Application
- 8.2.1. Power Generation and Distribution
- 8.2.2. Metal and Mining
- 8.2.3. Transportation
- 8.2.4. Oil and Gas
- 8.2.5. Commercial Spaces and Buildings
- 8.2.6. Process Industries
- 8.2.7. Other Applications
- 8.3. Market Analysis, Insights and Forecast - by End-User
- 8.3.1. Industrial
- 8.3.2. Commercial
- 8.3.3. Residential
- 8.1. Market Analysis, Insights and Forecast - by Material Type
- 9. Europe US Electrical Enclosures Industry Analysis, Insights and Forecast, 2020-2032
- 9.1. Market Analysis, Insights and Forecast - by Material Type
- 9.1.1. Metallic
- 9.1.2. Non-metallic
- 9.2. Market Analysis, Insights and Forecast - by Application
- 9.2.1. Power Generation and Distribution
- 9.2.2. Metal and Mining
- 9.2.3. Transportation
- 9.2.4. Oil and Gas
- 9.2.5. Commercial Spaces and Buildings
- 9.2.6. Process Industries
- 9.2.7. Other Applications
- 9.3. Market Analysis, Insights and Forecast - by End-User
- 9.3.1. Industrial
- 9.3.2. Commercial
- 9.3.3. Residential
- 9.1. Market Analysis, Insights and Forecast - by Material Type
- 10. Middle East & Africa US Electrical Enclosures Industry Analysis, Insights and Forecast, 2020-2032
- 10.1. Market Analysis, Insights and Forecast - by Material Type
- 10.1.1. Metallic
- 10.1.2. Non-metallic
- 10.2. Market Analysis, Insights and Forecast - by Application
- 10.2.1. Power Generation and Distribution
- 10.2.2. Metal and Mining
- 10.2.3. Transportation
- 10.2.4. Oil and Gas
- 10.2.5. Commercial Spaces and Buildings
- 10.2.6. Process Industries
- 10.2.7. Other Applications
- 10.3. Market Analysis, Insights and Forecast - by End-User
- 10.3.1. Industrial
- 10.3.2. Commercial
- 10.3.3. Residential
- 10.1. Market Analysis, Insights and Forecast - by Material Type
- 11. Asia Pacific US Electrical Enclosures Industry Analysis, Insights and Forecast, 2020-2032
- 11.1. Market Analysis, Insights and Forecast - by Material Type
- 11.1.1. Metallic
- 11.1.2. Non-metallic
- 11.2. Market Analysis, Insights and Forecast - by Application
- 11.2.1. Power Generation and Distribution
- 11.2.2. Metal and Mining
- 11.2.3. Transportation
- 11.2.4. Oil and Gas
- 11.2.5. Commercial Spaces and Buildings
- 11.2.6. Process Industries
- 11.2.7. Other Applications
- 11.3. Market Analysis, Insights and Forecast - by End-User
- 11.3.1. Industrial
- 11.3.2. Commercial
- 11.3.3. Residential
- 11.1. Market Analysis, Insights and Forecast - by Material Type
- 12. Competitive Analysis
- 12.1. Company Profiles
- 12.1.1 ABB Ltd
- 12.1.1.1. Company Overview
- 12.1.1.2. Products
- 12.1.1.3. Company Financials
- 12.1.1.4. SWOT Analysis
- 12.1.2 Adalet (Scott Fetzer Company
- 12.1.2.1. Company Overview
- 12.1.2.2. Products
- 12.1.2.3. Company Financials
- 12.1.2.4. SWOT Analysis
- 12.1.3 Austin Electrical Enclosures
- 12.1.3.1. Company Overview
- 12.1.3.2. Products
- 12.1.3.3. Company Financials
- 12.1.3.4. SWOT Analysis
- 12.1.4 Hubbell Inc
- 12.1.4.1. Company Overview
- 12.1.4.2. Products
- 12.1.4.3. Company Financials
- 12.1.4.4. SWOT Analysis
- 12.1.5 Legrand SA
- 12.1.5.1. Company Overview
- 12.1.5.2. Products
- 12.1.5.3. Company Financials
- 12.1.5.4. SWOT Analysis
- 12.1.6 Emerson Electric Co
- 12.1.6.1. Company Overview
- 12.1.6.2. Products
- 12.1.6.3. Company Financials
- 12.1.6.4. SWOT Analysis
- 12.1.7 Siemens AG
- 12.1.7.1. Company Overview
- 12.1.7.2. Products
- 12.1.7.3. Company Financials
- 12.1.7.4. SWOT Analysis
- 12.1.8 Schneider Electric SE
- 12.1.8.1. Company Overview
- 12.1.8.2. Products
- 12.1.8.3. Company Financials
- 12.1.8.4. SWOT Analysis
- 12.1.9 Rittal GmbH & Co Kg
- 12.1.9.1. Company Overview
- 12.1.9.2. Products
- 12.1.9.3. Company Financials
- 12.1.9.4. SWOT Analysis
- 12.1.10 AZZ Inc
- 12.1.10.1. Company Overview
- 12.1.10.2. Products
- 12.1.10.3. Company Financials
- 12.1.10.4. SWOT Analysis
- 12.1.11 Nvent Electric PLC
- 12.1.11.1. Company Overview
- 12.1.11.2. Products
- 12.1.11.3. Company Financials
- 12.1.11.4. SWOT Analysis
- 12.1.12 Hammond Manufacturing Ltd
- 12.1.12.1. Company Overview
- 12.1.12.2. Products
- 12.1.12.3. Company Financials
- 12.1.12.4. SWOT Analysis
- 12.1.13 Eaton Corporation
- 12.1.13.1. Company Overview
- 12.1.13.2. Products
- 12.1.13.3. Company Financials
- 12.1.13.4. SWOT Analysis
- 12.1.1 ABB Ltd
- 12.2. Market Entropy
- 12.2.1 Company's Key Areas Served
- 12.2.2 Recent Developments
- 12.3. Company Market Share Analysis 2025
- 12.3.1 Top 5 Companies Market Share Analysis
- 12.3.2 Top 3 Companies Market Share Analysis
- 12.4. List of Potential Customers
- 13. Research Methodology
List of Figures
- Figure 1: Global US Electrical Enclosures Industry Revenue Breakdown (Million, %) by Region 2025 & 2033
- Figure 2: North America US Electrical Enclosures Industry Revenue (Million), by Material Type 2025 & 2033
- Figure 3: North America US Electrical Enclosures Industry Revenue Share (%), by Material Type 2025 & 2033
- Figure 4: North America US Electrical Enclosures Industry Revenue (Million), by Application 2025 & 2033
- Figure 5: North America US Electrical Enclosures Industry Revenue Share (%), by Application 2025 & 2033
- Figure 6: North America US Electrical Enclosures Industry Revenue (Million), by End-User 2025 & 2033
- Figure 7: North America US Electrical Enclosures Industry Revenue Share (%), by End-User 2025 & 2033
- Figure 8: North America US Electrical Enclosures Industry Revenue (Million), by Country 2025 & 2033
- Figure 9: North America US Electrical Enclosures Industry Revenue Share (%), by Country 2025 & 2033
- Figure 10: South America US Electrical Enclosures Industry Revenue (Million), by Material Type 2025 & 2033
- Figure 11: South America US Electrical Enclosures Industry Revenue Share (%), by Material Type 2025 & 2033
- Figure 12: South America US Electrical Enclosures Industry Revenue (Million), by Application 2025 & 2033
- Figure 13: South America US Electrical Enclosures Industry Revenue Share (%), by Application 2025 & 2033
- Figure 14: South America US Electrical Enclosures Industry Revenue (Million), by End-User 2025 & 2033
- Figure 15: South America US Electrical Enclosures Industry Revenue Share (%), by End-User 2025 & 2033
- Figure 16: South America US Electrical Enclosures Industry Revenue (Million), by Country 2025 & 2033
- Figure 17: South America US Electrical Enclosures Industry Revenue Share (%), by Country 2025 & 2033
- Figure 18: Europe US Electrical Enclosures Industry Revenue (Million), by Material Type 2025 & 2033
- Figure 19: Europe US Electrical Enclosures Industry Revenue Share (%), by Material Type 2025 & 2033
- Figure 20: Europe US Electrical Enclosures Industry Revenue (Million), by Application 2025 & 2033
- Figure 21: Europe US Electrical Enclosures Industry Revenue Share (%), by Application 2025 & 2033
- Figure 22: Europe US Electrical Enclosures Industry Revenue (Million), by End-User 2025 & 2033
- Figure 23: Europe US Electrical Enclosures Industry Revenue Share (%), by End-User 2025 & 2033
- Figure 24: Europe US Electrical Enclosures Industry Revenue (Million), by Country 2025 & 2033
- Figure 25: Europe US Electrical Enclosures Industry Revenue Share (%), by Country 2025 & 2033
- Figure 26: Middle East & Africa US Electrical Enclosures Industry Revenue (Million), by Material Type 2025 & 2033
- Figure 27: Middle East & Africa US Electrical Enclosures Industry Revenue Share (%), by Material Type 2025 & 2033
- Figure 28: Middle East & Africa US Electrical Enclosures Industry Revenue (Million), by Application 2025 & 2033
- Figure 29: Middle East & Africa US Electrical Enclosures Industry Revenue Share (%), by Application 2025 & 2033
- Figure 30: Middle East & Africa US Electrical Enclosures Industry Revenue (Million), by End-User 2025 & 2033
- Figure 31: Middle East & Africa US Electrical Enclosures Industry Revenue Share (%), by End-User 2025 & 2033
- Figure 32: Middle East & Africa US Electrical Enclosures Industry Revenue (Million), by Country 2025 & 2033
- Figure 33: Middle East & Africa US Electrical Enclosures Industry Revenue Share (%), by Country 2025 & 2033
- Figure 34: Asia Pacific US Electrical Enclosures Industry Revenue (Million), by Material Type 2025 & 2033
- Figure 35: Asia Pacific US Electrical Enclosures Industry Revenue Share (%), by Material Type 2025 & 2033
- Figure 36: Asia Pacific US Electrical Enclosures Industry Revenue (Million), by Application 2025 & 2033
- Figure 37: Asia Pacific US Electrical Enclosures Industry Revenue Share (%), by Application 2025 & 2033
- Figure 38: Asia Pacific US Electrical Enclosures Industry Revenue (Million), by End-User 2025 & 2033
- Figure 39: Asia Pacific US Electrical Enclosures Industry Revenue Share (%), by End-User 2025 & 2033
- Figure 40: Asia Pacific US Electrical Enclosures Industry Revenue (Million), by Country 2025 & 2033
- Figure 41: Asia Pacific US Electrical Enclosures Industry Revenue Share (%), by Country 2025 & 2033
List of Tables
- Table 1: Global US Electrical Enclosures Industry Revenue Million Forecast, by Material Type 2020 & 2033
- Table 2: Global US Electrical Enclosures Industry Revenue Million Forecast, by Application 2020 & 2033
- Table 3: Global US Electrical Enclosures Industry Revenue Million Forecast, by End-User 2020 & 2033
- Table 4: Global US Electrical Enclosures Industry Revenue Million Forecast, by Region 2020 & 2033
- Table 5: Global US Electrical Enclosures Industry Revenue Million Forecast, by Material Type 2020 & 2033
- Table 6: Global US Electrical Enclosures Industry Revenue Million Forecast, by Application 2020 & 2033
- Table 7: Global US Electrical Enclosures Industry Revenue Million Forecast, by End-User 2020 & 2033
- Table 8: Global US Electrical Enclosures Industry Revenue Million Forecast, by Country 2020 & 2033
- Table 9: United States US Electrical Enclosures Industry Revenue (Million) Forecast, by Application 2020 & 2033
- Table 10: Canada US Electrical Enclosures Industry Revenue (Million) Forecast, by Application 2020 & 2033
- Table 11: Mexico US Electrical Enclosures Industry Revenue (Million) Forecast, by Application 2020 & 2033
- Table 12: Global US Electrical Enclosures Industry Revenue Million Forecast, by Material Type 2020 & 2033
- Table 13: Global US Electrical Enclosures Industry Revenue Million Forecast, by Application 2020 & 2033
- Table 14: Global US Electrical Enclosures Industry Revenue Million Forecast, by End-User 2020 & 2033
- Table 15: Global US Electrical Enclosures Industry Revenue Million Forecast, by Country 2020 & 2033
- Table 16: Brazil US Electrical Enclosures Industry Revenue (Million) Forecast, by Application 2020 & 2033
- Table 17: Argentina US Electrical Enclosures Industry Revenue (Million) Forecast, by Application 2020 & 2033
- Table 18: Rest of South America US Electrical Enclosures Industry Revenue (Million) Forecast, by Application 2020 & 2033
- Table 19: Global US Electrical Enclosures Industry Revenue Million Forecast, by Material Type 2020 & 2033
- Table 20: Global US Electrical Enclosures Industry Revenue Million Forecast, by Application 2020 & 2033
- Table 21: Global US Electrical Enclosures Industry Revenue Million Forecast, by End-User 2020 & 2033
- Table 22: Global US Electrical Enclosures Industry Revenue Million Forecast, by Country 2020 & 2033
- Table 23: United Kingdom US Electrical Enclosures Industry Revenue (Million) Forecast, by Application 2020 & 2033
- Table 24: Germany US Electrical Enclosures Industry Revenue (Million) Forecast, by Application 2020 & 2033
- Table 25: France US Electrical Enclosures Industry Revenue (Million) Forecast, by Application 2020 & 2033
- Table 26: Italy US Electrical Enclosures Industry Revenue (Million) Forecast, by Application 2020 & 2033
- Table 27: Spain US Electrical Enclosures Industry Revenue (Million) Forecast, by Application 2020 & 2033
- Table 28: Russia US Electrical Enclosures Industry Revenue (Million) Forecast, by Application 2020 & 2033
- Table 29: Benelux US Electrical Enclosures Industry Revenue (Million) Forecast, by Application 2020 & 2033
- Table 30: Nordics US Electrical Enclosures Industry Revenue (Million) Forecast, by Application 2020 & 2033
- Table 31: Rest of Europe US Electrical Enclosures Industry Revenue (Million) Forecast, by Application 2020 & 2033
- Table 32: Global US Electrical Enclosures Industry Revenue Million Forecast, by Material Type 2020 & 2033
- Table 33: Global US Electrical Enclosures Industry Revenue Million Forecast, by Application 2020 & 2033
- Table 34: Global US Electrical Enclosures Industry Revenue Million Forecast, by End-User 2020 & 2033
- Table 35: Global US Electrical Enclosures Industry Revenue Million Forecast, by Country 2020 & 2033
- Table 36: Turkey US Electrical Enclosures Industry Revenue (Million) Forecast, by Application 2020 & 2033
- Table 37: Israel US Electrical Enclosures Industry Revenue (Million) Forecast, by Application 2020 & 2033
- Table 38: GCC US Electrical Enclosures Industry Revenue (Million) Forecast, by Application 2020 & 2033
- Table 39: North Africa US Electrical Enclosures Industry Revenue (Million) Forecast, by Application 2020 & 2033
- Table 40: South Africa US Electrical Enclosures Industry Revenue (Million) Forecast, by Application 2020 & 2033
- Table 41: Rest of Middle East & Africa US Electrical Enclosures Industry Revenue (Million) Forecast, by Application 2020 & 2033
- Table 42: Global US Electrical Enclosures Industry Revenue Million Forecast, by Material Type 2020 & 2033
- Table 43: Global US Electrical Enclosures Industry Revenue Million Forecast, by Application 2020 & 2033
- Table 44: Global US Electrical Enclosures Industry Revenue Million Forecast, by End-User 2020 & 2033
- Table 45: Global US Electrical Enclosures Industry Revenue Million Forecast, by Country 2020 & 2033
- Table 46: China US Electrical Enclosures Industry Revenue (Million) Forecast, by Application 2020 & 2033
- Table 47: India US Electrical Enclosures Industry Revenue (Million) Forecast, by Application 2020 & 2033
- Table 48: Japan US Electrical Enclosures Industry Revenue (Million) Forecast, by Application 2020 & 2033
- Table 49: South Korea US Electrical Enclosures Industry Revenue (Million) Forecast, by Application 2020 & 2033
- Table 50: ASEAN US Electrical Enclosures Industry Revenue (Million) Forecast, by Application 2020 & 2033
- Table 51: Oceania US Electrical Enclosures Industry Revenue (Million) Forecast, by Application 2020 & 2033
- Table 52: Rest of Asia Pacific US Electrical Enclosures Industry Revenue (Million) Forecast, by Application 2020 & 2033
Frequently Asked Questions
1. What is the projected Compound Annual Growth Rate (CAGR) of the US Electrical Enclosures Industry?
The projected CAGR is approximately 7.91%.
2. Which companies are prominent players in the US Electrical Enclosures Industry?
Key companies in the market include ABB Ltd, Adalet (Scott Fetzer Company, Austin Electrical Enclosures, Hubbell Inc, Legrand SA, Emerson Electric Co, Siemens AG, Schneider Electric SE, Rittal GmbH & Co Kg, AZZ Inc, Nvent Electric PLC, Hammond Manufacturing Ltd, Eaton Corporation.
3. What are the main segments of the US Electrical Enclosures Industry?
The market segments include Material Type, Application, End-User.
4. Can you provide details about the market size?
The market size is estimated to be USD 1.95 Million as of 2022.
5. What are some drivers contributing to market growth?
Growing Consumption and Capacity of Renewable Energy; Aging Power Generation and Distribution Network.
6. What are the notable trends driving market growth?
Commercial spaces and buildings industry to drive the market demand.
7. Are there any restraints impacting market growth?
Economic Slowdown in Industries.
8. Can you provide examples of recent developments in the market?
August 2021 - Hammond Manufacturing Ltd announced a USD 24 million expansion to provide more painting and metal fabrication capacity. The new 96,000-sq. Ft facility is scheduled to be operational by the end of 2022. The company manufactures electronic and electrical products, including metallic and non-metallic enclosures, racks, small cases, outlet strips, surge suppressors, and electronic transformers.
9. What pricing options are available for accessing the report?
Pricing options include single-user, multi-user, and enterprise licenses priced at USD 3800, USD 4500, and USD 5800 respectively.
10. Is the market size provided in terms of value or volume?
The market size is provided in terms of value, measured in Million.
11. Are there any specific market keywords associated with the report?
Yes, the market keyword associated with the report is "US Electrical Enclosures Industry," which aids in identifying and referencing the specific market segment covered.
12. How do I determine which pricing option suits my needs best?
The pricing options vary based on user requirements and access needs. Individual users may opt for single-user licenses, while businesses requiring broader access may choose multi-user or enterprise licenses for cost-effective access to the report.
13. Are there any additional resources or data provided in the US Electrical Enclosures Industry report?
While the report offers comprehensive insights, it's advisable to review the specific contents or supplementary materials provided to ascertain if additional resources or data are available.
14. How can I stay updated on further developments or reports in the US Electrical Enclosures Industry?
To stay informed about further developments, trends, and reports in the US Electrical Enclosures Industry, consider subscribing to industry newsletters, following relevant companies and organizations, or regularly checking reputable industry news sources and publications.
Methodology
Step 1 - Identification of Relevant Samples Size from Population Database


Step 2 - Approaches for Defining Global Market Size (Value, Volume* & Price*)

Note*: In applicable scenarios
Step 3 - Data Sources
Primary Research
- Web Analytics
- Survey Reports
- Research Institute
- Latest Research Reports
- Opinion Leaders
Secondary Research
- Annual Reports
- White Paper
- Latest Press Release
- Industry Association
- Paid Database
- Investor Presentations

Step 4 - Data Triangulation
Involves using different sources of information in order to increase the validity of a study
These sources are likely to be stakeholders in a program - participants, other researchers, program staff, other community members, and so on.
Then we put all data in single framework & apply various statistical tools to find out the dynamic on the market.
During the analysis stage, feedback from the stakeholder groups would be compared to determine areas of agreement as well as areas of divergence