
Key Insights
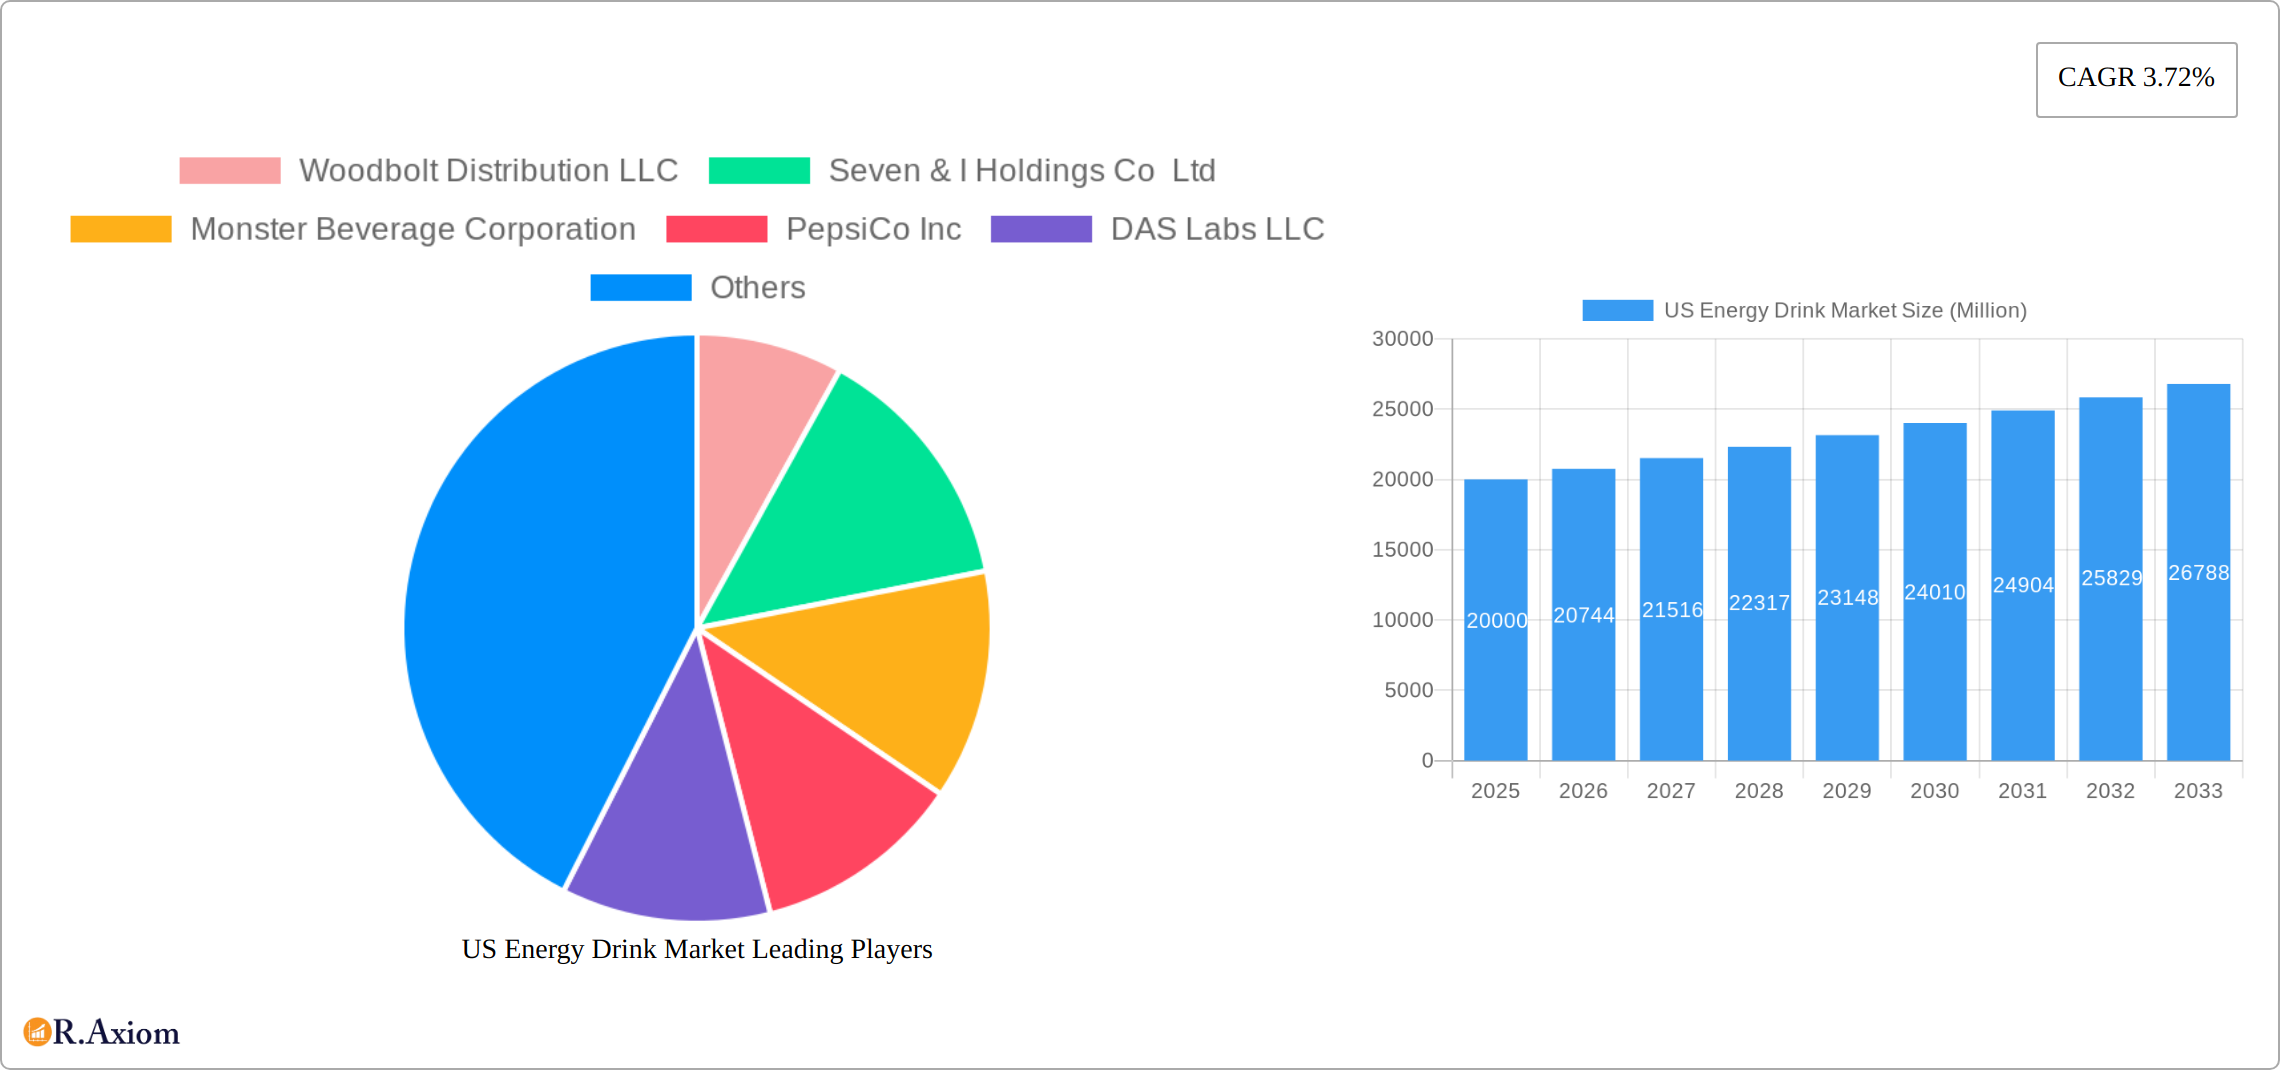
The US energy drink market, valued at approximately $20 billion in 2025, is projected to experience robust growth, exhibiting a Compound Annual Growth Rate (CAGR) of 3.72% from 2025 to 2033. This expansion is fueled by several key drivers. The increasing prevalence of health-conscious consumers seeking functional beverages is driving demand for sugar-free and low-calorie options, alongside the rise of natural and organic energy drinks. Furthermore, the expanding on-trade sector, encompassing bars, restaurants, and cafes, presents significant opportunities for increased sales and market penetration. The popularity of energy shots, providing a quick and convenient energy boost, also contributes significantly to the market's dynamism. However, growing concerns regarding the potential health risks associated with excessive energy drink consumption, coupled with evolving consumer preferences toward healthier alternatives, pose significant restraints. Market segmentation reveals a preference shift towards healthier options like natural and organic energy drinks and sugar-free variants, while the traditional energy drink segment maintains a substantial share due to established brand loyalty and wide availability. Competition among established players like Red Bull, Monster Beverage, and PepsiCo, alongside emerging brands focusing on niche segments, further shapes the market landscape. The dominance of the off-trade distribution channel (retail stores) is gradually being challenged by the growing popularity of on-trade channels as consumers seek convenient access to energy drinks in various social settings.
Geographic analysis reveals North America, particularly the United States, as the key market driver. The strong presence of major players and high per capita consumption contribute to this dominance. The continued growth of the US market is contingent upon successful product innovation, aligning with evolving consumer preferences for healthier ingredients and functional benefits. Adapting to these evolving demands, focusing on sustainable packaging solutions, and addressing consumer health concerns will be critical for industry players aiming to capitalize on the market's growth trajectory. Strategic partnerships, targeted marketing campaigns emphasizing health benefits and lifestyle integration, and expansion into diverse distribution channels are crucial strategies for success in this competitive and evolving market.
US Energy Drink Market: A Comprehensive Report (2019-2033)
This detailed report provides a comprehensive analysis of the US Energy Drink Market, offering invaluable insights for industry stakeholders, investors, and strategic decision-makers. Spanning the period from 2019 to 2033, with 2025 as the base year, this report meticulously examines market dynamics, growth drivers, challenges, and emerging opportunities. The forecast period extends from 2025 to 2033, building upon historical data from 2019 to 2024. The market is segmented across key parameters including packaging type, distribution channel, and soft drink type, offering granular insights into market trends and competitive landscapes. The total market size in 2025 is estimated at xx Million.
US Energy Drink Market Market Concentration & Innovation
The US energy drink market exhibits a high degree of concentration, with a few major players commanding significant market share. Companies like Monster Beverage Corporation, PepsiCo Inc, and Red Bull GmbH dominate the landscape, leveraging strong brand recognition and extensive distribution networks. However, smaller players like Zevia LLC and DAS Labs LLC are also making inroads with niche offerings, focusing on natural, organic, or low-calorie options.
Market innovation is driven by consumer demand for healthier alternatives and functional beverages. This has led to the rise of sugar-free, low-calorie, and natural/organic energy drinks. Regulatory frameworks, particularly concerning sugar content and labeling, also influence innovation. Product substitutes, such as coffee, tea, and sports drinks, pose a constant competitive pressure. End-user trends, including health consciousness and preference for convenient formats, shape product development. The market witnesses frequent mergers and acquisitions (M&A) activities, illustrated by recent deals like Monster Beverage Corporation's acquisition of Bang Energy for approximately USD 362 Million in July 2023. This indicates a drive towards consolidation and expansion within the market.
- Market Share: Monster Beverage Corporation holds approximately xx% market share in 2025, followed by Red Bull GmbH with xx% and PepsiCo Inc. with xx%.
- M&A Deal Values (2023): Monster Beverage Corporation's acquisition of Bang Energy: USD 362 Million.
US Energy Drink Market Industry Trends & Insights
The US energy drink market is experiencing robust growth, driven by several key factors. Increasing consumer demand for convenient and functional beverages fuels market expansion. Technological advancements, such as improved packaging and flavor innovation, enhance consumer appeal. Changing consumer preferences towards healthier options are also influencing the product portfolio of market players. The market exhibits strong competitive dynamics, with established players constantly innovating to retain market share, and emerging brands introducing differentiated products. The market is projected to experience a Compound Annual Growth Rate (CAGR) of xx% during the forecast period (2025-2033). Market penetration, especially among younger demographics, remains high, though there is potential for further expansion in older demographics with tailored products. The shift towards online ordering and e-commerce platforms is also influencing distribution patterns and sales channels. The growing popularity of natural and organic energy drinks indicates a promising market segment with a significant growth potential.

Dominant Markets & Segments in US Energy Drink Market
The US energy drink market is geographically widespread, with no single region dominating entirely. However, specific segments within the market demonstrate stronger performance.
- Packaging Type: Metal cans are the dominant packaging type, due to their durability, cost-effectiveness, and consumer preference.
- Distribution Channel: The off-trade channel (grocery stores, convenience stores, etc.) holds a significant market share due to widespread accessibility.
- Soft Drink Type: Traditional energy drinks still constitute a substantial portion of the market. However, the segments of sugar-free/low-calorie and natural/organic energy drinks are experiencing rapid growth, driven by health-conscious consumers.
Key Drivers:
- Economic Policies: Favorable economic conditions and consumer spending patterns influence energy drink consumption.
- Infrastructure: Efficient distribution networks and retail infrastructure contribute to market accessibility.
- Consumer Preferences: Shifting preferences towards healthier and functional beverages fuel segment growth.
US Energy Drink Market Product Developments
Recent product developments highlight a trend towards healthier and more functional energy drinks. Companies are introducing sugar-free and low-calorie options, along with natural and organic variants. There's also an increase in the focus on enhanced functional benefits, such as improved cognitive performance and physical endurance. Technological advancements, like improved formulations and innovative packaging solutions, enhance the consumer experience and product shelf life. The successful integration of these developments within the market demonstrates a strong product-market fit, catering to the evolving demands of the health-conscious consumer.
Report Scope & Segmentation Analysis
This report provides a comprehensive segmentation analysis of the US Energy Drink Market, covering various aspects.
Packaging Type: Glass Bottles, Metal Cans, PET Bottles (Growth projections and market sizes for each are provided in the full report).
Distribution Channel: Off-trade (Grocery stores, convenience stores, supermarkets), On-trade (Restaurants, bars, cafes) (Growth projections and market sizes for each are provided in the full report).
Soft Drink Type: Energy Shots, Natural/Organic Energy Drinks, Sugar-free or Low-calories Energy Drinks, Traditional Energy Drinks, Other Energy Drinks (Growth projections and market sizes for each are provided in the full report).
Each segment's competitive dynamics, growth prospects, and market size are analyzed in detail in the complete report.
Key Drivers of US Energy Drink Market Growth
The US energy drink market growth is propelled by several factors. Firstly, the increasing demand for convenient and functional beverages among busy consumers fuels market expansion. Secondly, technological advancements resulting in improved formulations and packaging contribute significantly. Thirdly, the rise of health-conscious consumers has sparked demand for sugar-free, low-calorie, and natural alternatives, creating new market opportunities. Finally, favorable economic conditions and rising disposable incomes also positively impact market growth.
Challenges in the US Energy Drink Market Sector
The US energy drink market faces certain challenges. Stricter regulations regarding sugar content and labeling present hurdles for manufacturers. Supply chain disruptions and fluctuations in raw material costs can affect production and profitability. Intense competition from established players and emerging brands necessitates continuous innovation and marketing efforts. The negative perceptions associated with high sugar content and potential health risks create a barrier to market expansion.
Emerging Opportunities in US Energy Drink Market
Several emerging opportunities exist. Expanding into new market segments, like functional energy drinks with added health benefits, presents significant growth potential. The increasing adoption of sustainable packaging materials and eco-friendly production practices offers new marketing angles. The growing demand for personalized and customized energy drinks, catering to individual needs and preferences, provides scope for product differentiation. Furthermore, exploring e-commerce channels and direct-to-consumer sales strategies expands market reach and customer engagement.
Leading Players in the US Energy Drink Market Market
- Woodbolt Distribution LLC
- Seven & I Holdings Co Ltd
- Monster Beverage Corporation
- PepsiCo Inc
- DAS Labs LLC
- Red Bull GmbH
- Living Essentials LLC
- Zevia LL
- The Coca-Cola Company
- N V E Pharmaceuticals
- Congo Brands
Key Developments in US Energy Drink Market Industry
- July 2023: Monster Beverage Corporation acquired Bang Energy for approximately USD 362 Million, significantly altering market dynamics and expanding its product portfolio.
- July 2023: WWE and Nutrabolt launched a co-branded energy drink, leveraging brand synergy to boost sales and reach new consumer segments.
- July 2023: Zevia LLC explored new distribution partnerships to increase its market penetration and reach a wider customer base.
Strategic Outlook for US Energy Drink Market Market
The US energy drink market exhibits promising growth potential, driven by continuous innovation, evolving consumer preferences, and strategic acquisitions. The focus on healthier options, sustainable practices, and personalized offerings will shape future market trends. Companies that can effectively adapt to evolving consumer demands and regulatory changes will likely capture significant market share. Expansion into new market segments and strategic partnerships will drive growth in the coming years.
US Energy Drink Market Segmentation
-
1. Soft Drink Type
- 1.1. Energy Shots
- 1.2. Natural/Organic Energy Drinks
- 1.3. Sugar-free or Low-calories Energy Drinks
- 1.4. Traditional Energy Drinks
- 1.5. Other Energy Drinks
-
2. Packaging Type
- 2.1. Glass Bottles
- 2.2. Metal Can
- 2.3. PET Bottles
-
3. Distribution Channel
-
3.1. Off-trade
- 3.1.1. Convenience Stores
- 3.1.2. Online Retail
- 3.1.3. Supermarket/Hypermarket
- 3.1.4. Others
- 3.2. On-trade
-
3.1. Off-trade
US Energy Drink Market Segmentation By Geography
-
1. North America
- 1.1. United States
- 1.2. Canada
- 1.3. Mexico
-
2. South America
- 2.1. Brazil
- 2.2. Argentina
- 2.3. Rest of South America
-
3. Europe
- 3.1. United Kingdom
- 3.2. Germany
- 3.3. France
- 3.4. Italy
- 3.5. Spain
- 3.6. Russia
- 3.7. Benelux
- 3.8. Nordics
- 3.9. Rest of Europe
-
4. Middle East & Africa
- 4.1. Turkey
- 4.2. Israel
- 4.3. GCC
- 4.4. North Africa
- 4.5. South Africa
- 4.6. Rest of Middle East & Africa
-
5. Asia Pacific
- 5.1. China
- 5.2. India
- 5.3. Japan
- 5.4. South Korea
- 5.5. ASEAN
- 5.6. Oceania
- 5.7. Rest of Asia Pacific

US Energy Drink Market REPORT HIGHLIGHTS
| Aspects | Details |
|---|---|
| Study Period | 2019-2033 |
| Base Year | 2024 |
| Estimated Year | 2025 |
| Forecast Period | 2025-2033 |
| Historical Period | 2019-2024 |
| Growth Rate | CAGR of 3.72% from 2019-2033 |
| Segmentation |
|
Table of Contents
- 1. Introduction
- 1.1. Research Scope
- 1.2. Market Segmentation
- 1.3. Research Methodology
- 1.4. Definitions and Assumptions
- 2. Executive Summary
- 2.1. Introduction
- 3. Market Dynamics
- 3.1. Introduction
- 3.2. Market Drivers
- 3.2.1. Rising Consumer Awareness about Health and Fitness; Increasing the Use of Casein and Caseinate in Food and Beverage Industry
- 3.3. Market Restrains
- 3.3.1. High Competition From Alternative Protein Sources
- 3.4. Market Trends
- 3.4.1. OTHER KEY INDUSTRY TRENDS COVERED IN THE REPORT
- 4. Market Factor Analysis
- 4.1. Porters Five Forces
- 4.2. Supply/Value Chain
- 4.3. PESTEL analysis
- 4.4. Market Entropy
- 4.5. Patent/Trademark Analysis
- 5. Global US Energy Drink Market Analysis, Insights and Forecast, 2019-2031
- 5.1. Market Analysis, Insights and Forecast - by Soft Drink Type
- 5.1.1. Energy Shots
- 5.1.2. Natural/Organic Energy Drinks
- 5.1.3. Sugar-free or Low-calories Energy Drinks
- 5.1.4. Traditional Energy Drinks
- 5.1.5. Other Energy Drinks
- 5.2. Market Analysis, Insights and Forecast - by Packaging Type
- 5.2.1. Glass Bottles
- 5.2.2. Metal Can
- 5.2.3. PET Bottles
- 5.3. Market Analysis, Insights and Forecast - by Distribution Channel
- 5.3.1. Off-trade
- 5.3.1.1. Convenience Stores
- 5.3.1.2. Online Retail
- 5.3.1.3. Supermarket/Hypermarket
- 5.3.1.4. Others
- 5.3.2. On-trade
- 5.3.1. Off-trade
- 5.4. Market Analysis, Insights and Forecast - by Region
- 5.4.1. North America
- 5.4.2. South America
- 5.4.3. Europe
- 5.4.4. Middle East & Africa
- 5.4.5. Asia Pacific
- 5.1. Market Analysis, Insights and Forecast - by Soft Drink Type
- 6. North America US Energy Drink Market Analysis, Insights and Forecast, 2019-2031
- 6.1. Market Analysis, Insights and Forecast - by Soft Drink Type
- 6.1.1. Energy Shots
- 6.1.2. Natural/Organic Energy Drinks
- 6.1.3. Sugar-free or Low-calories Energy Drinks
- 6.1.4. Traditional Energy Drinks
- 6.1.5. Other Energy Drinks
- 6.2. Market Analysis, Insights and Forecast - by Packaging Type
- 6.2.1. Glass Bottles
- 6.2.2. Metal Can
- 6.2.3. PET Bottles
- 6.3. Market Analysis, Insights and Forecast - by Distribution Channel
- 6.3.1. Off-trade
- 6.3.1.1. Convenience Stores
- 6.3.1.2. Online Retail
- 6.3.1.3. Supermarket/Hypermarket
- 6.3.1.4. Others
- 6.3.2. On-trade
- 6.3.1. Off-trade
- 6.1. Market Analysis, Insights and Forecast - by Soft Drink Type
- 7. South America US Energy Drink Market Analysis, Insights and Forecast, 2019-2031
- 7.1. Market Analysis, Insights and Forecast - by Soft Drink Type
- 7.1.1. Energy Shots
- 7.1.2. Natural/Organic Energy Drinks
- 7.1.3. Sugar-free or Low-calories Energy Drinks
- 7.1.4. Traditional Energy Drinks
- 7.1.5. Other Energy Drinks
- 7.2. Market Analysis, Insights and Forecast - by Packaging Type
- 7.2.1. Glass Bottles
- 7.2.2. Metal Can
- 7.2.3. PET Bottles
- 7.3. Market Analysis, Insights and Forecast - by Distribution Channel
- 7.3.1. Off-trade
- 7.3.1.1. Convenience Stores
- 7.3.1.2. Online Retail
- 7.3.1.3. Supermarket/Hypermarket
- 7.3.1.4. Others
- 7.3.2. On-trade
- 7.3.1. Off-trade
- 7.1. Market Analysis, Insights and Forecast - by Soft Drink Type
- 8. Europe US Energy Drink Market Analysis, Insights and Forecast, 2019-2031
- 8.1. Market Analysis, Insights and Forecast - by Soft Drink Type
- 8.1.1. Energy Shots
- 8.1.2. Natural/Organic Energy Drinks
- 8.1.3. Sugar-free or Low-calories Energy Drinks
- 8.1.4. Traditional Energy Drinks
- 8.1.5. Other Energy Drinks
- 8.2. Market Analysis, Insights and Forecast - by Packaging Type
- 8.2.1. Glass Bottles
- 8.2.2. Metal Can
- 8.2.3. PET Bottles
- 8.3. Market Analysis, Insights and Forecast - by Distribution Channel
- 8.3.1. Off-trade
- 8.3.1.1. Convenience Stores
- 8.3.1.2. Online Retail
- 8.3.1.3. Supermarket/Hypermarket
- 8.3.1.4. Others
- 8.3.2. On-trade
- 8.3.1. Off-trade
- 8.1. Market Analysis, Insights and Forecast - by Soft Drink Type
- 9. Middle East & Africa US Energy Drink Market Analysis, Insights and Forecast, 2019-2031
- 9.1. Market Analysis, Insights and Forecast - by Soft Drink Type
- 9.1.1. Energy Shots
- 9.1.2. Natural/Organic Energy Drinks
- 9.1.3. Sugar-free or Low-calories Energy Drinks
- 9.1.4. Traditional Energy Drinks
- 9.1.5. Other Energy Drinks
- 9.2. Market Analysis, Insights and Forecast - by Packaging Type
- 9.2.1. Glass Bottles
- 9.2.2. Metal Can
- 9.2.3. PET Bottles
- 9.3. Market Analysis, Insights and Forecast - by Distribution Channel
- 9.3.1. Off-trade
- 9.3.1.1. Convenience Stores
- 9.3.1.2. Online Retail
- 9.3.1.3. Supermarket/Hypermarket
- 9.3.1.4. Others
- 9.3.2. On-trade
- 9.3.1. Off-trade
- 9.1. Market Analysis, Insights and Forecast - by Soft Drink Type
- 10. Asia Pacific US Energy Drink Market Analysis, Insights and Forecast, 2019-2031
- 10.1. Market Analysis, Insights and Forecast - by Soft Drink Type
- 10.1.1. Energy Shots
- 10.1.2. Natural/Organic Energy Drinks
- 10.1.3. Sugar-free or Low-calories Energy Drinks
- 10.1.4. Traditional Energy Drinks
- 10.1.5. Other Energy Drinks
- 10.2. Market Analysis, Insights and Forecast - by Packaging Type
- 10.2.1. Glass Bottles
- 10.2.2. Metal Can
- 10.2.3. PET Bottles
- 10.3. Market Analysis, Insights and Forecast - by Distribution Channel
- 10.3.1. Off-trade
- 10.3.1.1. Convenience Stores
- 10.3.1.2. Online Retail
- 10.3.1.3. Supermarket/Hypermarket
- 10.3.1.4. Others
- 10.3.2. On-trade
- 10.3.1. Off-trade
- 10.1. Market Analysis, Insights and Forecast - by Soft Drink Type
- 11. United States US Energy Drink Market Analysis, Insights and Forecast, 2019-2031
- 12. Canada US Energy Drink Market Analysis, Insights and Forecast, 2019-2031
- 13. Mexico US Energy Drink Market Analysis, Insights and Forecast, 2019-2031
- 14. Competitive Analysis
- 14.1. Global Market Share Analysis 2024
- 14.2. Company Profiles
- 14.2.1 Woodbolt Distribution LLC
- 14.2.1.1. Overview
- 14.2.1.2. Products
- 14.2.1.3. SWOT Analysis
- 14.2.1.4. Recent Developments
- 14.2.1.5. Financials (Based on Availability)
- 14.2.2 Seven & I Holdings Co Ltd
- 14.2.2.1. Overview
- 14.2.2.2. Products
- 14.2.2.3. SWOT Analysis
- 14.2.2.4. Recent Developments
- 14.2.2.5. Financials (Based on Availability)
- 14.2.3 Monster Beverage Corporation
- 14.2.3.1. Overview
- 14.2.3.2. Products
- 14.2.3.3. SWOT Analysis
- 14.2.3.4. Recent Developments
- 14.2.3.5. Financials (Based on Availability)
- 14.2.4 PepsiCo Inc
- 14.2.4.1. Overview
- 14.2.4.2. Products
- 14.2.4.3. SWOT Analysis
- 14.2.4.4. Recent Developments
- 14.2.4.5. Financials (Based on Availability)
- 14.2.5 DAS Labs LLC
- 14.2.5.1. Overview
- 14.2.5.2. Products
- 14.2.5.3. SWOT Analysis
- 14.2.5.4. Recent Developments
- 14.2.5.5. Financials (Based on Availability)
- 14.2.6 Red Bull GmbH
- 14.2.6.1. Overview
- 14.2.6.2. Products
- 14.2.6.3. SWOT Analysis
- 14.2.6.4. Recent Developments
- 14.2.6.5. Financials (Based on Availability)
- 14.2.7 Living Essentials LLC
- 14.2.7.1. Overview
- 14.2.7.2. Products
- 14.2.7.3. SWOT Analysis
- 14.2.7.4. Recent Developments
- 14.2.7.5. Financials (Based on Availability)
- 14.2.8 Zevia LL
- 14.2.8.1. Overview
- 14.2.8.2. Products
- 14.2.8.3. SWOT Analysis
- 14.2.8.4. Recent Developments
- 14.2.8.5. Financials (Based on Availability)
- 14.2.9 The Coca-Cola Company
- 14.2.9.1. Overview
- 14.2.9.2. Products
- 14.2.9.3. SWOT Analysis
- 14.2.9.4. Recent Developments
- 14.2.9.5. Financials (Based on Availability)
- 14.2.10 N V E Pharmaceuticals
- 14.2.10.1. Overview
- 14.2.10.2. Products
- 14.2.10.3. SWOT Analysis
- 14.2.10.4. Recent Developments
- 14.2.10.5. Financials (Based on Availability)
- 14.2.11 Congo Brands
- 14.2.11.1. Overview
- 14.2.11.2. Products
- 14.2.11.3. SWOT Analysis
- 14.2.11.4. Recent Developments
- 14.2.11.5. Financials (Based on Availability)
- 14.2.1 Woodbolt Distribution LLC
List of Figures
- Figure 1: Global US Energy Drink Market Revenue Breakdown (Million, %) by Region 2024 & 2032
- Figure 2: North America US Energy Drink Market Revenue (Million), by Country 2024 & 2032
- Figure 3: North America US Energy Drink Market Revenue Share (%), by Country 2024 & 2032
- Figure 4: North America US Energy Drink Market Revenue (Million), by Soft Drink Type 2024 & 2032
- Figure 5: North America US Energy Drink Market Revenue Share (%), by Soft Drink Type 2024 & 2032
- Figure 6: North America US Energy Drink Market Revenue (Million), by Packaging Type 2024 & 2032
- Figure 7: North America US Energy Drink Market Revenue Share (%), by Packaging Type 2024 & 2032
- Figure 8: North America US Energy Drink Market Revenue (Million), by Distribution Channel 2024 & 2032
- Figure 9: North America US Energy Drink Market Revenue Share (%), by Distribution Channel 2024 & 2032
- Figure 10: North America US Energy Drink Market Revenue (Million), by Country 2024 & 2032
- Figure 11: North America US Energy Drink Market Revenue Share (%), by Country 2024 & 2032
- Figure 12: South America US Energy Drink Market Revenue (Million), by Soft Drink Type 2024 & 2032
- Figure 13: South America US Energy Drink Market Revenue Share (%), by Soft Drink Type 2024 & 2032
- Figure 14: South America US Energy Drink Market Revenue (Million), by Packaging Type 2024 & 2032
- Figure 15: South America US Energy Drink Market Revenue Share (%), by Packaging Type 2024 & 2032
- Figure 16: South America US Energy Drink Market Revenue (Million), by Distribution Channel 2024 & 2032
- Figure 17: South America US Energy Drink Market Revenue Share (%), by Distribution Channel 2024 & 2032
- Figure 18: South America US Energy Drink Market Revenue (Million), by Country 2024 & 2032
- Figure 19: South America US Energy Drink Market Revenue Share (%), by Country 2024 & 2032
- Figure 20: Europe US Energy Drink Market Revenue (Million), by Soft Drink Type 2024 & 2032
- Figure 21: Europe US Energy Drink Market Revenue Share (%), by Soft Drink Type 2024 & 2032
- Figure 22: Europe US Energy Drink Market Revenue (Million), by Packaging Type 2024 & 2032
- Figure 23: Europe US Energy Drink Market Revenue Share (%), by Packaging Type 2024 & 2032
- Figure 24: Europe US Energy Drink Market Revenue (Million), by Distribution Channel 2024 & 2032
- Figure 25: Europe US Energy Drink Market Revenue Share (%), by Distribution Channel 2024 & 2032
- Figure 26: Europe US Energy Drink Market Revenue (Million), by Country 2024 & 2032
- Figure 27: Europe US Energy Drink Market Revenue Share (%), by Country 2024 & 2032
- Figure 28: Middle East & Africa US Energy Drink Market Revenue (Million), by Soft Drink Type 2024 & 2032
- Figure 29: Middle East & Africa US Energy Drink Market Revenue Share (%), by Soft Drink Type 2024 & 2032
- Figure 30: Middle East & Africa US Energy Drink Market Revenue (Million), by Packaging Type 2024 & 2032
- Figure 31: Middle East & Africa US Energy Drink Market Revenue Share (%), by Packaging Type 2024 & 2032
- Figure 32: Middle East & Africa US Energy Drink Market Revenue (Million), by Distribution Channel 2024 & 2032
- Figure 33: Middle East & Africa US Energy Drink Market Revenue Share (%), by Distribution Channel 2024 & 2032
- Figure 34: Middle East & Africa US Energy Drink Market Revenue (Million), by Country 2024 & 2032
- Figure 35: Middle East & Africa US Energy Drink Market Revenue Share (%), by Country 2024 & 2032
- Figure 36: Asia Pacific US Energy Drink Market Revenue (Million), by Soft Drink Type 2024 & 2032
- Figure 37: Asia Pacific US Energy Drink Market Revenue Share (%), by Soft Drink Type 2024 & 2032
- Figure 38: Asia Pacific US Energy Drink Market Revenue (Million), by Packaging Type 2024 & 2032
- Figure 39: Asia Pacific US Energy Drink Market Revenue Share (%), by Packaging Type 2024 & 2032
- Figure 40: Asia Pacific US Energy Drink Market Revenue (Million), by Distribution Channel 2024 & 2032
- Figure 41: Asia Pacific US Energy Drink Market Revenue Share (%), by Distribution Channel 2024 & 2032
- Figure 42: Asia Pacific US Energy Drink Market Revenue (Million), by Country 2024 & 2032
- Figure 43: Asia Pacific US Energy Drink Market Revenue Share (%), by Country 2024 & 2032
List of Tables
- Table 1: Global US Energy Drink Market Revenue Million Forecast, by Region 2019 & 2032
- Table 2: Global US Energy Drink Market Revenue Million Forecast, by Soft Drink Type 2019 & 2032
- Table 3: Global US Energy Drink Market Revenue Million Forecast, by Packaging Type 2019 & 2032
- Table 4: Global US Energy Drink Market Revenue Million Forecast, by Distribution Channel 2019 & 2032
- Table 5: Global US Energy Drink Market Revenue Million Forecast, by Region 2019 & 2032
- Table 6: Global US Energy Drink Market Revenue Million Forecast, by Country 2019 & 2032
- Table 7: United States US Energy Drink Market Revenue (Million) Forecast, by Application 2019 & 2032
- Table 8: Canada US Energy Drink Market Revenue (Million) Forecast, by Application 2019 & 2032
- Table 9: Mexico US Energy Drink Market Revenue (Million) Forecast, by Application 2019 & 2032
- Table 10: Global US Energy Drink Market Revenue Million Forecast, by Soft Drink Type 2019 & 2032
- Table 11: Global US Energy Drink Market Revenue Million Forecast, by Packaging Type 2019 & 2032
- Table 12: Global US Energy Drink Market Revenue Million Forecast, by Distribution Channel 2019 & 2032
- Table 13: Global US Energy Drink Market Revenue Million Forecast, by Country 2019 & 2032
- Table 14: United States US Energy Drink Market Revenue (Million) Forecast, by Application 2019 & 2032
- Table 15: Canada US Energy Drink Market Revenue (Million) Forecast, by Application 2019 & 2032
- Table 16: Mexico US Energy Drink Market Revenue (Million) Forecast, by Application 2019 & 2032
- Table 17: Global US Energy Drink Market Revenue Million Forecast, by Soft Drink Type 2019 & 2032
- Table 18: Global US Energy Drink Market Revenue Million Forecast, by Packaging Type 2019 & 2032
- Table 19: Global US Energy Drink Market Revenue Million Forecast, by Distribution Channel 2019 & 2032
- Table 20: Global US Energy Drink Market Revenue Million Forecast, by Country 2019 & 2032
- Table 21: Brazil US Energy Drink Market Revenue (Million) Forecast, by Application 2019 & 2032
- Table 22: Argentina US Energy Drink Market Revenue (Million) Forecast, by Application 2019 & 2032
- Table 23: Rest of South America US Energy Drink Market Revenue (Million) Forecast, by Application 2019 & 2032
- Table 24: Global US Energy Drink Market Revenue Million Forecast, by Soft Drink Type 2019 & 2032
- Table 25: Global US Energy Drink Market Revenue Million Forecast, by Packaging Type 2019 & 2032
- Table 26: Global US Energy Drink Market Revenue Million Forecast, by Distribution Channel 2019 & 2032
- Table 27: Global US Energy Drink Market Revenue Million Forecast, by Country 2019 & 2032
- Table 28: United Kingdom US Energy Drink Market Revenue (Million) Forecast, by Application 2019 & 2032
- Table 29: Germany US Energy Drink Market Revenue (Million) Forecast, by Application 2019 & 2032
- Table 30: France US Energy Drink Market Revenue (Million) Forecast, by Application 2019 & 2032
- Table 31: Italy US Energy Drink Market Revenue (Million) Forecast, by Application 2019 & 2032
- Table 32: Spain US Energy Drink Market Revenue (Million) Forecast, by Application 2019 & 2032
- Table 33: Russia US Energy Drink Market Revenue (Million) Forecast, by Application 2019 & 2032
- Table 34: Benelux US Energy Drink Market Revenue (Million) Forecast, by Application 2019 & 2032
- Table 35: Nordics US Energy Drink Market Revenue (Million) Forecast, by Application 2019 & 2032
- Table 36: Rest of Europe US Energy Drink Market Revenue (Million) Forecast, by Application 2019 & 2032
- Table 37: Global US Energy Drink Market Revenue Million Forecast, by Soft Drink Type 2019 & 2032
- Table 38: Global US Energy Drink Market Revenue Million Forecast, by Packaging Type 2019 & 2032
- Table 39: Global US Energy Drink Market Revenue Million Forecast, by Distribution Channel 2019 & 2032
- Table 40: Global US Energy Drink Market Revenue Million Forecast, by Country 2019 & 2032
- Table 41: Turkey US Energy Drink Market Revenue (Million) Forecast, by Application 2019 & 2032
- Table 42: Israel US Energy Drink Market Revenue (Million) Forecast, by Application 2019 & 2032
- Table 43: GCC US Energy Drink Market Revenue (Million) Forecast, by Application 2019 & 2032
- Table 44: North Africa US Energy Drink Market Revenue (Million) Forecast, by Application 2019 & 2032
- Table 45: South Africa US Energy Drink Market Revenue (Million) Forecast, by Application 2019 & 2032
- Table 46: Rest of Middle East & Africa US Energy Drink Market Revenue (Million) Forecast, by Application 2019 & 2032
- Table 47: Global US Energy Drink Market Revenue Million Forecast, by Soft Drink Type 2019 & 2032
- Table 48: Global US Energy Drink Market Revenue Million Forecast, by Packaging Type 2019 & 2032
- Table 49: Global US Energy Drink Market Revenue Million Forecast, by Distribution Channel 2019 & 2032
- Table 50: Global US Energy Drink Market Revenue Million Forecast, by Country 2019 & 2032
- Table 51: China US Energy Drink Market Revenue (Million) Forecast, by Application 2019 & 2032
- Table 52: India US Energy Drink Market Revenue (Million) Forecast, by Application 2019 & 2032
- Table 53: Japan US Energy Drink Market Revenue (Million) Forecast, by Application 2019 & 2032
- Table 54: South Korea US Energy Drink Market Revenue (Million) Forecast, by Application 2019 & 2032
- Table 55: ASEAN US Energy Drink Market Revenue (Million) Forecast, by Application 2019 & 2032
- Table 56: Oceania US Energy Drink Market Revenue (Million) Forecast, by Application 2019 & 2032
- Table 57: Rest of Asia Pacific US Energy Drink Market Revenue (Million) Forecast, by Application 2019 & 2032
Frequently Asked Questions
1. What is the projected Compound Annual Growth Rate (CAGR) of the US Energy Drink Market?
The projected CAGR is approximately 3.72%.
2. Which companies are prominent players in the US Energy Drink Market?
Key companies in the market include Woodbolt Distribution LLC, Seven & I Holdings Co Ltd, Monster Beverage Corporation, PepsiCo Inc, DAS Labs LLC, Red Bull GmbH, Living Essentials LLC, Zevia LL, The Coca-Cola Company, N V E Pharmaceuticals, Congo Brands.
3. What are the main segments of the US Energy Drink Market?
The market segments include Soft Drink Type, Packaging Type, Distribution Channel.
4. Can you provide details about the market size?
The market size is estimated to be USD XX Million as of 2022.
5. What are some drivers contributing to market growth?
Rising Consumer Awareness about Health and Fitness; Increasing the Use of Casein and Caseinate in Food and Beverage Industry.
6. What are the notable trends driving market growth?
OTHER KEY INDUSTRY TRENDS COVERED IN THE REPORT.
7. Are there any restraints impacting market growth?
High Competition From Alternative Protein Sources.
8. Can you provide examples of recent developments in the market?
July 2023: Monster Beverage Corporation announced that its subsidiary, Blast Asset Acquisition LLC, completed its acquisition of substantially all of the assets of Vital Pharmaceuticals, Inc. and certain of its affiliates (collectively, “Bang Energy”) for approximately USD 362 million. The acquired assets include Bang Energy beverages and a beverage production facility in Phoenix, Arizona.July 2023: WWE and Nutrabolt, owner of the C4 brand, announced an expansion to their multi-year partnership with the launch of their first-ever co-branded product collaboration: WWE-inspired flavors of C4 Ultimate Pre-Workout Powder and C4 Ultimate Energy Drink.July 2023: The Los Angeles-based company Zevia LLC is considering getting a new distribution partner to expand its base business from selling multi-packs in grocery stores to selling single-serve cold beverages in c-stores.
9. What pricing options are available for accessing the report?
Pricing options include single-user, multi-user, and enterprise licenses priced at USD 3800, USD 4500, and USD 5800 respectively.
10. Is the market size provided in terms of value or volume?
The market size is provided in terms of value, measured in Million.
11. Are there any specific market keywords associated with the report?
Yes, the market keyword associated with the report is "US Energy Drink Market," which aids in identifying and referencing the specific market segment covered.
12. How do I determine which pricing option suits my needs best?
The pricing options vary based on user requirements and access needs. Individual users may opt for single-user licenses, while businesses requiring broader access may choose multi-user or enterprise licenses for cost-effective access to the report.
13. Are there any additional resources or data provided in the US Energy Drink Market report?
While the report offers comprehensive insights, it's advisable to review the specific contents or supplementary materials provided to ascertain if additional resources or data are available.
14. How can I stay updated on further developments or reports in the US Energy Drink Market?
To stay informed about further developments, trends, and reports in the US Energy Drink Market, consider subscribing to industry newsletters, following relevant companies and organizations, or regularly checking reputable industry news sources and publications.
Methodology
Step 1 - Identification of Relevant Samples Size from Population Database


Step 2 - Approaches for Defining Global Market Size (Value, Volume* & Price*)

Note*: In applicable scenarios
Step 3 - Data Sources
Primary Research
- Web Analytics
- Survey Reports
- Research Institute
- Latest Research Reports
- Opinion Leaders
Secondary Research
- Annual Reports
- White Paper
- Latest Press Release
- Industry Association
- Paid Database
- Investor Presentations

Step 4 - Data Triangulation
Involves using different sources of information in order to increase the validity of a study
These sources are likely to be stakeholders in a program - participants, other researchers, program staff, other community members, and so on.
Then we put all data in single framework & apply various statistical tools to find out the dynamic on the market.
During the analysis stage, feedback from the stakeholder groups would be compared to determine areas of agreement as well as areas of divergence


