

Key Insights
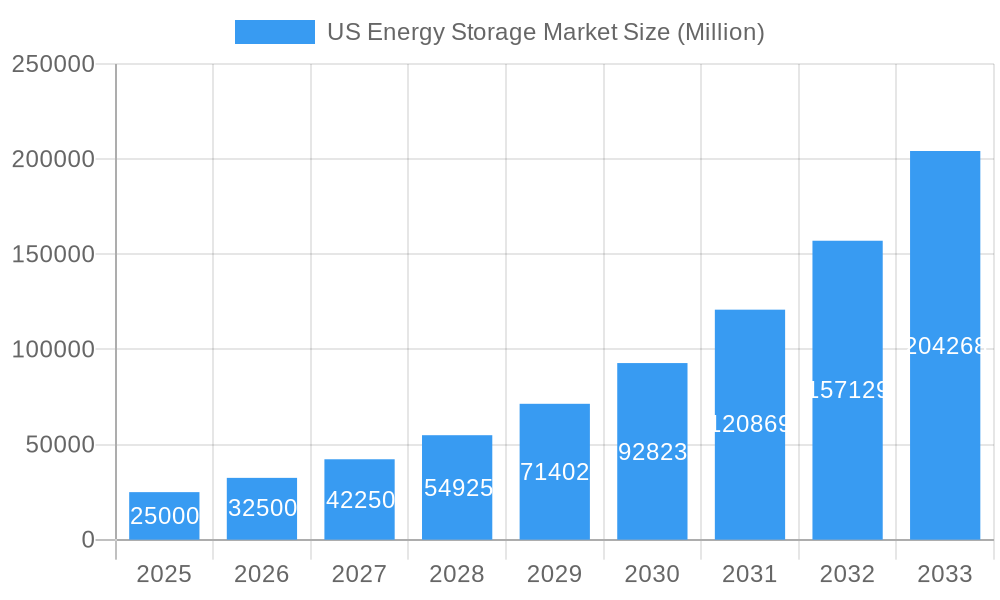
The United States energy storage market is poised for significant expansion, projected to achieve a Compound Annual Growth Rate (CAGR) of 29.1% between 2024 and 2033. This robust growth is underpinned by several critical drivers. The escalating integration of renewable energy sources, including solar and wind power, mandates efficient energy storage to mitigate intermittency and bolster grid reliability. Concurrently, rising electricity costs and heightened environmental consciousness are accelerating demand for energy storage systems across residential and commercial & industrial segments. Advancements in battery technology, notably lithium-ion, are reducing costs and enhancing performance, thereby improving the economic feasibility of energy storage solutions. Market segmentation indicates substantial growth across all phases and end-user categories, with the residential sector exhibiting particular promise due to increased adoption of rooftop solar and home energy management systems. Key market participants such as Tesla, BYD, and LG Energy Solution are actively influencing the market through innovation and strategic collaborations. Geographically, all US regions are experiencing strong growth, with the Northeast and West anticipated to lead due to higher renewable energy penetration and favorable governmental policies.
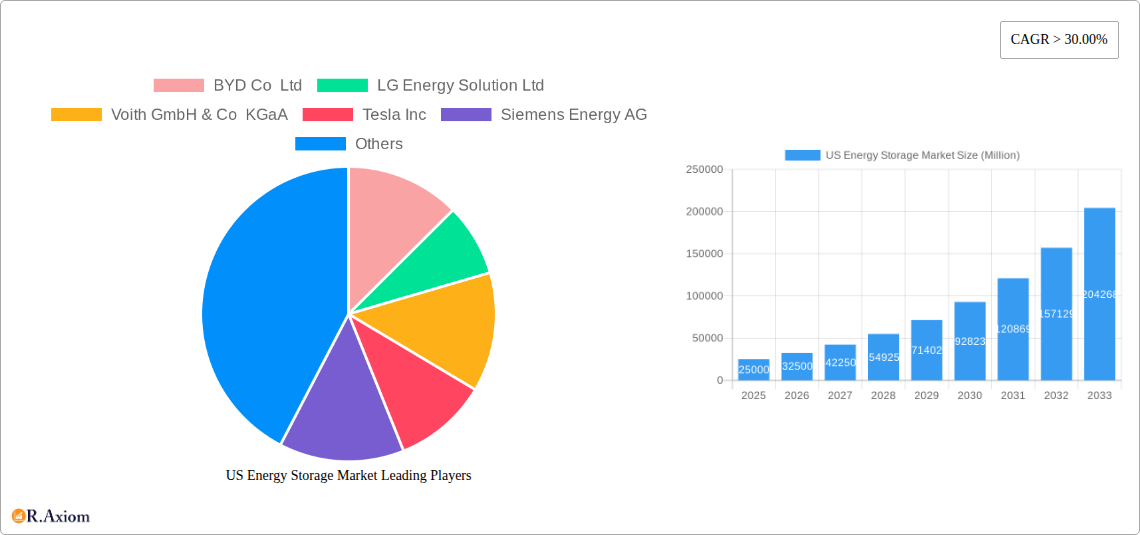
US Energy Storage Market Market Size (In Billion)
While the market demonstrates considerable potential, challenges persist. Supply chain disruptions and raw material availability for battery production present potential impediments. Additionally, regulatory complexities and the necessity for enhanced grid infrastructure to accommodate large-scale energy storage solutions pose significant obstacles. Despite these challenges, the long-term forecast remains optimistic, driven by ongoing government incentives, technological innovation, and the indispensable need for dependable and sustainable energy infrastructure. The market's evolution is expected to feature greater diversification in storage technologies beyond lithium-ion, incorporating solutions like flow batteries and other advanced systems tailored to specific applications and cost efficiencies. The expanding electric vehicle market will further stimulate demand for energy storage, fostering synergistic growth opportunities. The US energy storage market is forecast to reach 106.7 billion by 2033, with 2024 serving as the base year.
US Energy Storage Market Company Market Share
US Energy Storage Market: A Comprehensive Report (2019-2033)
This detailed report provides a comprehensive analysis of the US Energy Storage Market, offering invaluable insights for industry stakeholders, investors, and strategic decision-makers. The study covers the period 2019-2033, with a base year of 2025 and a forecast period of 2025-2033. The report leverages extensive market research, incorporating data from the historical period (2019-2024) and incorporating key industry developments. The analysis spans various segments, including technology, phase, and end-user applications, offering a granular understanding of market dynamics and future potential. Expected market value projections (in Millions) are provided throughout the report.
US Energy Storage Market Market Concentration & Innovation
This section analyzes the competitive landscape of the US energy storage market, examining market concentration, innovation drivers, regulatory influences, product substitution trends, end-user preferences, and mergers & acquisitions (M&A) activities. We delve into market share dynamics among key players and quantify the financial impact of significant M&A deals.
Market Concentration: The US energy storage market exhibits a moderately concentrated landscape, with several major players holding significant market share. However, the presence of numerous smaller companies and startups indicates a dynamic competitive environment. We will quantify this concentration using the Herfindahl-Hirschman Index (HHI) and identify the top five players based on revenue.
Innovation Drivers: Advancements in battery technology, particularly lithium-ion batteries, are a primary driver of market innovation. Other factors include decreasing costs, improving energy density, and advancements in grid-scale energy storage solutions. Government incentives and supportive policies further accelerate innovation.
Regulatory Frameworks: Federal and state-level policies, including tax credits, renewable portfolio standards (RPS), and grid modernization initiatives, significantly impact market growth and investment decisions. We will analyze the impact of key regulations on market participants.
Product Substitutes: Alternative energy storage technologies, such as pumped hydro and compressed air energy storage (CAES), compete with battery-based systems. We evaluate the competitive positioning and market share of different technologies.
End-User Trends: The increasing adoption of renewable energy sources (solar and wind) by residential, commercial, and industrial sectors fuels demand for energy storage solutions. Shifts in consumer preferences and government mandates drive sector-specific growth.
M&A Activities: The energy storage sector has seen significant M&A activity in recent years, with larger companies acquiring smaller startups to expand their technological capabilities and market reach. We will analyze major deals and their impact on market consolidation, providing deal values where available (xx Million). Examples include, but are not limited to, acquisitions within battery technology, software integration, and geographical expansion.
US Energy Storage Market Industry Trends & Insights
The US energy storage market is experiencing robust growth, propelled by a confluence of technological innovation, evolving consumer expectations, intense competitive pressures, and favorable macroeconomic conditions. Our analysis delves into the Compound Annual Growth Rate (CAGR) and market penetration of critical segments throughout the forecast period. Specifically, we project a CAGR of [Insert specific CAGR]%, detailing the dynamic expansion of the US energy storage market and pinpointing significant shifts in market share among leading industry players. Technological breakthroughs, particularly in advanced battery chemistries and sophisticated energy management systems, are pivotal drivers, contributing to substantial cost reductions and performance enhancements. Furthermore, we examine the accelerating adoption rates across residential, commercial, and industrial sectors, driven by strategic financial incentives, stringent regulatory mandates, and the continuous evolution of energy storage technologies.
Dominant Markets & Segments in US Energy Storage Market
This section meticulously identifies the preeminent regions, countries, and market segments within the dynamic US energy storage landscape. We dissect the core drivers of dominance for each identified segment and provide a comprehensive evaluation of the growth potential across diverse segments. This analysis further highlights the crucial role of supportive economic policies and strategic infrastructure development in shaping regional leadership.
-
Technology: Lithium-ion batteries are poised to maintain their dominance, fueled by ongoing technological advancements and decreasing manufacturing costs. While other energy storage technologies like flow batteries and solid-state batteries are being explored, their market share is anticipated to remain relatively smaller compared to the established lithium-ion sector in the near to mid-term. We will provide a detailed comparative analysis of emerging technologies and their potential to disrupt the market.
-
Phase: Three-phase systems are expected to lead the market, particularly for large-scale commercial and industrial applications and grid-level storage. Single-phase systems will continue to cater to the growing residential market, offering accessible solutions for homeowners seeking energy independence and backup power.
-
End-User: The Commercial & Industrial (C&I) sector is projected to remain the dominant end-user segment. This is driven by the escalating demand for uninterrupted power supply, peak shaving capabilities, and grid ancillary services to enhance operational resilience. While residential adoption is steadily increasing, the scale of C&I deployments positions it as the primary growth engine.
-
Regional Dominance: California, Texas, and other states with progressive renewable energy policies, robust grid infrastructure, and strong market demand for grid services are expected to lead energy storage deployment. Our analysis will detail the specific regional drivers, including state-level incentives, renewable portfolio standards, and the presence of significant industrial and utility-scale projects.
US Energy Storage Market Product Developments
This section summarizes recent product innovations, highlighting key advancements in battery technology, energy management systems, and other related areas. We will analyze the market fit and competitive advantages of various products, emphasizing how technological trends shape market acceptance and drive consumer adoption. The discussion will address the role of integrated solutions, such as the combination of solar panels and battery systems, in expanding market reach.
Report Scope & Segmentation Analysis
This report segments the US energy storage market across three key dimensions: technology, phase, and end-user.
Technology: The market is segmented into Batteries (Lithium-ion, Lead-acid, Flow batteries, etc.) and Other Energy Storage System Technologies (Pumped hydro, Compressed air energy storage, etc.). Each segment will have its own growth projection, market size (in Millions), and competitive landscape analysis.
Phase: The market is categorized into Single Phase and Three Phase systems. We project market size and growth for each, considering the end-user applications.
End-User: The market is segmented into Residential, Commercial & Industrial end-users. Market size and growth projections for each will be provided, detailing competitive dynamics in each sector.
Key Drivers of US Energy Storage Market Growth
The expansion of the US energy storage market is underpinned by a robust set of catalysts. Foremost among these are supportive government initiatives, including federal tax credits (e.g., Investment Tax Credit), state-level rebates, and various grant programs designed to foster adoption. The accelerating integration of renewable energy sources, such as solar and wind, necessitates energy storage solutions for grid stabilization and reliability. Furthermore, the declining cost of battery technology, driven by manufacturing scale and innovation, makes energy storage increasingly economically viable for a wider range of applications. Coupled with these are continuous advancements in battery technology, improving energy density and lifespan, and a growing societal awareness and urgency surrounding climate change, all of which collectively fuel market expansion.
Challenges in the US Energy Storage Market Sector
The US energy storage market faces several challenges, including the high upfront cost of energy storage systems, supply chain constraints, particularly for critical battery materials, and intermittency challenges associated with renewable energy sources. Furthermore, permitting processes and grid integration complexities can create hurdles for project deployment. These challenges impact market penetration and growth projections. We'll quantify the effect of these constraints where possible.
Emerging Opportunities in US Energy Storage Market
The US energy storage market is ripe with burgeoning opportunities. A significant area of growth lies in the synergistic integration of energy storage with electric vehicle (EV) infrastructure, enabling vehicle-to-grid (V2G) capabilities and supporting the charging ecosystem. The development of advanced, utility-scale energy storage solutions to support grid modernization and resilience is another key opportunity. Exploration into novel battery chemistries, such as advanced lithium-metal and solid-state batteries, promises higher energy density, enhanced safety, and extended lifespans. Emerging market segments like microgrids, crucial for critical infrastructure and community resilience, and off-grid applications, serving remote areas, are also witnessing rapid expansion and innovation.
Leading Players in the US Energy Storage Market Market
Key Developments in US Energy Storage Market Industry
-
March 2021: Apple's ambitious initiative to deploy solar farms and rooftop solar panels at its corporate facilities, complemented by a significant energy storage project in California, underscores the growing commitment of major corporations to renewable energy integration and advanced energy storage. This development significantly influences the demand for large-scale, reliable energy storage systems and sets a precedent for industry peers.
-
November 2021: The Apparent-led project to power electric buses in Los Angeles through a solar-plus-storage microgrid system exemplifies the transformative potential of energy storage in accelerating transportation electrification. This project represents a substantial market opportunity for medium-scale energy storage systems and vividly demonstrates the successful integration of renewable energy generation, energy storage, and electric vehicle charging infrastructure. The planned 4.5 MWh battery system highlights the significant scale of these forward-thinking projects within the evolving energy landscape.
Strategic Outlook for US Energy Storage Market Market
The US energy storage market is poised for significant growth in the coming years, driven by supportive government policies, technological advancements, decreasing battery costs, and the growing need for grid modernization. Emerging opportunities in various sectors, such as electric vehicles and microgrids, further enhance the market's long-term potential. The market is expected to experience substantial growth, driven by technological advancements, favorable government policies, and increasing adoption of renewable energy resources.
US Energy Storage Market Segmentation
-
1. Technology
- 1.1. Batteries
- 1.2. Other Energy Storage System Technologies
-
2. Phase
- 2.1. Single Phase
- 2.2. Three Phase
-
3. End User
- 3.1. Residential
- 3.2. Commercial and Industrial
US Energy Storage Market Segmentation By Geography
-
1. North America
- 1.1. United States
- 1.2. Canada
- 1.3. Mexico
-
2. South America
- 2.1. Brazil
- 2.2. Argentina
- 2.3. Rest of South America
-
3. Europe
- 3.1. United Kingdom
- 3.2. Germany
- 3.3. France
- 3.4. Italy
- 3.5. Spain
- 3.6. Russia
- 3.7. Benelux
- 3.8. Nordics
- 3.9. Rest of Europe
-
4. Middle East & Africa
- 4.1. Turkey
- 4.2. Israel
- 4.3. GCC
- 4.4. North Africa
- 4.5. South Africa
- 4.6. Rest of Middle East & Africa
-
5. Asia Pacific
- 5.1. China
- 5.2. India
- 5.3. Japan
- 5.4. South Korea
- 5.5. ASEAN
- 5.6. Oceania
- 5.7. Rest of Asia Pacific
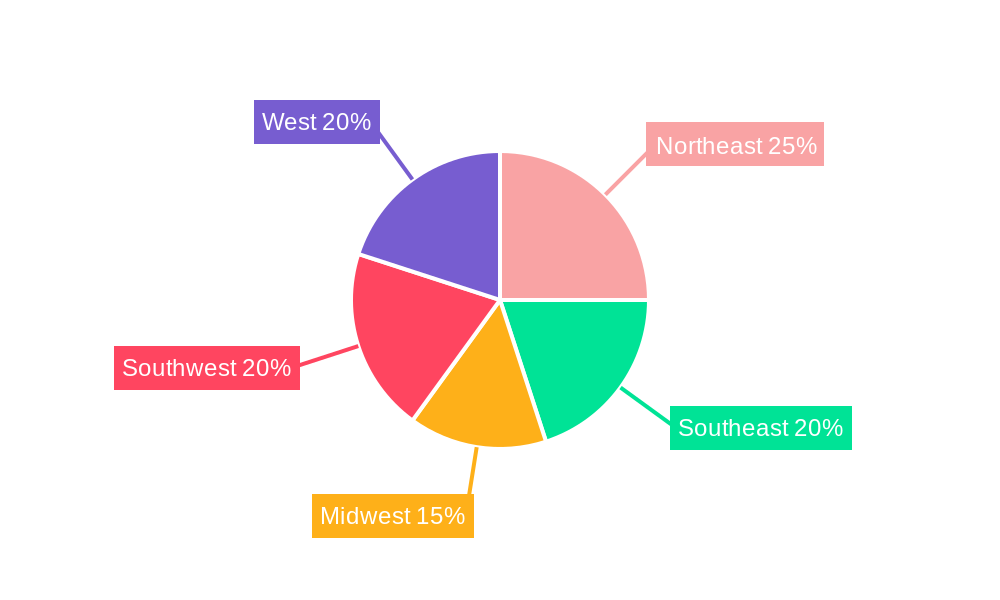
US Energy Storage Market Regional Market Share
Geographic Coverage of US Energy Storage Market
US Energy Storage Market REPORT HIGHLIGHTS
| Aspects | Details |
|---|---|
| Study Period | 2020-2034 |
| Base Year | 2025 |
| Estimated Year | 2026 |
| Forecast Period | 2026-2034 |
| Historical Period | 2020-2025 |
| Growth Rate | CAGR of 29.1% from 2020-2034 |
| Segmentation |
|
Table of Contents
- 1. Introduction
- 1.1. Research Scope
- 1.2. Market Segmentation
- 1.3. Research Objective
- 1.4. Definitions and Assumptions
- 2. Executive Summary
- 2.1. Market Snapshot
- 3. Market Dynamics
- 3.1. Market Drivers
- 3.2. Market Restrains
- 3.3. Market Trends
- 3.4. Market Opportunities
- 4. Market Factor Analysis
- 4.1. Porters Five Forces
- 4.1.1. Bargaining Power of Suppliers
- 4.1.2. Bargaining Power of Buyers
- 4.1.3. Threat of New Entrants
- 4.1.4. Threat of Substitutes
- 4.1.5. Competitive Rivalry
- 4.2. PESTEL analysis
- 4.3. BCG Analysis
- 4.3.1. Stars (High Growth, High Market Share)
- 4.3.2. Cash Cows (Low Growth, High Market Share)
- 4.3.3. Question Mark (High Growth, Low Market Share)
- 4.3.4. Dogs (Low Growth, Low Market Share)
- 4.4. Ansoff Matrix Analysis
- 4.5. Supply Chain Analysis
- 4.6. Regulatory Landscape
- 4.7. Current Market Potential and Opportunity Assessment (TAM–SAM–SOM Framework)
- 4.8. RAX Analyst Note
- 4.1. Porters Five Forces
- 5. Market Analysis, Insights and Forecast 2021-2033
- 5.1. Market Analysis, Insights and Forecast - by Technology
- 5.1.1. Batteries
- 5.1.2. Other Energy Storage System Technologies
- 5.2. Market Analysis, Insights and Forecast - by Phase
- 5.2.1. Single Phase
- 5.2.2. Three Phase
- 5.3. Market Analysis, Insights and Forecast - by End User
- 5.3.1. Residential
- 5.3.2. Commercial and Industrial
- 5.4. Market Analysis, Insights and Forecast - by Region
- 5.4.1. North America
- 5.4.2. South America
- 5.4.3. Europe
- 5.4.4. Middle East & Africa
- 5.4.5. Asia Pacific
- 5.1. Market Analysis, Insights and Forecast - by Technology
- 6. Global US Energy Storage Market Analysis, Insights and Forecast, 2021-2033
- 6.1. Market Analysis, Insights and Forecast - by Technology
- 6.1.1. Batteries
- 6.1.2. Other Energy Storage System Technologies
- 6.2. Market Analysis, Insights and Forecast - by Phase
- 6.2.1. Single Phase
- 6.2.2. Three Phase
- 6.3. Market Analysis, Insights and Forecast - by End User
- 6.3.1. Residential
- 6.3.2. Commercial and Industrial
- 6.1. Market Analysis, Insights and Forecast - by Technology
- 7. North America US Energy Storage Market Analysis, Insights and Forecast, 2020-2032
- 7.1. Market Analysis, Insights and Forecast - by Technology
- 7.1.1. Batteries
- 7.1.2. Other Energy Storage System Technologies
- 7.2. Market Analysis, Insights and Forecast - by Phase
- 7.2.1. Single Phase
- 7.2.2. Three Phase
- 7.3. Market Analysis, Insights and Forecast - by End User
- 7.3.1. Residential
- 7.3.2. Commercial and Industrial
- 7.1. Market Analysis, Insights and Forecast - by Technology
- 8. South America US Energy Storage Market Analysis, Insights and Forecast, 2020-2032
- 8.1. Market Analysis, Insights and Forecast - by Technology
- 8.1.1. Batteries
- 8.1.2. Other Energy Storage System Technologies
- 8.2. Market Analysis, Insights and Forecast - by Phase
- 8.2.1. Single Phase
- 8.2.2. Three Phase
- 8.3. Market Analysis, Insights and Forecast - by End User
- 8.3.1. Residential
- 8.3.2. Commercial and Industrial
- 8.1. Market Analysis, Insights and Forecast - by Technology
- 9. Europe US Energy Storage Market Analysis, Insights and Forecast, 2020-2032
- 9.1. Market Analysis, Insights and Forecast - by Technology
- 9.1.1. Batteries
- 9.1.2. Other Energy Storage System Technologies
- 9.2. Market Analysis, Insights and Forecast - by Phase
- 9.2.1. Single Phase
- 9.2.2. Three Phase
- 9.3. Market Analysis, Insights and Forecast - by End User
- 9.3.1. Residential
- 9.3.2. Commercial and Industrial
- 9.1. Market Analysis, Insights and Forecast - by Technology
- 10. Middle East & Africa US Energy Storage Market Analysis, Insights and Forecast, 2020-2032
- 10.1. Market Analysis, Insights and Forecast - by Technology
- 10.1.1. Batteries
- 10.1.2. Other Energy Storage System Technologies
- 10.2. Market Analysis, Insights and Forecast - by Phase
- 10.2.1. Single Phase
- 10.2.2. Three Phase
- 10.3. Market Analysis, Insights and Forecast - by End User
- 10.3.1. Residential
- 10.3.2. Commercial and Industrial
- 10.1. Market Analysis, Insights and Forecast - by Technology
- 11. Asia Pacific US Energy Storage Market Analysis, Insights and Forecast, 2020-2032
- 11.1. Market Analysis, Insights and Forecast - by Technology
- 11.1.1. Batteries
- 11.1.2. Other Energy Storage System Technologies
- 11.2. Market Analysis, Insights and Forecast - by Phase
- 11.2.1. Single Phase
- 11.2.2. Three Phase
- 11.3. Market Analysis, Insights and Forecast - by End User
- 11.3.1. Residential
- 11.3.2. Commercial and Industrial
- 11.1. Market Analysis, Insights and Forecast - by Technology
- 12. Competitive Analysis
- 12.1. Company Profiles
- 12.1.1 BYD Co Ltd
- 12.1.1.1. Company Overview
- 12.1.1.2. Products
- 12.1.1.3. Company Financials
- 12.1.1.4. SWOT Analysis
- 12.1.2 LG Energy Solution Ltd
- 12.1.2.1. Company Overview
- 12.1.2.2. Products
- 12.1.2.3. Company Financials
- 12.1.2.4. SWOT Analysis
- 12.1.3 Voith GmbH & Co KGaA
- 12.1.3.1. Company Overview
- 12.1.3.2. Products
- 12.1.3.3. Company Financials
- 12.1.3.4. SWOT Analysis
- 12.1.4 Tesla Inc
- 12.1.4.1. Company Overview
- 12.1.4.2. Products
- 12.1.4.3. Company Financials
- 12.1.4.4. SWOT Analysis
- 12.1.5 Siemens Energy AG
- 12.1.5.1. Company Overview
- 12.1.5.2. Products
- 12.1.5.3. Company Financials
- 12.1.5.4. SWOT Analysis
- 12.1.6 Sungrow Power Supply Co Ltd
- 12.1.6.1. Company Overview
- 12.1.6.2. Products
- 12.1.6.3. Company Financials
- 12.1.6.4. SWOT Analysis
- 12.1.7 Fluence Energy*List Not Exhaustive
- 12.1.7.1. Company Overview
- 12.1.7.2. Products
- 12.1.7.3. Company Financials
- 12.1.7.4. SWOT Analysis
- 12.1.8 Andritz AG
- 12.1.8.1. Company Overview
- 12.1.8.2. Products
- 12.1.8.3. Company Financials
- 12.1.8.4. SWOT Analysis
- 12.1.9 Enphase Energy
- 12.1.9.1. Company Overview
- 12.1.9.2. Products
- 12.1.9.3. Company Financials
- 12.1.9.4. SWOT Analysis
- 12.1.10 Sonnen GmbH
- 12.1.10.1. Company Overview
- 12.1.10.2. Products
- 12.1.10.3. Company Financials
- 12.1.10.4. SWOT Analysis
- 12.1.1 BYD Co Ltd
- 12.2. Market Entropy
- 12.2.1 Company's Key Areas Served
- 12.2.2 Recent Developments
- 12.3. Company Market Share Analysis 2025
- 12.3.1 Top 5 Companies Market Share Analysis
- 12.3.2 Top 3 Companies Market Share Analysis
- 12.4. List of Potential Customers
- 13. Research Methodology
List of Figures
- Figure 1: Global US Energy Storage Market Revenue Breakdown (billion, %) by Region 2025 & 2033
- Figure 2: North America US Energy Storage Market Revenue (billion), by Technology 2025 & 2033
- Figure 3: North America US Energy Storage Market Revenue Share (%), by Technology 2025 & 2033
- Figure 4: North America US Energy Storage Market Revenue (billion), by Phase 2025 & 2033
- Figure 5: North America US Energy Storage Market Revenue Share (%), by Phase 2025 & 2033
- Figure 6: North America US Energy Storage Market Revenue (billion), by End User 2025 & 2033
- Figure 7: North America US Energy Storage Market Revenue Share (%), by End User 2025 & 2033
- Figure 8: North America US Energy Storage Market Revenue (billion), by Country 2025 & 2033
- Figure 9: North America US Energy Storage Market Revenue Share (%), by Country 2025 & 2033
- Figure 10: South America US Energy Storage Market Revenue (billion), by Technology 2025 & 2033
- Figure 11: South America US Energy Storage Market Revenue Share (%), by Technology 2025 & 2033
- Figure 12: South America US Energy Storage Market Revenue (billion), by Phase 2025 & 2033
- Figure 13: South America US Energy Storage Market Revenue Share (%), by Phase 2025 & 2033
- Figure 14: South America US Energy Storage Market Revenue (billion), by End User 2025 & 2033
- Figure 15: South America US Energy Storage Market Revenue Share (%), by End User 2025 & 2033
- Figure 16: South America US Energy Storage Market Revenue (billion), by Country 2025 & 2033
- Figure 17: South America US Energy Storage Market Revenue Share (%), by Country 2025 & 2033
- Figure 18: Europe US Energy Storage Market Revenue (billion), by Technology 2025 & 2033
- Figure 19: Europe US Energy Storage Market Revenue Share (%), by Technology 2025 & 2033
- Figure 20: Europe US Energy Storage Market Revenue (billion), by Phase 2025 & 2033
- Figure 21: Europe US Energy Storage Market Revenue Share (%), by Phase 2025 & 2033
- Figure 22: Europe US Energy Storage Market Revenue (billion), by End User 2025 & 2033
- Figure 23: Europe US Energy Storage Market Revenue Share (%), by End User 2025 & 2033
- Figure 24: Europe US Energy Storage Market Revenue (billion), by Country 2025 & 2033
- Figure 25: Europe US Energy Storage Market Revenue Share (%), by Country 2025 & 2033
- Figure 26: Middle East & Africa US Energy Storage Market Revenue (billion), by Technology 2025 & 2033
- Figure 27: Middle East & Africa US Energy Storage Market Revenue Share (%), by Technology 2025 & 2033
- Figure 28: Middle East & Africa US Energy Storage Market Revenue (billion), by Phase 2025 & 2033
- Figure 29: Middle East & Africa US Energy Storage Market Revenue Share (%), by Phase 2025 & 2033
- Figure 30: Middle East & Africa US Energy Storage Market Revenue (billion), by End User 2025 & 2033
- Figure 31: Middle East & Africa US Energy Storage Market Revenue Share (%), by End User 2025 & 2033
- Figure 32: Middle East & Africa US Energy Storage Market Revenue (billion), by Country 2025 & 2033
- Figure 33: Middle East & Africa US Energy Storage Market Revenue Share (%), by Country 2025 & 2033
- Figure 34: Asia Pacific US Energy Storage Market Revenue (billion), by Technology 2025 & 2033
- Figure 35: Asia Pacific US Energy Storage Market Revenue Share (%), by Technology 2025 & 2033
- Figure 36: Asia Pacific US Energy Storage Market Revenue (billion), by Phase 2025 & 2033
- Figure 37: Asia Pacific US Energy Storage Market Revenue Share (%), by Phase 2025 & 2033
- Figure 38: Asia Pacific US Energy Storage Market Revenue (billion), by End User 2025 & 2033
- Figure 39: Asia Pacific US Energy Storage Market Revenue Share (%), by End User 2025 & 2033
- Figure 40: Asia Pacific US Energy Storage Market Revenue (billion), by Country 2025 & 2033
- Figure 41: Asia Pacific US Energy Storage Market Revenue Share (%), by Country 2025 & 2033
List of Tables
- Table 1: Global US Energy Storage Market Revenue billion Forecast, by Technology 2020 & 2033
- Table 2: Global US Energy Storage Market Revenue billion Forecast, by Phase 2020 & 2033
- Table 3: Global US Energy Storage Market Revenue billion Forecast, by End User 2020 & 2033
- Table 4: Global US Energy Storage Market Revenue billion Forecast, by Region 2020 & 2033
- Table 5: Global US Energy Storage Market Revenue billion Forecast, by Technology 2020 & 2033
- Table 6: Global US Energy Storage Market Revenue billion Forecast, by Phase 2020 & 2033
- Table 7: Global US Energy Storage Market Revenue billion Forecast, by End User 2020 & 2033
- Table 8: Global US Energy Storage Market Revenue billion Forecast, by Country 2020 & 2033
- Table 9: United States US Energy Storage Market Revenue (billion) Forecast, by Application 2020 & 2033
- Table 10: Canada US Energy Storage Market Revenue (billion) Forecast, by Application 2020 & 2033
- Table 11: Mexico US Energy Storage Market Revenue (billion) Forecast, by Application 2020 & 2033
- Table 12: Global US Energy Storage Market Revenue billion Forecast, by Technology 2020 & 2033
- Table 13: Global US Energy Storage Market Revenue billion Forecast, by Phase 2020 & 2033
- Table 14: Global US Energy Storage Market Revenue billion Forecast, by End User 2020 & 2033
- Table 15: Global US Energy Storage Market Revenue billion Forecast, by Country 2020 & 2033
- Table 16: Brazil US Energy Storage Market Revenue (billion) Forecast, by Application 2020 & 2033
- Table 17: Argentina US Energy Storage Market Revenue (billion) Forecast, by Application 2020 & 2033
- Table 18: Rest of South America US Energy Storage Market Revenue (billion) Forecast, by Application 2020 & 2033
- Table 19: Global US Energy Storage Market Revenue billion Forecast, by Technology 2020 & 2033
- Table 20: Global US Energy Storage Market Revenue billion Forecast, by Phase 2020 & 2033
- Table 21: Global US Energy Storage Market Revenue billion Forecast, by End User 2020 & 2033
- Table 22: Global US Energy Storage Market Revenue billion Forecast, by Country 2020 & 2033
- Table 23: United Kingdom US Energy Storage Market Revenue (billion) Forecast, by Application 2020 & 2033
- Table 24: Germany US Energy Storage Market Revenue (billion) Forecast, by Application 2020 & 2033
- Table 25: France US Energy Storage Market Revenue (billion) Forecast, by Application 2020 & 2033
- Table 26: Italy US Energy Storage Market Revenue (billion) Forecast, by Application 2020 & 2033
- Table 27: Spain US Energy Storage Market Revenue (billion) Forecast, by Application 2020 & 2033
- Table 28: Russia US Energy Storage Market Revenue (billion) Forecast, by Application 2020 & 2033
- Table 29: Benelux US Energy Storage Market Revenue (billion) Forecast, by Application 2020 & 2033
- Table 30: Nordics US Energy Storage Market Revenue (billion) Forecast, by Application 2020 & 2033
- Table 31: Rest of Europe US Energy Storage Market Revenue (billion) Forecast, by Application 2020 & 2033
- Table 32: Global US Energy Storage Market Revenue billion Forecast, by Technology 2020 & 2033
- Table 33: Global US Energy Storage Market Revenue billion Forecast, by Phase 2020 & 2033
- Table 34: Global US Energy Storage Market Revenue billion Forecast, by End User 2020 & 2033
- Table 35: Global US Energy Storage Market Revenue billion Forecast, by Country 2020 & 2033
- Table 36: Turkey US Energy Storage Market Revenue (billion) Forecast, by Application 2020 & 2033
- Table 37: Israel US Energy Storage Market Revenue (billion) Forecast, by Application 2020 & 2033
- Table 38: GCC US Energy Storage Market Revenue (billion) Forecast, by Application 2020 & 2033
- Table 39: North Africa US Energy Storage Market Revenue (billion) Forecast, by Application 2020 & 2033
- Table 40: South Africa US Energy Storage Market Revenue (billion) Forecast, by Application 2020 & 2033
- Table 41: Rest of Middle East & Africa US Energy Storage Market Revenue (billion) Forecast, by Application 2020 & 2033
- Table 42: Global US Energy Storage Market Revenue billion Forecast, by Technology 2020 & 2033
- Table 43: Global US Energy Storage Market Revenue billion Forecast, by Phase 2020 & 2033
- Table 44: Global US Energy Storage Market Revenue billion Forecast, by End User 2020 & 2033
- Table 45: Global US Energy Storage Market Revenue billion Forecast, by Country 2020 & 2033
- Table 46: China US Energy Storage Market Revenue (billion) Forecast, by Application 2020 & 2033
- Table 47: India US Energy Storage Market Revenue (billion) Forecast, by Application 2020 & 2033
- Table 48: Japan US Energy Storage Market Revenue (billion) Forecast, by Application 2020 & 2033
- Table 49: South Korea US Energy Storage Market Revenue (billion) Forecast, by Application 2020 & 2033
- Table 50: ASEAN US Energy Storage Market Revenue (billion) Forecast, by Application 2020 & 2033
- Table 51: Oceania US Energy Storage Market Revenue (billion) Forecast, by Application 2020 & 2033
- Table 52: Rest of Asia Pacific US Energy Storage Market Revenue (billion) Forecast, by Application 2020 & 2033
Frequently Asked Questions
1. What is the projected Compound Annual Growth Rate (CAGR) of the US Energy Storage Market?
The projected CAGR is approximately 29.1%.
2. Which companies are prominent players in the US Energy Storage Market?
Key companies in the market include BYD Co Ltd, LG Energy Solution Ltd, Voith GmbH & Co KGaA, Tesla Inc, Siemens Energy AG, Sungrow Power Supply Co Ltd, Fluence Energy*List Not Exhaustive, Andritz AG, Enphase Energy, Sonnen GmbH.
3. What are the main segments of the US Energy Storage Market?
The market segments include Technology, Phase, End User.
4. Can you provide details about the market size?
The market size is estimated to be USD 106.7 billion as of 2022.
5. What are some drivers contributing to market growth?
4.; The High Amount of Waste Generation in the Country4.; The growing Focus on Non-Fossil Fuel Sources.
6. What are the notable trends driving market growth?
Residential Segment Expected to Dominate the Market.
7. Are there any restraints impacting market growth?
4.; The Recycling Rate of Waste in Germany.
8. Can you provide examples of recent developments in the market?
In March 2021, Apple inspired the entire corporate world by setting up a solar farm to power its headquarters in California, the United States, and installing rooftop solar panels for its manufacturing park in the city. The company announced that the initiative has been taken by not only one arm, but its 110 manufacturing partners around the globe, which are switching to renewable options to power their infrastructure. It has also implemented a new energy storage project in California to pilot new solutions for renewable infrastructure.
9. What pricing options are available for accessing the report?
Pricing options include single-user, multi-user, and enterprise licenses priced at USD 3800, USD 4500, and USD 5800 respectively.
10. Is the market size provided in terms of value or volume?
The market size is provided in terms of value, measured in billion.
11. Are there any specific market keywords associated with the report?
Yes, the market keyword associated with the report is "US Energy Storage Market," which aids in identifying and referencing the specific market segment covered.
12. How do I determine which pricing option suits my needs best?
The pricing options vary based on user requirements and access needs. Individual users may opt for single-user licenses, while businesses requiring broader access may choose multi-user or enterprise licenses for cost-effective access to the report.
13. Are there any additional resources or data provided in the US Energy Storage Market report?
While the report offers comprehensive insights, it's advisable to review the specific contents or supplementary materials provided to ascertain if additional resources or data are available.
14. How can I stay updated on further developments or reports in the US Energy Storage Market?
To stay informed about further developments, trends, and reports in the US Energy Storage Market, consider subscribing to industry newsletters, following relevant companies and organizations, or regularly checking reputable industry news sources and publications.
Methodology
Step 1 - Identification of Relevant Samples Size from Population Database


Step 2 - Approaches for Defining Global Market Size (Value, Volume* & Price*)

Note*: In applicable scenarios
Step 3 - Data Sources
Primary Research
- Web Analytics
- Survey Reports
- Research Institute
- Latest Research Reports
- Opinion Leaders
Secondary Research
- Annual Reports
- White Paper
- Latest Press Release
- Industry Association
- Paid Database
- Investor Presentations

Step 4 - Data Triangulation
Involves using different sources of information in order to increase the validity of a study
These sources are likely to be stakeholders in a program - participants, other researchers, program staff, other community members, and so on.
Then we put all data in single framework & apply various statistical tools to find out the dynamic on the market.
During the analysis stage, feedback from the stakeholder groups would be compared to determine areas of agreement as well as areas of divergence