
Key Insights
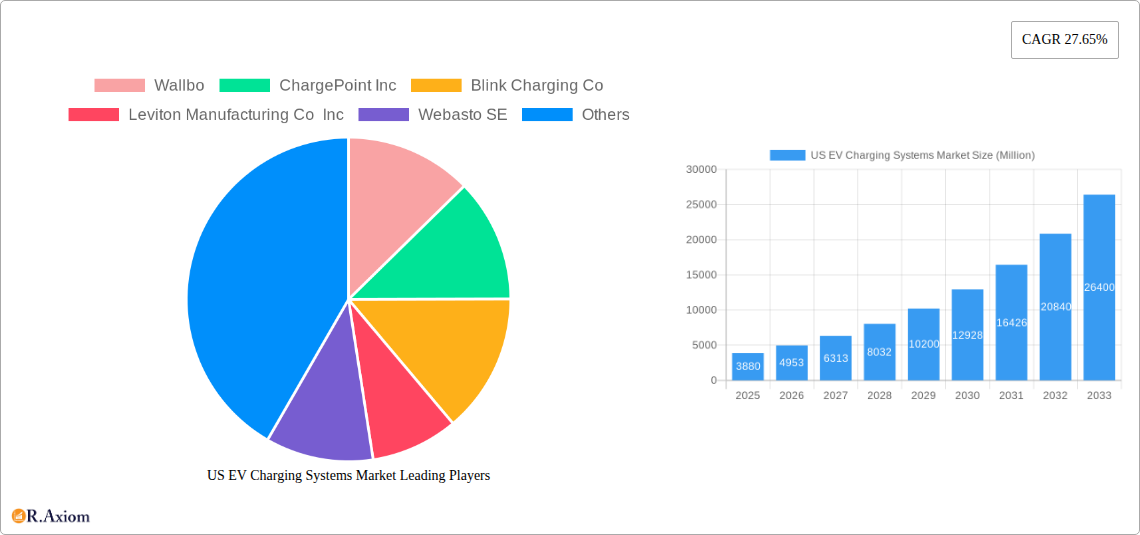
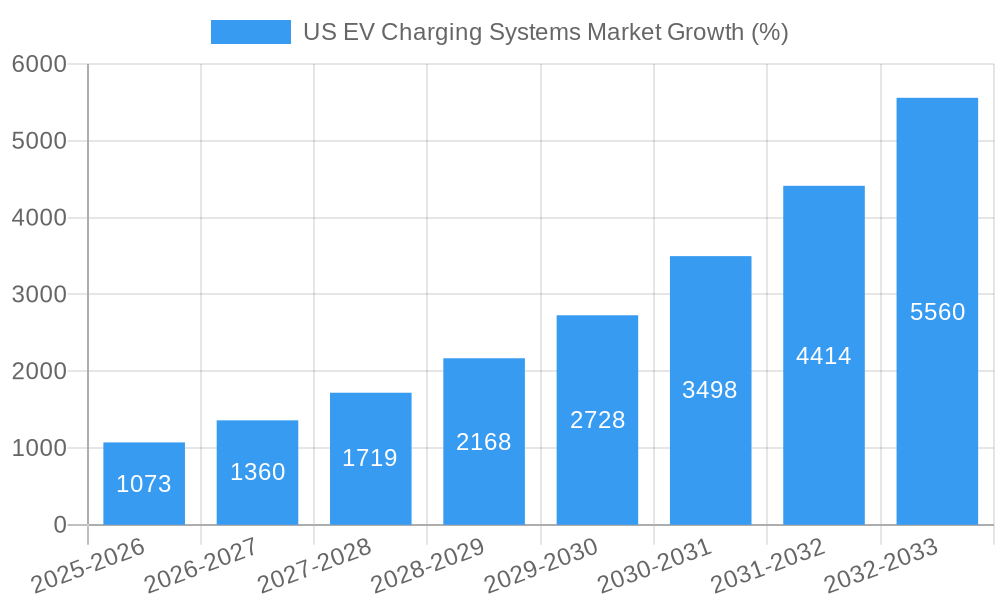
The US EV charging systems market is experiencing robust growth, driven by the increasing adoption of electric vehicles (EVs) and supportive government policies promoting clean energy transportation. The market, valued at $3.88 billion in 2025, is projected to expand significantly over the forecast period (2025-2033), with a Compound Annual Growth Rate (CAGR) of 27.65%. This growth is fueled by several key factors. Firstly, the expanding EV fleet necessitates a commensurate increase in charging infrastructure. Secondly, technological advancements are leading to faster charging speeds and improved charging system efficiency, boosting consumer adoption. Thirdly, government incentives, such as tax credits and subsidies for both EV purchases and charging station installations, are accelerating market expansion. Finally, increasing environmental awareness and the need to reduce carbon emissions are further driving demand.
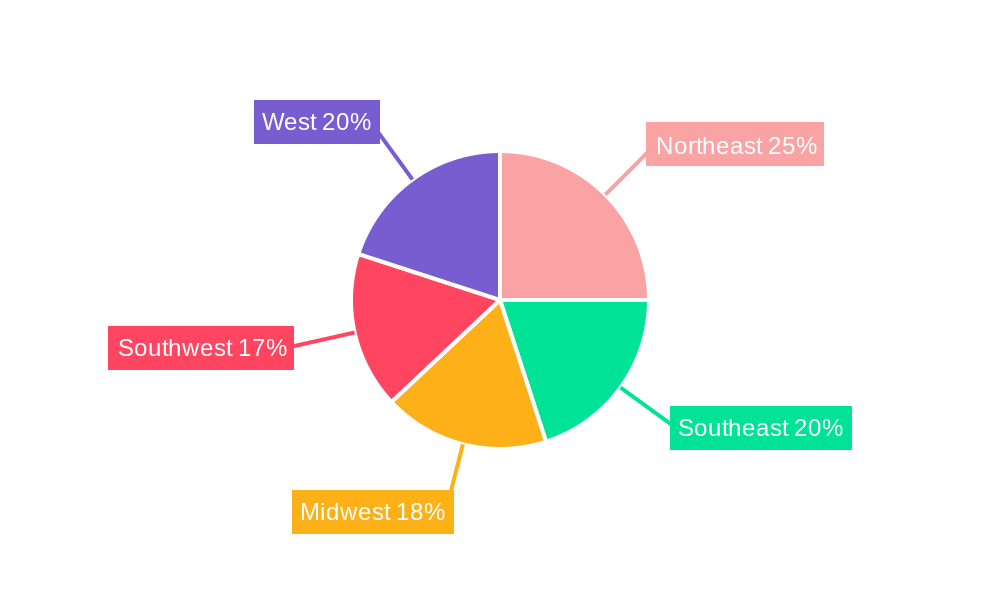
Market segmentation reveals diverse growth opportunities. The public charging segment is expected to dominate due to the convenience it offers EV drivers. Within equipment types, charging stations and pillars will likely hold the largest share, followed by chargers and inverters. Passenger cars are the primary driver of demand within vehicle types, while fast and rapid charging systems are gaining traction due to their time-saving benefits. Regional variations exist within the US, with densely populated areas like the Northeast and West likely experiencing faster growth compared to other regions. Key players, including Wallbox, ChargePoint, Blink Charging, and Tesla, are actively investing in expanding their infrastructure and technological capabilities to meet the rising demand, creating a competitive landscape. This robust growth trajectory is expected to continue, supported by sustained government support, technological progress, and the increasing popularity of EVs.
US EV Charging Systems Market: A Comprehensive Report (2019-2033)
This detailed report provides a comprehensive analysis of the US EV charging systems market, covering historical data (2019-2024), the current market (2025), and future projections (2025-2033). The report offers actionable insights for stakeholders, including manufacturers, investors, and policymakers, by examining market dynamics, competitive landscapes, and emerging opportunities. The market is segmented by application type, equipment type, vehicle type, and charging system type, providing a granular understanding of market trends and growth potential. The report also analyzes key industry developments, including significant investments and product launches. The total market size is projected to reach xx Million by 2033.
US EV Charging Systems Market Market Concentration & Innovation
The US EV charging systems market exhibits a moderately concentrated landscape, with key players like ChargePoint, Blink Charging, and Tesla holding significant market share. However, several smaller companies are actively innovating, leading to increased competition. Market share is influenced by factors such as technological advancements, charging network coverage, and government incentives. The estimated market share for ChargePoint in 2025 is xx%, while Blink Charging holds approximately xx% and Tesla approximately xx%.
Innovation is a crucial driver, fueled by the need for higher charging speeds, improved reliability, and smart charging solutions. Regulatory frameworks, such as the National Electric Vehicle Infrastructure (NEVI) program, significantly shape the market by providing funding for infrastructure development. The increasing adoption of EVs and government initiatives to reduce carbon emissions also stimulate innovation.
Product substitutes, such as gasoline-powered vehicles, face increasing pressure due to environmental concerns and government policies. However, competition exists between different charging technologies and among EV charging providers, who are vying for market share through strategic partnerships, technology development, and expansion of charging networks. The market has witnessed considerable M&A activity in recent years, with deals focusing on expanding charging networks and acquiring specialized technologies. The total value of M&A deals in the period 2019-2024 is estimated at xx Million. Examples of key M&A activities are [list specific examples if available, otherwise, indicate "Data unavailable"]. End-user trends are shifting towards faster charging speeds and convenient charging solutions, influencing the demand for rapid and fast charging systems.
US EV Charging Systems Market Industry Trends & Insights
The US EV charging systems market is experiencing robust growth, driven primarily by the increasing adoption of electric vehicles (EVs) and supportive government policies. The compound annual growth rate (CAGR) is projected to be xx% during the forecast period (2025-2033). Market penetration is increasing steadily, with a significant rise expected in both residential and commercial sectors. Technological advancements, particularly in battery technology and charging infrastructure, are contributing to the market expansion. Improvements in charging speed, efficiency, and reliability are making EVs more appealing to consumers.
Consumer preferences are evolving towards convenient and fast charging options. This fuels demand for fast-charging stations strategically located in public areas and along major transportation routes. The competitive landscape is characterized by intense rivalry, particularly among large charging network operators who are aggressively expanding their infrastructure and deploying innovative technologies. This competition benefits consumers through better pricing, enhanced charging experiences, and a wider range of charging options. The market is segmented by application type, equipment type, vehicle type, and charging system type.
Dominant Markets & Segments in US EV Charging Systems Market
Leading Region/State: California, due to its strong EV adoption rate, supportive policies, and significant investments in charging infrastructure, remains the dominant market. Other states with substantial growth include Texas, Florida, and New York.
By Application Type: The public charging segment dominates, driven by the increasing need for charging stations in public spaces, such as shopping malls, restaurants, and along highways. However, the private (residential and commercial) segment is also expanding rapidly due to increasing EV ownership and the need for convenient home and workplace charging.
By Equipment Type: Pillar/Charging Station/Dock are the dominant equipment type due to their widespread use in both public and private settings. DC chargers are gaining popularity due to their faster charging speeds, but the cost remains a factor limiting broader adoption.
By Vehicle Type: Passenger cars currently represent the largest segment. However, the commercial vehicle segment is expected to experience significant growth in the coming years driven by the increasing adoption of electric trucks and buses.
By Charging System Type: Fast charging systems are gaining significant traction due to their increased speed and efficiency. Rapid charging systems are also becoming increasingly popular, particularly in high-traffic areas.
Key drivers for the dominance of these segments include favorable government policies, substantial investments in infrastructure, and the rising demand for convenient and fast charging solutions. California’s strong performance can be attributed to its early adoption of EV incentives, stricter emission regulations, and well-established charging network. Economic policies promoting EV adoption, robust charging infrastructure development, and increased consumer awareness collectively contribute to market growth.
US EV Charging Systems Market Product Developments
Recent product innovations focus on improving charging speeds, enhancing reliability, and integrating smart charging technologies. Wallbox's Pulsar Pro North America and Supernova 180 chargers are notable examples of advancements aimed at improving both residential/commercial and fast-charging ecosystems. These innovations highlight a trend towards increased charging speed and convenient smart charging solutions, improving the overall EV charging experience and accelerating market adoption. This technological advancement improves market fit by addressing user concerns regarding charging time and convenience, particularly for fast-charging needs.
Report Scope & Segmentation Analysis
This report analyzes the US EV charging systems market across various segments:
By Application Type: Public, Private (Residential and Commercial). The public segment is expected to show xx% growth, while the private segment is projected to grow at xx%.
By Equipment Type: Pillar/Charging Station/Dock, Inverter, Charger, DC Charger, Others (Cord, Port, etc.). The Pillar/Charging Station/Dock segment will account for xx% of the market in 2033. DC charger adoption will increase due to its speed advantage.
By Vehicle Type: Passenger Cars and Commercial Vehicles. Passenger cars currently dominate, but the commercial vehicle segment is expected to witness substantial growth driven by the increase in electric trucks and buses.
By Charging System Type: Slow Charging Systems, Fast Charging Systems, Rapid Charging Systems. Fast and rapid charging systems are anticipated to have higher growth rates due to user preference for shorter charging times.
Key Drivers of US EV Charging Systems Market Growth
The US EV charging systems market is driven by several key factors:
- Government incentives and regulations: The NEVI program and other state-level initiatives are crucial in accelerating the deployment of charging stations.
- Rising EV adoption: The increasing popularity of electric vehicles is fueling the demand for charging infrastructure.
- Technological advancements: Innovations in battery technology, charging systems, and smart grid integration are improving the efficiency and convenience of EV charging.
- Environmental concerns: The growing awareness of climate change is driving the shift towards cleaner transportation options, thus supporting EV adoption and the need for charging infrastructure.
Challenges in the US EV Charging Systems Market Sector
Several challenges hinder the growth of the US EV charging systems market:
- High initial investment costs: The cost of setting up charging stations remains a significant barrier, particularly for rapid charging systems.
- Interoperability issues: Lack of standardization in charging technologies can create compatibility problems.
- Uneven geographical distribution: The availability of charging stations is not uniform across the country, hindering EV adoption in certain regions.
- Grid infrastructure limitations: The capacity of the existing electricity grid needs to be upgraded to support the increased demand from EV charging. The impact of these issues can result in slower than expected market growth, particularly in specific regions where infrastructure investments are lagging.
Emerging Opportunities in US EV Charging Systems Market
The US EV charging systems market presents several emerging opportunities:
- Smart charging technologies: Integrating smart grid technologies can optimize charging schedules, reduce grid strain, and improve overall efficiency.
- Vehicle-to-grid (V2G) technology: This technology allows EVs to feed electricity back into the grid, creating a potential revenue stream for EV owners.
- Expansion into rural areas: The deployment of charging infrastructure in underserved areas can significantly boost EV adoption.
- Growth in commercial vehicle charging: The electrification of commercial fleets is driving the demand for high-power charging solutions.
These opportunities represent future growth potential and will shape the market dynamics in the years to come.
Leading Players in the US EV Charging Systems Market Market
- Wallbox
- ChargePoint Inc
- Blink Charging Co
- Leviton Manufacturing Co Inc
- Webasto SE
- Siemens AG
- Schneider Electric SE
- ABB Group
- Tesla Inc
- EVBox Group
- EvoCharge Inc
- Eaton Corporation
Key Developments in US EV Charging Systems Market Industry
- March 2024: Wallbox announced the launch of Pulsar Pro North America and Supernova 180 DC fast charger, expanding its product portfolio and strengthening its position in the US market.
- January 2024: The US government announced a USD 623 Million investment to deploy electric vehicle charging points across 22 states, boosting charging infrastructure development.
- January 2024: The US Transportation Department announced USD 148.8 Million in funding to replace or repair 4,500 existing EV charging stations in 20 states, improving the reliability of existing infrastructure.
These developments reflect the strong government support and industry innovation driving the growth of the US EV charging systems market.
Strategic Outlook for US EV Charging Systems Market Market
The US EV charging systems market is poised for significant growth in the coming years, driven by supportive government policies, increasing EV adoption, and technological advancements. The continued expansion of charging networks, particularly in underserved areas, will be critical in driving market penetration. Smart charging technologies and V2G capabilities offer promising opportunities for innovation and improved grid integration. The market's future success will depend on overcoming challenges related to infrastructure costs, interoperability, and grid capacity. The focus on developing robust and reliable charging infrastructure will be crucial in attracting wider EV adoption and accelerating the transition to sustainable transportation.
US EV Charging Systems Market Segmentation
-
1. Application Type
- 1.1. Public
- 1.2. Private (Residential and Commercial)
-
2. Equipment Type
- 2.1. Pillar/Charging Station/Dock
- 2.2. Inverter
-
2.3. Charger
- 2.3.1. AC Charger
- 2.3.2. DC Charger
- 2.4. Others (Cord, Port, etc.)
-
3. Vehicle Type
- 3.1. Passenger Cars
- 3.2. Commercial Vehicles
-
4. Charging System Type
- 4.1. Slow Charging Systems
- 4.2. Fast Charging Systems
- 4.3. Rapid Charging Systems
US EV Charging Systems Market Segmentation By Geography
-
1. North America
- 1.1. United States
- 1.2. Canada
- 1.3. Mexico
-
2. South America
- 2.1. Brazil
- 2.2. Argentina
- 2.3. Rest of South America
-
3. Europe
- 3.1. United Kingdom
- 3.2. Germany
- 3.3. France
- 3.4. Italy
- 3.5. Spain
- 3.6. Russia
- 3.7. Benelux
- 3.8. Nordics
- 3.9. Rest of Europe
-
4. Middle East & Africa
- 4.1. Turkey
- 4.2. Israel
- 4.3. GCC
- 4.4. North Africa
- 4.5. South Africa
- 4.6. Rest of Middle East & Africa
-
5. Asia Pacific
- 5.1. China
- 5.2. India
- 5.3. Japan
- 5.4. South Korea
- 5.5. ASEAN
- 5.6. Oceania
- 5.7. Rest of Asia Pacific
US EV Charging Systems Market REPORT HIGHLIGHTS
| Aspects | Details |
|---|---|
| Study Period | 2019-2033 |
| Base Year | 2024 |
| Estimated Year | 2025 |
| Forecast Period | 2025-2033 |
| Historical Period | 2019-2024 |
| Growth Rate | CAGR of 27.65% from 2019-2033 |
| Segmentation |
|
Table of Contents
- 1. Introduction
- 1.1. Research Scope
- 1.2. Market Segmentation
- 1.3. Research Methodology
- 1.4. Definitions and Assumptions
- 2. Executive Summary
- 2.1. Introduction
- 3. Market Dynamics
- 3.1. Introduction
- 3.2. Market Drivers
- 3.2.1. Aggressive Government Focus to Promote the Adoption of Electric Vehicles Fosters the Growth of the Market
- 3.3. Market Restrains
- 3.3.1. High Cost of Setting Up EV Charging Stations Hampers the Growth of the Market
- 3.4. Market Trends
- 3.4.1. Passengers Cars Segment to Gain Traction during the Forecast Period
- 4. Market Factor Analysis
- 4.1. Porters Five Forces
- 4.2. Supply/Value Chain
- 4.3. PESTEL analysis
- 4.4. Market Entropy
- 4.5. Patent/Trademark Analysis
- 5. Global US EV Charging Systems Market Analysis, Insights and Forecast, 2019-2031
- 5.1. Market Analysis, Insights and Forecast - by Application Type
- 5.1.1. Public
- 5.1.2. Private (Residential and Commercial)
- 5.2. Market Analysis, Insights and Forecast - by Equipment Type
- 5.2.1. Pillar/Charging Station/Dock
- 5.2.2. Inverter
- 5.2.3. Charger
- 5.2.3.1. AC Charger
- 5.2.3.2. DC Charger
- 5.2.4. Others (Cord, Port, etc.)
- 5.3. Market Analysis, Insights and Forecast - by Vehicle Type
- 5.3.1. Passenger Cars
- 5.3.2. Commercial Vehicles
- 5.4. Market Analysis, Insights and Forecast - by Charging System Type
- 5.4.1. Slow Charging Systems
- 5.4.2. Fast Charging Systems
- 5.4.3. Rapid Charging Systems
- 5.5. Market Analysis, Insights and Forecast - by Region
- 5.5.1. North America
- 5.5.2. South America
- 5.5.3. Europe
- 5.5.4. Middle East & Africa
- 5.5.5. Asia Pacific
- 5.1. Market Analysis, Insights and Forecast - by Application Type
- 6. North America US EV Charging Systems Market Analysis, Insights and Forecast, 2019-2031
- 6.1. Market Analysis, Insights and Forecast - by Application Type
- 6.1.1. Public
- 6.1.2. Private (Residential and Commercial)
- 6.2. Market Analysis, Insights and Forecast - by Equipment Type
- 6.2.1. Pillar/Charging Station/Dock
- 6.2.2. Inverter
- 6.2.3. Charger
- 6.2.3.1. AC Charger
- 6.2.3.2. DC Charger
- 6.2.4. Others (Cord, Port, etc.)
- 6.3. Market Analysis, Insights and Forecast - by Vehicle Type
- 6.3.1. Passenger Cars
- 6.3.2. Commercial Vehicles
- 6.4. Market Analysis, Insights and Forecast - by Charging System Type
- 6.4.1. Slow Charging Systems
- 6.4.2. Fast Charging Systems
- 6.4.3. Rapid Charging Systems
- 6.1. Market Analysis, Insights and Forecast - by Application Type
- 7. South America US EV Charging Systems Market Analysis, Insights and Forecast, 2019-2031
- 7.1. Market Analysis, Insights and Forecast - by Application Type
- 7.1.1. Public
- 7.1.2. Private (Residential and Commercial)
- 7.2. Market Analysis, Insights and Forecast - by Equipment Type
- 7.2.1. Pillar/Charging Station/Dock
- 7.2.2. Inverter
- 7.2.3. Charger
- 7.2.3.1. AC Charger
- 7.2.3.2. DC Charger
- 7.2.4. Others (Cord, Port, etc.)
- 7.3. Market Analysis, Insights and Forecast - by Vehicle Type
- 7.3.1. Passenger Cars
- 7.3.2. Commercial Vehicles
- 7.4. Market Analysis, Insights and Forecast - by Charging System Type
- 7.4.1. Slow Charging Systems
- 7.4.2. Fast Charging Systems
- 7.4.3. Rapid Charging Systems
- 7.1. Market Analysis, Insights and Forecast - by Application Type
- 8. Europe US EV Charging Systems Market Analysis, Insights and Forecast, 2019-2031
- 8.1. Market Analysis, Insights and Forecast - by Application Type
- 8.1.1. Public
- 8.1.2. Private (Residential and Commercial)
- 8.2. Market Analysis, Insights and Forecast - by Equipment Type
- 8.2.1. Pillar/Charging Station/Dock
- 8.2.2. Inverter
- 8.2.3. Charger
- 8.2.3.1. AC Charger
- 8.2.3.2. DC Charger
- 8.2.4. Others (Cord, Port, etc.)
- 8.3. Market Analysis, Insights and Forecast - by Vehicle Type
- 8.3.1. Passenger Cars
- 8.3.2. Commercial Vehicles
- 8.4. Market Analysis, Insights and Forecast - by Charging System Type
- 8.4.1. Slow Charging Systems
- 8.4.2. Fast Charging Systems
- 8.4.3. Rapid Charging Systems
- 8.1. Market Analysis, Insights and Forecast - by Application Type
- 9. Middle East & Africa US EV Charging Systems Market Analysis, Insights and Forecast, 2019-2031
- 9.1. Market Analysis, Insights and Forecast - by Application Type
- 9.1.1. Public
- 9.1.2. Private (Residential and Commercial)
- 9.2. Market Analysis, Insights and Forecast - by Equipment Type
- 9.2.1. Pillar/Charging Station/Dock
- 9.2.2. Inverter
- 9.2.3. Charger
- 9.2.3.1. AC Charger
- 9.2.3.2. DC Charger
- 9.2.4. Others (Cord, Port, etc.)
- 9.3. Market Analysis, Insights and Forecast - by Vehicle Type
- 9.3.1. Passenger Cars
- 9.3.2. Commercial Vehicles
- 9.4. Market Analysis, Insights and Forecast - by Charging System Type
- 9.4.1. Slow Charging Systems
- 9.4.2. Fast Charging Systems
- 9.4.3. Rapid Charging Systems
- 9.1. Market Analysis, Insights and Forecast - by Application Type
- 10. Asia Pacific US EV Charging Systems Market Analysis, Insights and Forecast, 2019-2031
- 10.1. Market Analysis, Insights and Forecast - by Application Type
- 10.1.1. Public
- 10.1.2. Private (Residential and Commercial)
- 10.2. Market Analysis, Insights and Forecast - by Equipment Type
- 10.2.1. Pillar/Charging Station/Dock
- 10.2.2. Inverter
- 10.2.3. Charger
- 10.2.3.1. AC Charger
- 10.2.3.2. DC Charger
- 10.2.4. Others (Cord, Port, etc.)
- 10.3. Market Analysis, Insights and Forecast - by Vehicle Type
- 10.3.1. Passenger Cars
- 10.3.2. Commercial Vehicles
- 10.4. Market Analysis, Insights and Forecast - by Charging System Type
- 10.4.1. Slow Charging Systems
- 10.4.2. Fast Charging Systems
- 10.4.3. Rapid Charging Systems
- 10.1. Market Analysis, Insights and Forecast - by Application Type
- 11. Northeast US EV Charging Systems Market Analysis, Insights and Forecast, 2019-2031
- 12. Southeast US EV Charging Systems Market Analysis, Insights and Forecast, 2019-2031
- 13. Midwest US EV Charging Systems Market Analysis, Insights and Forecast, 2019-2031
- 14. Southwest US EV Charging Systems Market Analysis, Insights and Forecast, 2019-2031
- 15. West US EV Charging Systems Market Analysis, Insights and Forecast, 2019-2031
- 16. Competitive Analysis
- 16.1. Global Market Share Analysis 2024
- 16.2. Company Profiles
- 16.2.1 Wallbo
- 16.2.1.1. Overview
- 16.2.1.2. Products
- 16.2.1.3. SWOT Analysis
- 16.2.1.4. Recent Developments
- 16.2.1.5. Financials (Based on Availability)
- 16.2.2 ChargePoint Inc
- 16.2.2.1. Overview
- 16.2.2.2. Products
- 16.2.2.3. SWOT Analysis
- 16.2.2.4. Recent Developments
- 16.2.2.5. Financials (Based on Availability)
- 16.2.3 Blink Charging Co
- 16.2.3.1. Overview
- 16.2.3.2. Products
- 16.2.3.3. SWOT Analysis
- 16.2.3.4. Recent Developments
- 16.2.3.5. Financials (Based on Availability)
- 16.2.4 Leviton Manufacturing Co Inc
- 16.2.4.1. Overview
- 16.2.4.2. Products
- 16.2.4.3. SWOT Analysis
- 16.2.4.4. Recent Developments
- 16.2.4.5. Financials (Based on Availability)
- 16.2.5 Webasto SE
- 16.2.5.1. Overview
- 16.2.5.2. Products
- 16.2.5.3. SWOT Analysis
- 16.2.5.4. Recent Developments
- 16.2.5.5. Financials (Based on Availability)
- 16.2.6 Siemens AG
- 16.2.6.1. Overview
- 16.2.6.2. Products
- 16.2.6.3. SWOT Analysis
- 16.2.6.4. Recent Developments
- 16.2.6.5. Financials (Based on Availability)
- 16.2.7 Schneider Electric SE
- 16.2.7.1. Overview
- 16.2.7.2. Products
- 16.2.7.3. SWOT Analysis
- 16.2.7.4. Recent Developments
- 16.2.7.5. Financials (Based on Availability)
- 16.2.8 ABB Group
- 16.2.8.1. Overview
- 16.2.8.2. Products
- 16.2.8.3. SWOT Analysis
- 16.2.8.4. Recent Developments
- 16.2.8.5. Financials (Based on Availability)
- 16.2.9 Tesla Inc
- 16.2.9.1. Overview
- 16.2.9.2. Products
- 16.2.9.3. SWOT Analysis
- 16.2.9.4. Recent Developments
- 16.2.9.5. Financials (Based on Availability)
- 16.2.10 EVBox Group
- 16.2.10.1. Overview
- 16.2.10.2. Products
- 16.2.10.3. SWOT Analysis
- 16.2.10.4. Recent Developments
- 16.2.10.5. Financials (Based on Availability)
- 16.2.11 EvoCharge Inc
- 16.2.11.1. Overview
- 16.2.11.2. Products
- 16.2.11.3. SWOT Analysis
- 16.2.11.4. Recent Developments
- 16.2.11.5. Financials (Based on Availability)
- 16.2.12 Eaton Corporation
- 16.2.12.1. Overview
- 16.2.12.2. Products
- 16.2.12.3. SWOT Analysis
- 16.2.12.4. Recent Developments
- 16.2.12.5. Financials (Based on Availability)
- 16.2.1 Wallbo
List of Figures
- Figure 1: Global US EV Charging Systems Market Revenue Breakdown (Million, %) by Region 2024 & 2032
- Figure 2: United states US EV Charging Systems Market Revenue (Million), by Country 2024 & 2032
- Figure 3: United states US EV Charging Systems Market Revenue Share (%), by Country 2024 & 2032
- Figure 4: North America US EV Charging Systems Market Revenue (Million), by Application Type 2024 & 2032
- Figure 5: North America US EV Charging Systems Market Revenue Share (%), by Application Type 2024 & 2032
- Figure 6: North America US EV Charging Systems Market Revenue (Million), by Equipment Type 2024 & 2032
- Figure 7: North America US EV Charging Systems Market Revenue Share (%), by Equipment Type 2024 & 2032
- Figure 8: North America US EV Charging Systems Market Revenue (Million), by Vehicle Type 2024 & 2032
- Figure 9: North America US EV Charging Systems Market Revenue Share (%), by Vehicle Type 2024 & 2032
- Figure 10: North America US EV Charging Systems Market Revenue (Million), by Charging System Type 2024 & 2032
- Figure 11: North America US EV Charging Systems Market Revenue Share (%), by Charging System Type 2024 & 2032
- Figure 12: North America US EV Charging Systems Market Revenue (Million), by Country 2024 & 2032
- Figure 13: North America US EV Charging Systems Market Revenue Share (%), by Country 2024 & 2032
- Figure 14: South America US EV Charging Systems Market Revenue (Million), by Application Type 2024 & 2032
- Figure 15: South America US EV Charging Systems Market Revenue Share (%), by Application Type 2024 & 2032
- Figure 16: South America US EV Charging Systems Market Revenue (Million), by Equipment Type 2024 & 2032
- Figure 17: South America US EV Charging Systems Market Revenue Share (%), by Equipment Type 2024 & 2032
- Figure 18: South America US EV Charging Systems Market Revenue (Million), by Vehicle Type 2024 & 2032
- Figure 19: South America US EV Charging Systems Market Revenue Share (%), by Vehicle Type 2024 & 2032
- Figure 20: South America US EV Charging Systems Market Revenue (Million), by Charging System Type 2024 & 2032
- Figure 21: South America US EV Charging Systems Market Revenue Share (%), by Charging System Type 2024 & 2032
- Figure 22: South America US EV Charging Systems Market Revenue (Million), by Country 2024 & 2032
- Figure 23: South America US EV Charging Systems Market Revenue Share (%), by Country 2024 & 2032
- Figure 24: Europe US EV Charging Systems Market Revenue (Million), by Application Type 2024 & 2032
- Figure 25: Europe US EV Charging Systems Market Revenue Share (%), by Application Type 2024 & 2032
- Figure 26: Europe US EV Charging Systems Market Revenue (Million), by Equipment Type 2024 & 2032
- Figure 27: Europe US EV Charging Systems Market Revenue Share (%), by Equipment Type 2024 & 2032
- Figure 28: Europe US EV Charging Systems Market Revenue (Million), by Vehicle Type 2024 & 2032
- Figure 29: Europe US EV Charging Systems Market Revenue Share (%), by Vehicle Type 2024 & 2032
- Figure 30: Europe US EV Charging Systems Market Revenue (Million), by Charging System Type 2024 & 2032
- Figure 31: Europe US EV Charging Systems Market Revenue Share (%), by Charging System Type 2024 & 2032
- Figure 32: Europe US EV Charging Systems Market Revenue (Million), by Country 2024 & 2032
- Figure 33: Europe US EV Charging Systems Market Revenue Share (%), by Country 2024 & 2032
- Figure 34: Middle East & Africa US EV Charging Systems Market Revenue (Million), by Application Type 2024 & 2032
- Figure 35: Middle East & Africa US EV Charging Systems Market Revenue Share (%), by Application Type 2024 & 2032
- Figure 36: Middle East & Africa US EV Charging Systems Market Revenue (Million), by Equipment Type 2024 & 2032
- Figure 37: Middle East & Africa US EV Charging Systems Market Revenue Share (%), by Equipment Type 2024 & 2032
- Figure 38: Middle East & Africa US EV Charging Systems Market Revenue (Million), by Vehicle Type 2024 & 2032
- Figure 39: Middle East & Africa US EV Charging Systems Market Revenue Share (%), by Vehicle Type 2024 & 2032
- Figure 40: Middle East & Africa US EV Charging Systems Market Revenue (Million), by Charging System Type 2024 & 2032
- Figure 41: Middle East & Africa US EV Charging Systems Market Revenue Share (%), by Charging System Type 2024 & 2032
- Figure 42: Middle East & Africa US EV Charging Systems Market Revenue (Million), by Country 2024 & 2032
- Figure 43: Middle East & Africa US EV Charging Systems Market Revenue Share (%), by Country 2024 & 2032
- Figure 44: Asia Pacific US EV Charging Systems Market Revenue (Million), by Application Type 2024 & 2032
- Figure 45: Asia Pacific US EV Charging Systems Market Revenue Share (%), by Application Type 2024 & 2032
- Figure 46: Asia Pacific US EV Charging Systems Market Revenue (Million), by Equipment Type 2024 & 2032
- Figure 47: Asia Pacific US EV Charging Systems Market Revenue Share (%), by Equipment Type 2024 & 2032
- Figure 48: Asia Pacific US EV Charging Systems Market Revenue (Million), by Vehicle Type 2024 & 2032
- Figure 49: Asia Pacific US EV Charging Systems Market Revenue Share (%), by Vehicle Type 2024 & 2032
- Figure 50: Asia Pacific US EV Charging Systems Market Revenue (Million), by Charging System Type 2024 & 2032
- Figure 51: Asia Pacific US EV Charging Systems Market Revenue Share (%), by Charging System Type 2024 & 2032
- Figure 52: Asia Pacific US EV Charging Systems Market Revenue (Million), by Country 2024 & 2032
- Figure 53: Asia Pacific US EV Charging Systems Market Revenue Share (%), by Country 2024 & 2032
List of Tables
- Table 1: Global US EV Charging Systems Market Revenue Million Forecast, by Region 2019 & 2032
- Table 2: Global US EV Charging Systems Market Revenue Million Forecast, by Application Type 2019 & 2032
- Table 3: Global US EV Charging Systems Market Revenue Million Forecast, by Equipment Type 2019 & 2032
- Table 4: Global US EV Charging Systems Market Revenue Million Forecast, by Vehicle Type 2019 & 2032
- Table 5: Global US EV Charging Systems Market Revenue Million Forecast, by Charging System Type 2019 & 2032
- Table 6: Global US EV Charging Systems Market Revenue Million Forecast, by Region 2019 & 2032
- Table 7: Global US EV Charging Systems Market Revenue Million Forecast, by Country 2019 & 2032
- Table 8: Northeast US EV Charging Systems Market Revenue (Million) Forecast, by Application 2019 & 2032
- Table 9: Southeast US EV Charging Systems Market Revenue (Million) Forecast, by Application 2019 & 2032
- Table 10: Midwest US EV Charging Systems Market Revenue (Million) Forecast, by Application 2019 & 2032
- Table 11: Southwest US EV Charging Systems Market Revenue (Million) Forecast, by Application 2019 & 2032
- Table 12: West US EV Charging Systems Market Revenue (Million) Forecast, by Application 2019 & 2032
- Table 13: Global US EV Charging Systems Market Revenue Million Forecast, by Application Type 2019 & 2032
- Table 14: Global US EV Charging Systems Market Revenue Million Forecast, by Equipment Type 2019 & 2032
- Table 15: Global US EV Charging Systems Market Revenue Million Forecast, by Vehicle Type 2019 & 2032
- Table 16: Global US EV Charging Systems Market Revenue Million Forecast, by Charging System Type 2019 & 2032
- Table 17: Global US EV Charging Systems Market Revenue Million Forecast, by Country 2019 & 2032
- Table 18: United States US EV Charging Systems Market Revenue (Million) Forecast, by Application 2019 & 2032
- Table 19: Canada US EV Charging Systems Market Revenue (Million) Forecast, by Application 2019 & 2032
- Table 20: Mexico US EV Charging Systems Market Revenue (Million) Forecast, by Application 2019 & 2032
- Table 21: Global US EV Charging Systems Market Revenue Million Forecast, by Application Type 2019 & 2032
- Table 22: Global US EV Charging Systems Market Revenue Million Forecast, by Equipment Type 2019 & 2032
- Table 23: Global US EV Charging Systems Market Revenue Million Forecast, by Vehicle Type 2019 & 2032
- Table 24: Global US EV Charging Systems Market Revenue Million Forecast, by Charging System Type 2019 & 2032
- Table 25: Global US EV Charging Systems Market Revenue Million Forecast, by Country 2019 & 2032
- Table 26: Brazil US EV Charging Systems Market Revenue (Million) Forecast, by Application 2019 & 2032
- Table 27: Argentina US EV Charging Systems Market Revenue (Million) Forecast, by Application 2019 & 2032
- Table 28: Rest of South America US EV Charging Systems Market Revenue (Million) Forecast, by Application 2019 & 2032
- Table 29: Global US EV Charging Systems Market Revenue Million Forecast, by Application Type 2019 & 2032
- Table 30: Global US EV Charging Systems Market Revenue Million Forecast, by Equipment Type 2019 & 2032
- Table 31: Global US EV Charging Systems Market Revenue Million Forecast, by Vehicle Type 2019 & 2032
- Table 32: Global US EV Charging Systems Market Revenue Million Forecast, by Charging System Type 2019 & 2032
- Table 33: Global US EV Charging Systems Market Revenue Million Forecast, by Country 2019 & 2032
- Table 34: United Kingdom US EV Charging Systems Market Revenue (Million) Forecast, by Application 2019 & 2032
- Table 35: Germany US EV Charging Systems Market Revenue (Million) Forecast, by Application 2019 & 2032
- Table 36: France US EV Charging Systems Market Revenue (Million) Forecast, by Application 2019 & 2032
- Table 37: Italy US EV Charging Systems Market Revenue (Million) Forecast, by Application 2019 & 2032
- Table 38: Spain US EV Charging Systems Market Revenue (Million) Forecast, by Application 2019 & 2032
- Table 39: Russia US EV Charging Systems Market Revenue (Million) Forecast, by Application 2019 & 2032
- Table 40: Benelux US EV Charging Systems Market Revenue (Million) Forecast, by Application 2019 & 2032
- Table 41: Nordics US EV Charging Systems Market Revenue (Million) Forecast, by Application 2019 & 2032
- Table 42: Rest of Europe US EV Charging Systems Market Revenue (Million) Forecast, by Application 2019 & 2032
- Table 43: Global US EV Charging Systems Market Revenue Million Forecast, by Application Type 2019 & 2032
- Table 44: Global US EV Charging Systems Market Revenue Million Forecast, by Equipment Type 2019 & 2032
- Table 45: Global US EV Charging Systems Market Revenue Million Forecast, by Vehicle Type 2019 & 2032
- Table 46: Global US EV Charging Systems Market Revenue Million Forecast, by Charging System Type 2019 & 2032
- Table 47: Global US EV Charging Systems Market Revenue Million Forecast, by Country 2019 & 2032
- Table 48: Turkey US EV Charging Systems Market Revenue (Million) Forecast, by Application 2019 & 2032
- Table 49: Israel US EV Charging Systems Market Revenue (Million) Forecast, by Application 2019 & 2032
- Table 50: GCC US EV Charging Systems Market Revenue (Million) Forecast, by Application 2019 & 2032
- Table 51: North Africa US EV Charging Systems Market Revenue (Million) Forecast, by Application 2019 & 2032
- Table 52: South Africa US EV Charging Systems Market Revenue (Million) Forecast, by Application 2019 & 2032
- Table 53: Rest of Middle East & Africa US EV Charging Systems Market Revenue (Million) Forecast, by Application 2019 & 2032
- Table 54: Global US EV Charging Systems Market Revenue Million Forecast, by Application Type 2019 & 2032
- Table 55: Global US EV Charging Systems Market Revenue Million Forecast, by Equipment Type 2019 & 2032
- Table 56: Global US EV Charging Systems Market Revenue Million Forecast, by Vehicle Type 2019 & 2032
- Table 57: Global US EV Charging Systems Market Revenue Million Forecast, by Charging System Type 2019 & 2032
- Table 58: Global US EV Charging Systems Market Revenue Million Forecast, by Country 2019 & 2032
- Table 59: China US EV Charging Systems Market Revenue (Million) Forecast, by Application 2019 & 2032
- Table 60: India US EV Charging Systems Market Revenue (Million) Forecast, by Application 2019 & 2032
- Table 61: Japan US EV Charging Systems Market Revenue (Million) Forecast, by Application 2019 & 2032
- Table 62: South Korea US EV Charging Systems Market Revenue (Million) Forecast, by Application 2019 & 2032
- Table 63: ASEAN US EV Charging Systems Market Revenue (Million) Forecast, by Application 2019 & 2032
- Table 64: Oceania US EV Charging Systems Market Revenue (Million) Forecast, by Application 2019 & 2032
- Table 65: Rest of Asia Pacific US EV Charging Systems Market Revenue (Million) Forecast, by Application 2019 & 2032
Frequently Asked Questions
1. What is the projected Compound Annual Growth Rate (CAGR) of the US EV Charging Systems Market?
The projected CAGR is approximately 27.65%.
2. Which companies are prominent players in the US EV Charging Systems Market?
Key companies in the market include Wallbo, ChargePoint Inc, Blink Charging Co, Leviton Manufacturing Co Inc, Webasto SE, Siemens AG, Schneider Electric SE, ABB Group, Tesla Inc, EVBox Group, EvoCharge Inc, Eaton Corporation.
3. What are the main segments of the US EV Charging Systems Market?
The market segments include Application Type, Equipment Type, Vehicle Type, Charging System Type.
4. Can you provide details about the market size?
The market size is estimated to be USD 3.88 Million as of 2022.
5. What are some drivers contributing to market growth?
Aggressive Government Focus to Promote the Adoption of Electric Vehicles Fosters the Growth of the Market.
6. What are the notable trends driving market growth?
Passengers Cars Segment to Gain Traction during the Forecast Period.
7. Are there any restraints impacting market growth?
High Cost of Setting Up EV Charging Stations Hampers the Growth of the Market.
8. Can you provide examples of recent developments in the market?
In March 2024, Wallbox announced the delivery of its smart chargers, Pulsar Pro North America, designed specifically for residential and commercial properties, which will be available to customers from the United States. Apart from the latest innovation, Wallbox also launched Supernova 180, its DC-fast EV charger, to assist in improving the state of the fast charging ecosystem in the United States.
9. What pricing options are available for accessing the report?
Pricing options include single-user, multi-user, and enterprise licenses priced at USD 3800, USD 4500, and USD 5800 respectively.
10. Is the market size provided in terms of value or volume?
The market size is provided in terms of value, measured in Million.
11. Are there any specific market keywords associated with the report?
Yes, the market keyword associated with the report is "US EV Charging Systems Market," which aids in identifying and referencing the specific market segment covered.
12. How do I determine which pricing option suits my needs best?
The pricing options vary based on user requirements and access needs. Individual users may opt for single-user licenses, while businesses requiring broader access may choose multi-user or enterprise licenses for cost-effective access to the report.
13. Are there any additional resources or data provided in the US EV Charging Systems Market report?
While the report offers comprehensive insights, it's advisable to review the specific contents or supplementary materials provided to ascertain if additional resources or data are available.
14. How can I stay updated on further developments or reports in the US EV Charging Systems Market?
To stay informed about further developments, trends, and reports in the US EV Charging Systems Market, consider subscribing to industry newsletters, following relevant companies and organizations, or regularly checking reputable industry news sources and publications.
Methodology
Step 1 - Identification of Relevant Samples Size from Population Database


Step 2 - Approaches for Defining Global Market Size (Value, Volume* & Price*)

Note*: In applicable scenarios
Step 3 - Data Sources
Primary Research
- Web Analytics
- Survey Reports
- Research Institute
- Latest Research Reports
- Opinion Leaders
Secondary Research
- Annual Reports
- White Paper
- Latest Press Release
- Industry Association
- Paid Database
- Investor Presentations

Step 4 - Data Triangulation
Involves using different sources of information in order to increase the validity of a study
These sources are likely to be stakeholders in a program - participants, other researchers, program staff, other community members, and so on.
Then we put all data in single framework & apply various statistical tools to find out the dynamic on the market.
During the analysis stage, feedback from the stakeholder groups would be compared to determine areas of agreement as well as areas of divergence


