
Key Insights
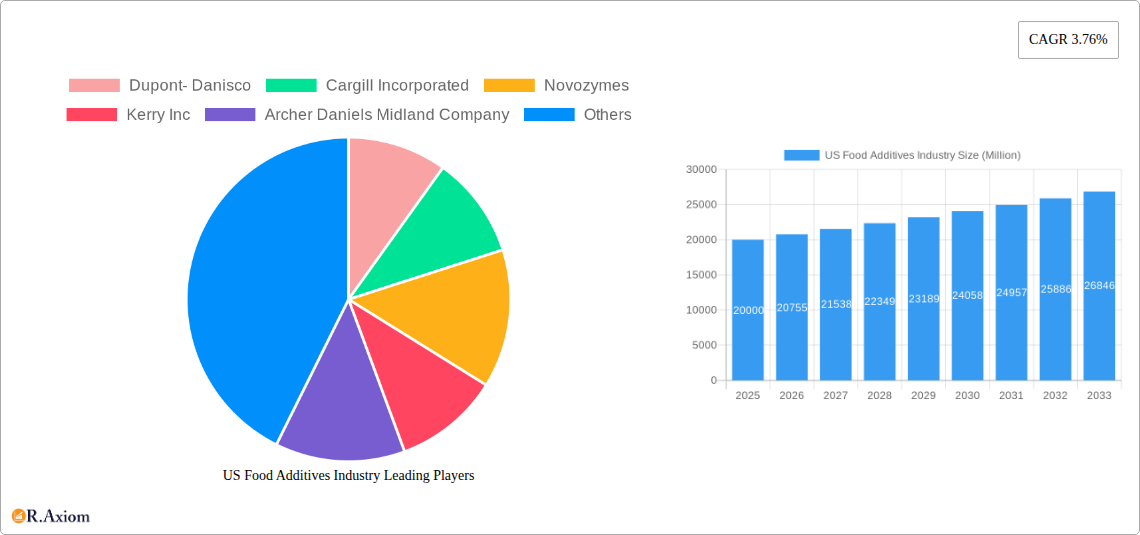
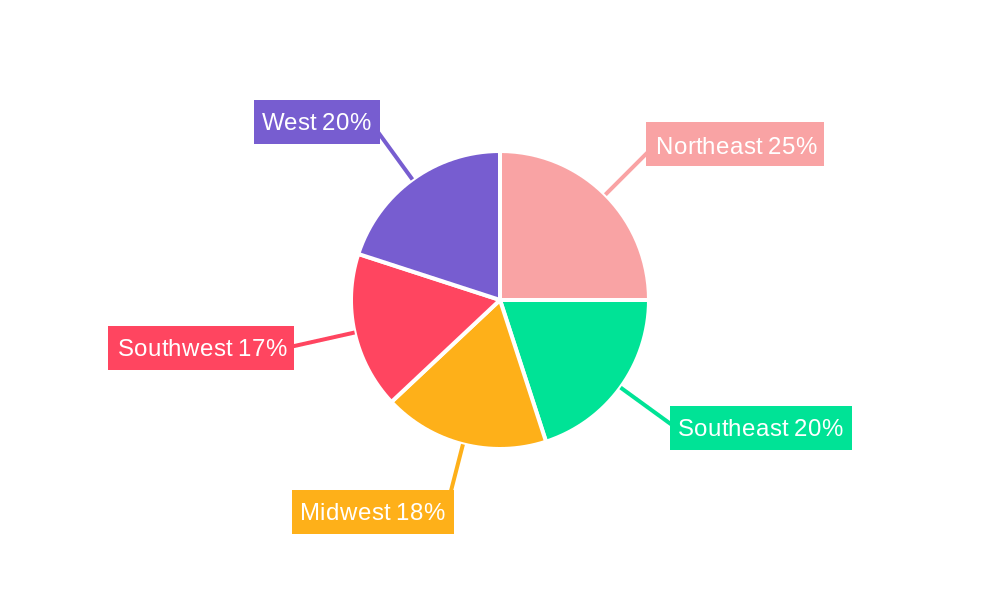
The US food additives market, valued at approximately $XX million in 2025, is projected to experience robust growth, driven by several key factors. The increasing demand for processed and convenient foods fuels the consumption of food additives across diverse applications, including confectionery, bakery, dairy, beverages, and meat products. Consumer preference for enhanced taste, texture, shelf-life, and nutritional value further propels market expansion. Specific additive segments such as preservatives (extending product shelf life) and sweeteners (catering to health-conscious consumers seeking sugar alternatives) demonstrate significant growth potential. Technological advancements in food processing and packaging also contribute to the market’s upward trajectory. While stringent regulatory frameworks and increasing consumer awareness regarding potential health implications pose challenges, the market is effectively adapting through the development of natural and clean-label additives. The regional distribution likely shows a higher concentration in densely populated areas like the Northeast and West Coast, mirroring broader consumer trends.
However, growth is expected to remain relatively moderate (CAGR of 3.76%). This can be attributed to fluctuating raw material prices, concerns about the potential negative health effects of certain additives, and the growing preference for minimally processed and organic foods. Competition among established players like DuPont-Danisco, Cargill, and Kerry, along with emerging companies offering innovative solutions, is likely to intensify. The market’s future hinges on successful innovation in cleaner, healthier, and more sustainable food additive technologies, meeting evolving consumer demands and regulatory compliance. The continued expansion of the food and beverage sector itself will inevitably drive demand for food additives in the coming years. Growth will likely be more prominent in segments aligning with healthier lifestyles and clean-label trends.
This in-depth report provides a comprehensive analysis of the US food additives industry, encompassing market size, segmentation, growth drivers, challenges, and future outlook. The report covers the period from 2019 to 2033, with a focus on the estimated year 2025 and a forecast period from 2025 to 2033. The historical period analyzed is 2019-2024. Key players such as DuPont-Danisco, Cargill Incorporated, Novozymes, Kerry Inc, Archer Daniels Midland Company, Koninklijke DSM N.V., Corbion NV, and Tate & Lyle are profiled, offering actionable insights for industry stakeholders. The total market size in 2025 is estimated at $xx Million.
US Food Additives Industry Market Concentration & Innovation
The US food additives market exhibits a moderately concentrated structure, with a few major players holding significant market share. While precise figures are proprietary, Cargill Incorporated, DuPont-Danisco, and Kerry Inc. are believed to collectively hold a xx% market share in 2025, indicating considerable influence on pricing and product innovation. Smaller players focus on niche segments or specialized additives, often leveraging innovation to gain a foothold.
Innovation Drivers:
- Clean Label Trends: Growing consumer demand for natural and minimally processed foods is driving innovation in clean-label additives, including those with simpler ingredient lists and reduced synthetic compounds.
- Health & Wellness: The rising focus on health and wellness fuels the development of functional food additives with added benefits, such as probiotics, prebiotics, and antioxidants.
- Sustainability Concerns: Environmental sustainability is pushing for eco-friendly additives with reduced environmental impact throughout their lifecycle.
- Technological Advancements: Developments in biotechnology and food science are constantly leading to new types of additives with enhanced functionalities and improved performance.
Regulatory Framework: The FDA's stringent regulations and guidelines significantly influence the market, driving a focus on safety, labeling, and compliance.
Mergers & Acquisitions (M&A): The industry witnesses consistent M&A activity, exemplified by Symrise's acquisition of Tate & Lyle in 2021 (estimated value: $xx Million). These activities reshape market dynamics, increasing market consolidation and driving innovation through technology and market access.
US Food Additives Industry Industry Trends & Insights
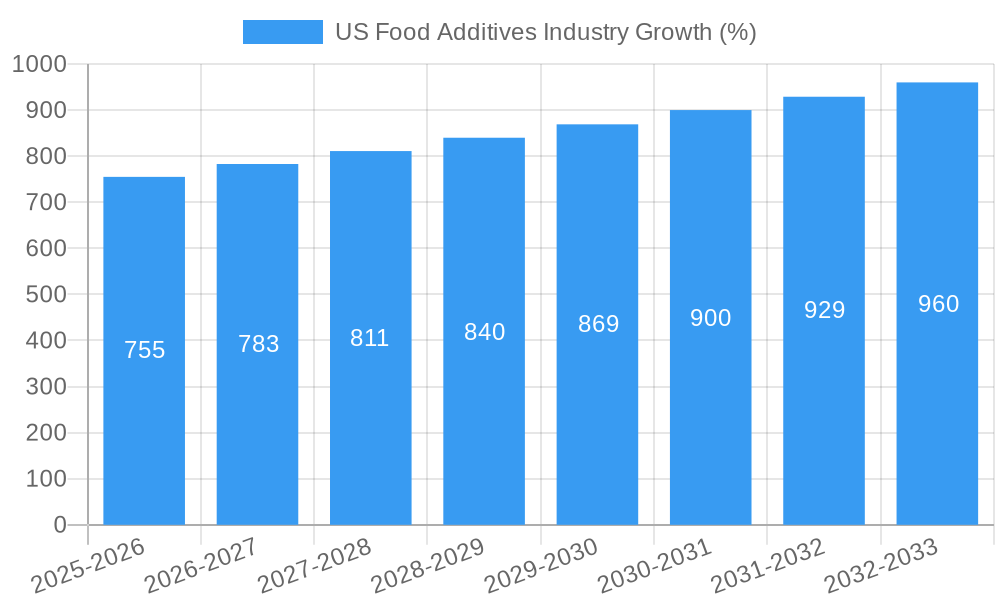
The US food additives market is projected to experience a Compound Annual Growth Rate (CAGR) of xx% during the forecast period (2025-2033). This growth is fueled by several key factors:
- Expanding Food & Beverage Sector: The continuous growth of the food and beverage industry in the US directly correlates with increasing demand for additives to enhance product quality, shelf life, and appeal.
- Changing Consumer Preferences: The rising preference for convenience foods, processed snacks, and functional beverages boosts the demand for additives catering to specific needs and flavor profiles.
- Technological Disruptions: Advancements in biotechnology and nanotechnology result in new, high-performing additives with enhanced functionalities, including improved stability, texture, and color.
- Competitive Landscape: Intense competition among key players fosters innovation and product diversification to meet evolving market demands. Market penetration by new, smaller players is expected at xx% by 2033, challenging the established players.
Dominant Markets & Segments in US Food Additives Industry
The largest segment by application in 2025 is the Beverages sector, followed by Confectionery and Bakery Products. This dominance is driven by high consumption rates and the extensive use of additives to enhance texture, flavor, and shelf life. Within the Type segment, Preservatives, Sweeteners, and Food Flavors and Enhancers represent the largest sub-segments, reflecting the core needs of food manufacturers.
Key Drivers:
- Economic Policies: Favorable economic conditions and stable consumer spending stimulate food and beverage consumption and thus additive demand.
- Infrastructure: Robust infrastructure and efficient supply chains enable the effective distribution of food additives across the country.
Dominance Analysis: The continued dominance of Beverages, Confectionery, and Bakery is predicted due to the steady growth of these sectors. The projected market size for the Beverages segment is estimated at $xx Million in 2025, representing a significant portion of the overall market.
US Food Additives Industry Product Developments
Recent product innovations center around clean-label, natural, and sustainable additives. Cargill's 2022 launch of preservative-free additives exemplifies this trend, addressing consumer demand for healthier options. DuPont-Danisco's investment in plant-based additives aligns with the growing focus on sustainable and environmentally friendly solutions. These developments showcase a strong market fit by catering to evolving consumer preferences and regulatory requirements.
Report Scope & Segmentation Analysis
This report segments the US food additives market by:
Type: Preservatives, Sweeteners, Sugar Substitutes, Emulsifiers, Anti-Caking Agents, Enzymes, Hydrocolloids, Food Flavors and Enhancers, Food Colorants, Acidulants. Each segment displays diverse growth projections, driven by unique market factors. For example, the clean label trend is accelerating the growth of natural sweeteners and preservatives.
Application: Confectionery, Bakery Products, Dairy & Frozen Food, Beverages, Meat, Poultry, and Seafood, Others. Each application area demonstrates varying growth rates based on consumption patterns and the specific additive requirements of the respective food categories.
Key Drivers of US Food Additives Industry Growth
Growth is propelled by several factors: rising disposable incomes boosting food consumption; expanding food processing sector demanding efficient and functional additives; increasing consumer preference for convenience and ready-to-eat foods; and advancements in technology resulting in new and improved additives. Furthermore, the growth of health-conscious consumerism fuels the demand for functional food additives with added health benefits.
Challenges in the US Food Additives Industry Sector
The industry faces challenges such as stringent FDA regulations demanding compliance and thorough safety testing; fluctuating raw material prices influencing production costs; and intense competition among established players and emerging companies. Supply chain disruptions, particularly post-pandemic, have also significantly impacted production and delivery timelines. These factors collectively exert considerable pressure on profitability and growth.
Emerging Opportunities in US Food Additives Industry
Emerging opportunities include the rising demand for plant-based food additives aligned with sustainable practices; personalized nutrition driving demand for tailored additives; and the expanding market for functional foods and beverages incorporating additives with health benefits. Furthermore, the application of nanotechnology and biotechnology continues to unlock opportunities for creating novel and improved food additives.
Leading Players in the US Food Additives Industry Market
- DuPont-Danisco
- Cargill Incorporated
- Novozymes
- Kerry Inc
- Archer Daniels Midland Company
- Koninklijke DSM N.V.
- Corbion NV
- Tate & Lyle
Key Developments in US Food Additives Industry Industry
- 2021: Acquisition of Tate & Lyle by Symrise.
- 2022: Launch of new preservative-free, clean label additives by Cargill.
- 2023: Investment in plant-based food additives by DuPont-Danisco.
These developments highlight the industry's dynamic nature, with a focus on consolidation, innovation, and sustainability.
Strategic Outlook for US Food Additives Industry Market
The US food additives market holds substantial future potential. Continued growth is anticipated due to factors such as evolving consumer preferences, technological advancements, and the expanding food and beverage sector. Companies focusing on clean-label, sustainable, and functional additives are poised for strong growth. Addressing regulatory compliance and supply chain resilience will be crucial for maintaining competitiveness and achieving long-term success.
US Food Additives Industry Segmentation
-
1. Type
- 1.1. Preservatives
- 1.2. Sweetener
- 1.3. Sugar Substitutes
- 1.4. Emulsifier
- 1.5. Anti-Caking Agents
- 1.6. Enzymes
- 1.7. Hydrocolloids
- 1.8. Food Flavors and Enhancers
- 1.9. Food Colorants
- 1.10. Acidulants
-
2. Application
- 2.1. Confectionery
- 2.2. Bakery Products
- 2.3. Dairy & Frozen Food
- 2.4. Beverages
- 2.5. Meat, Poultry, and Sea Food
- 2.6. Others
US Food Additives Industry Segmentation By Geography
-
1. North America
- 1.1. United States
- 1.2. Canada
- 1.3. Mexico
-
2. South America
- 2.1. Brazil
- 2.2. Argentina
- 2.3. Rest of South America
-
3. Europe
- 3.1. United Kingdom
- 3.2. Germany
- 3.3. France
- 3.4. Italy
- 3.5. Spain
- 3.6. Russia
- 3.7. Benelux
- 3.8. Nordics
- 3.9. Rest of Europe
-
4. Middle East & Africa
- 4.1. Turkey
- 4.2. Israel
- 4.3. GCC
- 4.4. North Africa
- 4.5. South Africa
- 4.6. Rest of Middle East & Africa
-
5. Asia Pacific
- 5.1. China
- 5.2. India
- 5.3. Japan
- 5.4. South Korea
- 5.5. ASEAN
- 5.6. Oceania
- 5.7. Rest of Asia Pacific
US Food Additives Industry REPORT HIGHLIGHTS
| Aspects | Details |
|---|---|
| Study Period | 2019-2033 |
| Base Year | 2024 |
| Estimated Year | 2025 |
| Forecast Period | 2025-2033 |
| Historical Period | 2019-2024 |
| Growth Rate | CAGR of 3.76% from 2019-2033 |
| Segmentation |
|
Table of Contents
- 1. Introduction
- 1.1. Research Scope
- 1.2. Market Segmentation
- 1.3. Research Methodology
- 1.4. Definitions and Assumptions
- 2. Executive Summary
- 2.1. Introduction
- 3. Market Dynamics
- 3.1. Introduction
- 3.2. Market Drivers
- 3.2.1. Wide Applications and Functionality; Demand For Gluten-Free Products
- 3.3. Market Restrains
- 3.3.1. Easy Availability of Economically Feasible Alternatives
- 3.4. Market Trends
- 3.4.1. Growing Demand for Retail Food
- 4. Market Factor Analysis
- 4.1. Porters Five Forces
- 4.2. Supply/Value Chain
- 4.3. PESTEL analysis
- 4.4. Market Entropy
- 4.5. Patent/Trademark Analysis
- 5. Global US Food Additives Industry Analysis, Insights and Forecast, 2019-2031
- 5.1. Market Analysis, Insights and Forecast - by Type
- 5.1.1. Preservatives
- 5.1.2. Sweetener
- 5.1.3. Sugar Substitutes
- 5.1.4. Emulsifier
- 5.1.5. Anti-Caking Agents
- 5.1.6. Enzymes
- 5.1.7. Hydrocolloids
- 5.1.8. Food Flavors and Enhancers
- 5.1.9. Food Colorants
- 5.1.10. Acidulants
- 5.2. Market Analysis, Insights and Forecast - by Application
- 5.2.1. Confectionery
- 5.2.2. Bakery Products
- 5.2.3. Dairy & Frozen Food
- 5.2.4. Beverages
- 5.2.5. Meat, Poultry, and Sea Food
- 5.2.6. Others
- 5.3. Market Analysis, Insights and Forecast - by Region
- 5.3.1. North America
- 5.3.2. South America
- 5.3.3. Europe
- 5.3.4. Middle East & Africa
- 5.3.5. Asia Pacific
- 5.1. Market Analysis, Insights and Forecast - by Type
- 6. North America US Food Additives Industry Analysis, Insights and Forecast, 2019-2031
- 6.1. Market Analysis, Insights and Forecast - by Type
- 6.1.1. Preservatives
- 6.1.2. Sweetener
- 6.1.3. Sugar Substitutes
- 6.1.4. Emulsifier
- 6.1.5. Anti-Caking Agents
- 6.1.6. Enzymes
- 6.1.7. Hydrocolloids
- 6.1.8. Food Flavors and Enhancers
- 6.1.9. Food Colorants
- 6.1.10. Acidulants
- 6.2. Market Analysis, Insights and Forecast - by Application
- 6.2.1. Confectionery
- 6.2.2. Bakery Products
- 6.2.3. Dairy & Frozen Food
- 6.2.4. Beverages
- 6.2.5. Meat, Poultry, and Sea Food
- 6.2.6. Others
- 6.1. Market Analysis, Insights and Forecast - by Type
- 7. South America US Food Additives Industry Analysis, Insights and Forecast, 2019-2031
- 7.1. Market Analysis, Insights and Forecast - by Type
- 7.1.1. Preservatives
- 7.1.2. Sweetener
- 7.1.3. Sugar Substitutes
- 7.1.4. Emulsifier
- 7.1.5. Anti-Caking Agents
- 7.1.6. Enzymes
- 7.1.7. Hydrocolloids
- 7.1.8. Food Flavors and Enhancers
- 7.1.9. Food Colorants
- 7.1.10. Acidulants
- 7.2. Market Analysis, Insights and Forecast - by Application
- 7.2.1. Confectionery
- 7.2.2. Bakery Products
- 7.2.3. Dairy & Frozen Food
- 7.2.4. Beverages
- 7.2.5. Meat, Poultry, and Sea Food
- 7.2.6. Others
- 7.1. Market Analysis, Insights and Forecast - by Type
- 8. Europe US Food Additives Industry Analysis, Insights and Forecast, 2019-2031
- 8.1. Market Analysis, Insights and Forecast - by Type
- 8.1.1. Preservatives
- 8.1.2. Sweetener
- 8.1.3. Sugar Substitutes
- 8.1.4. Emulsifier
- 8.1.5. Anti-Caking Agents
- 8.1.6. Enzymes
- 8.1.7. Hydrocolloids
- 8.1.8. Food Flavors and Enhancers
- 8.1.9. Food Colorants
- 8.1.10. Acidulants
- 8.2. Market Analysis, Insights and Forecast - by Application
- 8.2.1. Confectionery
- 8.2.2. Bakery Products
- 8.2.3. Dairy & Frozen Food
- 8.2.4. Beverages
- 8.2.5. Meat, Poultry, and Sea Food
- 8.2.6. Others
- 8.1. Market Analysis, Insights and Forecast - by Type
- 9. Middle East & Africa US Food Additives Industry Analysis, Insights and Forecast, 2019-2031
- 9.1. Market Analysis, Insights and Forecast - by Type
- 9.1.1. Preservatives
- 9.1.2. Sweetener
- 9.1.3. Sugar Substitutes
- 9.1.4. Emulsifier
- 9.1.5. Anti-Caking Agents
- 9.1.6. Enzymes
- 9.1.7. Hydrocolloids
- 9.1.8. Food Flavors and Enhancers
- 9.1.9. Food Colorants
- 9.1.10. Acidulants
- 9.2. Market Analysis, Insights and Forecast - by Application
- 9.2.1. Confectionery
- 9.2.2. Bakery Products
- 9.2.3. Dairy & Frozen Food
- 9.2.4. Beverages
- 9.2.5. Meat, Poultry, and Sea Food
- 9.2.6. Others
- 9.1. Market Analysis, Insights and Forecast - by Type
- 10. Asia Pacific US Food Additives Industry Analysis, Insights and Forecast, 2019-2031
- 10.1. Market Analysis, Insights and Forecast - by Type
- 10.1.1. Preservatives
- 10.1.2. Sweetener
- 10.1.3. Sugar Substitutes
- 10.1.4. Emulsifier
- 10.1.5. Anti-Caking Agents
- 10.1.6. Enzymes
- 10.1.7. Hydrocolloids
- 10.1.8. Food Flavors and Enhancers
- 10.1.9. Food Colorants
- 10.1.10. Acidulants
- 10.2. Market Analysis, Insights and Forecast - by Application
- 10.2.1. Confectionery
- 10.2.2. Bakery Products
- 10.2.3. Dairy & Frozen Food
- 10.2.4. Beverages
- 10.2.5. Meat, Poultry, and Sea Food
- 10.2.6. Others
- 10.1. Market Analysis, Insights and Forecast - by Type
- 11. Northeast US Food Additives Industry Analysis, Insights and Forecast, 2019-2031
- 12. Southeast US Food Additives Industry Analysis, Insights and Forecast, 2019-2031
- 13. Midwest US Food Additives Industry Analysis, Insights and Forecast, 2019-2031
- 14. Southwest US Food Additives Industry Analysis, Insights and Forecast, 2019-2031
- 15. West US Food Additives Industry Analysis, Insights and Forecast, 2019-2031
- 16. Competitive Analysis
- 16.1. Global Market Share Analysis 2024
- 16.2. Company Profiles
- 16.2.1 Dupont- Danisco
- 16.2.1.1. Overview
- 16.2.1.2. Products
- 16.2.1.3. SWOT Analysis
- 16.2.1.4. Recent Developments
- 16.2.1.5. Financials (Based on Availability)
- 16.2.2 Cargill Incorporated
- 16.2.2.1. Overview
- 16.2.2.2. Products
- 16.2.2.3. SWOT Analysis
- 16.2.2.4. Recent Developments
- 16.2.2.5. Financials (Based on Availability)
- 16.2.3 Novozymes
- 16.2.3.1. Overview
- 16.2.3.2. Products
- 16.2.3.3. SWOT Analysis
- 16.2.3.4. Recent Developments
- 16.2.3.5. Financials (Based on Availability)
- 16.2.4 Kerry Inc
- 16.2.4.1. Overview
- 16.2.4.2. Products
- 16.2.4.3. SWOT Analysis
- 16.2.4.4. Recent Developments
- 16.2.4.5. Financials (Based on Availability)
- 16.2.5 Archer Daniels Midland Company
- 16.2.5.1. Overview
- 16.2.5.2. Products
- 16.2.5.3. SWOT Analysis
- 16.2.5.4. Recent Developments
- 16.2.5.5. Financials (Based on Availability)
- 16.2.6 Koninklijke DSM N V
- 16.2.6.1. Overview
- 16.2.6.2. Products
- 16.2.6.3. SWOT Analysis
- 16.2.6.4. Recent Developments
- 16.2.6.5. Financials (Based on Availability)
- 16.2.7 Corbion NV
- 16.2.7.1. Overview
- 16.2.7.2. Products
- 16.2.7.3. SWOT Analysis
- 16.2.7.4. Recent Developments
- 16.2.7.5. Financials (Based on Availability)
- 16.2.8 Tate & Lyle
- 16.2.8.1. Overview
- 16.2.8.2. Products
- 16.2.8.3. SWOT Analysis
- 16.2.8.4. Recent Developments
- 16.2.8.5. Financials (Based on Availability)
- 16.2.1 Dupont- Danisco
List of Figures
- Figure 1: Global US Food Additives Industry Revenue Breakdown (Million, %) by Region 2024 & 2032
- Figure 2: United states US Food Additives Industry Revenue (Million), by Country 2024 & 2032
- Figure 3: United states US Food Additives Industry Revenue Share (%), by Country 2024 & 2032
- Figure 4: North America US Food Additives Industry Revenue (Million), by Type 2024 & 2032
- Figure 5: North America US Food Additives Industry Revenue Share (%), by Type 2024 & 2032
- Figure 6: North America US Food Additives Industry Revenue (Million), by Application 2024 & 2032
- Figure 7: North America US Food Additives Industry Revenue Share (%), by Application 2024 & 2032
- Figure 8: North America US Food Additives Industry Revenue (Million), by Country 2024 & 2032
- Figure 9: North America US Food Additives Industry Revenue Share (%), by Country 2024 & 2032
- Figure 10: South America US Food Additives Industry Revenue (Million), by Type 2024 & 2032
- Figure 11: South America US Food Additives Industry Revenue Share (%), by Type 2024 & 2032
- Figure 12: South America US Food Additives Industry Revenue (Million), by Application 2024 & 2032
- Figure 13: South America US Food Additives Industry Revenue Share (%), by Application 2024 & 2032
- Figure 14: South America US Food Additives Industry Revenue (Million), by Country 2024 & 2032
- Figure 15: South America US Food Additives Industry Revenue Share (%), by Country 2024 & 2032
- Figure 16: Europe US Food Additives Industry Revenue (Million), by Type 2024 & 2032
- Figure 17: Europe US Food Additives Industry Revenue Share (%), by Type 2024 & 2032
- Figure 18: Europe US Food Additives Industry Revenue (Million), by Application 2024 & 2032
- Figure 19: Europe US Food Additives Industry Revenue Share (%), by Application 2024 & 2032
- Figure 20: Europe US Food Additives Industry Revenue (Million), by Country 2024 & 2032
- Figure 21: Europe US Food Additives Industry Revenue Share (%), by Country 2024 & 2032
- Figure 22: Middle East & Africa US Food Additives Industry Revenue (Million), by Type 2024 & 2032
- Figure 23: Middle East & Africa US Food Additives Industry Revenue Share (%), by Type 2024 & 2032
- Figure 24: Middle East & Africa US Food Additives Industry Revenue (Million), by Application 2024 & 2032
- Figure 25: Middle East & Africa US Food Additives Industry Revenue Share (%), by Application 2024 & 2032
- Figure 26: Middle East & Africa US Food Additives Industry Revenue (Million), by Country 2024 & 2032
- Figure 27: Middle East & Africa US Food Additives Industry Revenue Share (%), by Country 2024 & 2032
- Figure 28: Asia Pacific US Food Additives Industry Revenue (Million), by Type 2024 & 2032
- Figure 29: Asia Pacific US Food Additives Industry Revenue Share (%), by Type 2024 & 2032
- Figure 30: Asia Pacific US Food Additives Industry Revenue (Million), by Application 2024 & 2032
- Figure 31: Asia Pacific US Food Additives Industry Revenue Share (%), by Application 2024 & 2032
- Figure 32: Asia Pacific US Food Additives Industry Revenue (Million), by Country 2024 & 2032
- Figure 33: Asia Pacific US Food Additives Industry Revenue Share (%), by Country 2024 & 2032
List of Tables
- Table 1: Global US Food Additives Industry Revenue Million Forecast, by Region 2019 & 2032
- Table 2: Global US Food Additives Industry Revenue Million Forecast, by Type 2019 & 2032
- Table 3: Global US Food Additives Industry Revenue Million Forecast, by Application 2019 & 2032
- Table 4: Global US Food Additives Industry Revenue Million Forecast, by Region 2019 & 2032
- Table 5: Global US Food Additives Industry Revenue Million Forecast, by Country 2019 & 2032
- Table 6: Northeast US Food Additives Industry Revenue (Million) Forecast, by Application 2019 & 2032
- Table 7: Southeast US Food Additives Industry Revenue (Million) Forecast, by Application 2019 & 2032
- Table 8: Midwest US Food Additives Industry Revenue (Million) Forecast, by Application 2019 & 2032
- Table 9: Southwest US Food Additives Industry Revenue (Million) Forecast, by Application 2019 & 2032
- Table 10: West US Food Additives Industry Revenue (Million) Forecast, by Application 2019 & 2032
- Table 11: Global US Food Additives Industry Revenue Million Forecast, by Type 2019 & 2032
- Table 12: Global US Food Additives Industry Revenue Million Forecast, by Application 2019 & 2032
- Table 13: Global US Food Additives Industry Revenue Million Forecast, by Country 2019 & 2032
- Table 14: United States US Food Additives Industry Revenue (Million) Forecast, by Application 2019 & 2032
- Table 15: Canada US Food Additives Industry Revenue (Million) Forecast, by Application 2019 & 2032
- Table 16: Mexico US Food Additives Industry Revenue (Million) Forecast, by Application 2019 & 2032
- Table 17: Global US Food Additives Industry Revenue Million Forecast, by Type 2019 & 2032
- Table 18: Global US Food Additives Industry Revenue Million Forecast, by Application 2019 & 2032
- Table 19: Global US Food Additives Industry Revenue Million Forecast, by Country 2019 & 2032
- Table 20: Brazil US Food Additives Industry Revenue (Million) Forecast, by Application 2019 & 2032
- Table 21: Argentina US Food Additives Industry Revenue (Million) Forecast, by Application 2019 & 2032
- Table 22: Rest of South America US Food Additives Industry Revenue (Million) Forecast, by Application 2019 & 2032
- Table 23: Global US Food Additives Industry Revenue Million Forecast, by Type 2019 & 2032
- Table 24: Global US Food Additives Industry Revenue Million Forecast, by Application 2019 & 2032
- Table 25: Global US Food Additives Industry Revenue Million Forecast, by Country 2019 & 2032
- Table 26: United Kingdom US Food Additives Industry Revenue (Million) Forecast, by Application 2019 & 2032
- Table 27: Germany US Food Additives Industry Revenue (Million) Forecast, by Application 2019 & 2032
- Table 28: France US Food Additives Industry Revenue (Million) Forecast, by Application 2019 & 2032
- Table 29: Italy US Food Additives Industry Revenue (Million) Forecast, by Application 2019 & 2032
- Table 30: Spain US Food Additives Industry Revenue (Million) Forecast, by Application 2019 & 2032
- Table 31: Russia US Food Additives Industry Revenue (Million) Forecast, by Application 2019 & 2032
- Table 32: Benelux US Food Additives Industry Revenue (Million) Forecast, by Application 2019 & 2032
- Table 33: Nordics US Food Additives Industry Revenue (Million) Forecast, by Application 2019 & 2032
- Table 34: Rest of Europe US Food Additives Industry Revenue (Million) Forecast, by Application 2019 & 2032
- Table 35: Global US Food Additives Industry Revenue Million Forecast, by Type 2019 & 2032
- Table 36: Global US Food Additives Industry Revenue Million Forecast, by Application 2019 & 2032
- Table 37: Global US Food Additives Industry Revenue Million Forecast, by Country 2019 & 2032
- Table 38: Turkey US Food Additives Industry Revenue (Million) Forecast, by Application 2019 & 2032
- Table 39: Israel US Food Additives Industry Revenue (Million) Forecast, by Application 2019 & 2032
- Table 40: GCC US Food Additives Industry Revenue (Million) Forecast, by Application 2019 & 2032
- Table 41: North Africa US Food Additives Industry Revenue (Million) Forecast, by Application 2019 & 2032
- Table 42: South Africa US Food Additives Industry Revenue (Million) Forecast, by Application 2019 & 2032
- Table 43: Rest of Middle East & Africa US Food Additives Industry Revenue (Million) Forecast, by Application 2019 & 2032
- Table 44: Global US Food Additives Industry Revenue Million Forecast, by Type 2019 & 2032
- Table 45: Global US Food Additives Industry Revenue Million Forecast, by Application 2019 & 2032
- Table 46: Global US Food Additives Industry Revenue Million Forecast, by Country 2019 & 2032
- Table 47: China US Food Additives Industry Revenue (Million) Forecast, by Application 2019 & 2032
- Table 48: India US Food Additives Industry Revenue (Million) Forecast, by Application 2019 & 2032
- Table 49: Japan US Food Additives Industry Revenue (Million) Forecast, by Application 2019 & 2032
- Table 50: South Korea US Food Additives Industry Revenue (Million) Forecast, by Application 2019 & 2032
- Table 51: ASEAN US Food Additives Industry Revenue (Million) Forecast, by Application 2019 & 2032
- Table 52: Oceania US Food Additives Industry Revenue (Million) Forecast, by Application 2019 & 2032
- Table 53: Rest of Asia Pacific US Food Additives Industry Revenue (Million) Forecast, by Application 2019 & 2032
Frequently Asked Questions
1. What is the projected Compound Annual Growth Rate (CAGR) of the US Food Additives Industry?
The projected CAGR is approximately 3.76%.
2. Which companies are prominent players in the US Food Additives Industry?
Key companies in the market include Dupont- Danisco, Cargill Incorporated, Novozymes, Kerry Inc, Archer Daniels Midland Company, Koninklijke DSM N V, Corbion NV, Tate & Lyle.
3. What are the main segments of the US Food Additives Industry?
The market segments include Type, Application.
4. Can you provide details about the market size?
The market size is estimated to be USD XX Million as of 2022.
5. What are some drivers contributing to market growth?
Wide Applications and Functionality; Demand For Gluten-Free Products.
6. What are the notable trends driving market growth?
Growing Demand for Retail Food.
7. Are there any restraints impacting market growth?
Easy Availability of Economically Feasible Alternatives.
8. Can you provide examples of recent developments in the market?
1. Acquisition of Tate & Lyle by Symrise in 2021 2. Launch of new preservative-free, clean label additives by Cargill in 2022 3. Investment in plant-based food additives by DuPont-Danisco in 2023
9. What pricing options are available for accessing the report?
Pricing options include single-user, multi-user, and enterprise licenses priced at USD 3800, USD 4500, and USD 5800 respectively.
10. Is the market size provided in terms of value or volume?
The market size is provided in terms of value, measured in Million.
11. Are there any specific market keywords associated with the report?
Yes, the market keyword associated with the report is "US Food Additives Industry," which aids in identifying and referencing the specific market segment covered.
12. How do I determine which pricing option suits my needs best?
The pricing options vary based on user requirements and access needs. Individual users may opt for single-user licenses, while businesses requiring broader access may choose multi-user or enterprise licenses for cost-effective access to the report.
13. Are there any additional resources or data provided in the US Food Additives Industry report?
While the report offers comprehensive insights, it's advisable to review the specific contents or supplementary materials provided to ascertain if additional resources or data are available.
14. How can I stay updated on further developments or reports in the US Food Additives Industry?
To stay informed about further developments, trends, and reports in the US Food Additives Industry, consider subscribing to industry newsletters, following relevant companies and organizations, or regularly checking reputable industry news sources and publications.
Methodology
Step 1 - Identification of Relevant Samples Size from Population Database


Step 2 - Approaches for Defining Global Market Size (Value, Volume* & Price*)

Note*: In applicable scenarios
Step 3 - Data Sources
Primary Research
- Web Analytics
- Survey Reports
- Research Institute
- Latest Research Reports
- Opinion Leaders
Secondary Research
- Annual Reports
- White Paper
- Latest Press Release
- Industry Association
- Paid Database
- Investor Presentations

Step 4 - Data Triangulation
Involves using different sources of information in order to increase the validity of a study
These sources are likely to be stakeholders in a program - participants, other researchers, program staff, other community members, and so on.
Then we put all data in single framework & apply various statistical tools to find out the dynamic on the market.
During the analysis stage, feedback from the stakeholder groups would be compared to determine areas of agreement as well as areas of divergence


