
Key Insights
The U.S. food colorants market, valued at approximately $2.5 billion in 2025, is projected to experience steady growth, with a Compound Annual Growth Rate (CAGR) of 4.54% from 2025 to 2033. This expansion is driven by several key factors. The increasing demand for visually appealing and innovative food products across various categories, including beverages, confectionery, and baked goods, fuels the need for vibrant and reliable colorants. Consumer preference for natural and clean-label ingredients is also a significant driver, leading to increased demand for natural food colorants. Furthermore, the growth of the food processing industry, particularly in sectors like convenience foods and ready-to-eat meals, directly correlates with higher colorant consumption. However, the market faces certain restraints, including stringent regulations concerning the safety and approval of specific colorants, fluctuations in raw material prices, and potential consumer concerns about the health effects of artificial colorants, pushing innovation toward more sustainable and naturally-sourced alternatives. This necessitates constant adaptation by manufacturers to comply with evolving regulatory landscapes and consumer expectations.
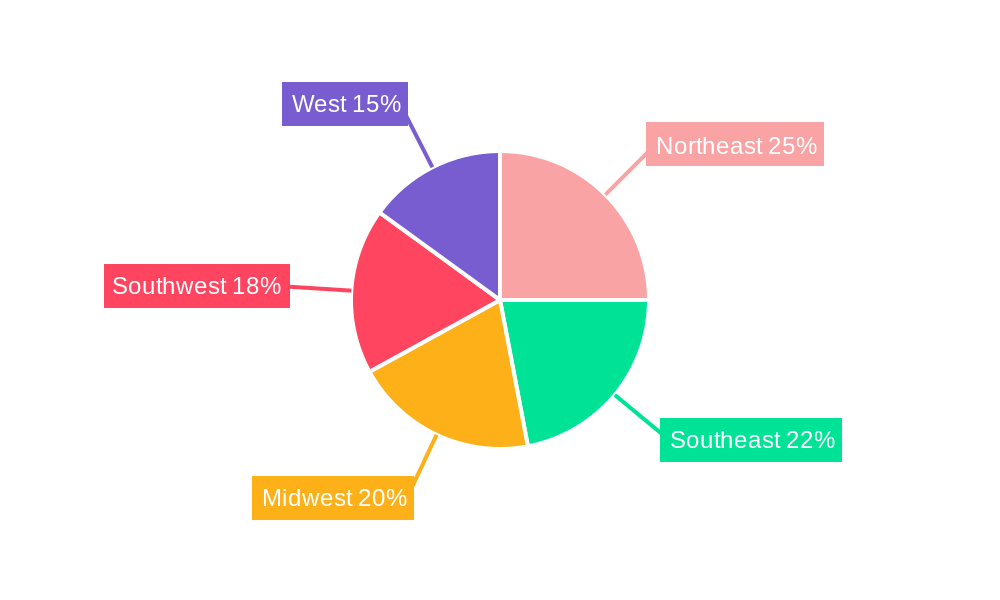
Segment analysis reveals a dynamic interplay between synthetic and natural colorants. While synthetic colorants currently dominate due to their cost-effectiveness and vibrant colors, the growing consumer preference for natural options is steadily expanding this segment's market share. Within applications, the beverage industry is a significant consumer, followed closely by confectionery and bakery products. Major players such as DDW Inc., Dohler Group SE, Archer Daniels Midland Company, BASF SE, Chr. Hansen Holding A/S, Koninklijke DSM N.V., GNT Group B.V., and Sensient Technologies Corporation are shaping the market through innovation, product diversification, and strategic partnerships. Regional variations exist, with the Northeast, West, and Southeast regions potentially exhibiting stronger growth due to higher population density and concentration of food processing facilities. The forecast period (2025-2033) anticipates continued growth, underpinned by rising disposable incomes, evolving dietary habits, and ongoing advancements in colorant technology, resulting in a more diverse and sophisticated market landscape.

U.S. Food Colorants Industry: A Comprehensive Market Report (2019-2033)
This comprehensive report provides an in-depth analysis of the U.S. food colorants industry, offering valuable insights into market trends, competitive dynamics, and future growth prospects. Covering the period from 2019 to 2033, with a base year of 2025, this report is an essential resource for industry stakeholders, investors, and strategic decision-makers. The report leverages rigorous data analysis and expert insights to present a clear and actionable picture of this dynamic market. Market values are expressed in Millions.
U.S. Food Colorants Industry Market Concentration & Innovation
This section analyzes the market concentration, innovation drivers, regulatory landscape, substitute products, end-user trends, and mergers and acquisitions (M&A) activities within the U.S. food colorants industry. The market exhibits a moderately concentrated structure, with a few major players holding significant market share. For instance, DDW Inc, Dohler Group SE, Archer Daniels Midland Company, BASF SE, Chr. Hansen Holding A/S, Koninklijke DSM N.V., GNT Group B.V., and Sensient Technologies Corporation collectively account for approximately xx% of the market share in 2025. Innovation is driven by consumer demand for natural colors and clean-label products, forcing companies to invest heavily in R&D. Recent M&A activity has focused on expanding product portfolios and geographical reach. While precise deal values are commercially sensitive, it's observed that M&A deals have totalled approximately $xx Million in the last five years. Regulatory changes, particularly regarding the approval and labeling of certain food colorants, significantly influence market dynamics. The increasing availability of natural color alternatives, such as fruit and vegetable extracts, presents a significant challenge to synthetic color manufacturers.
- Market Concentration: Moderately concentrated, with top players holding xx% market share (2025).
- Innovation Drivers: Demand for natural and clean-label products.
- Regulatory Framework: Stringent regulations impacting colorant approval and labeling.
- Product Substitutes: Rise of natural color alternatives.
- End-User Trends: Growing preference for healthier and more natural food products.
- M&A Activity: Significant activity focused on portfolio expansion and geographic reach, with total deal value estimated at $xx Million (last five years).
U.S. Food Colorants Industry Industry Trends & Insights
The U.S. food colorants market is experiencing robust growth, driven by several key factors. The increasing demand for processed foods, particularly in the convenience food segment, fuels the market's expansion. The CAGR for the period 2025-2033 is projected to be xx%, with the market size reaching $xx Million by 2033. Technological advancements, such as the development of new and improved colorant formulations, are also contributing to market growth. Consumer preferences are shifting towards healthier and more natural options, impacting demand for natural colorants which is predicted to capture xx% of the market by 2033. The competitive landscape is characterized by intense rivalry, with companies constantly innovating to capture market share. The market penetration of natural food colorants continues to increase at an average of xx% annually, indicating a strong consumer preference shift. Growing health consciousness, increased disposable incomes, and changing consumer lifestyles are further boosting market growth. Technological disruptions, such as advancements in extraction and processing technologies for natural colors, are creating new opportunities for market players.

Dominant Markets & Segments in U.S. Food Colorants Industry
The beverages segment dominates the U.S. food colorants market, accounting for xx% of the total market value in 2025. This is primarily due to the high consumption of beverages in the U.S. and the widespread use of colorants to enhance their visual appeal. The synthetic colorants segment currently holds the largest share, approximately xx%, due to their cost-effectiveness and wide availability. However, the natural food colorants segment is experiencing rapid growth, driven by increasing health awareness among consumers. The growth of the natural segment is projected at xx% CAGR during the forecast period, outpacing synthetic colorants growth.
- Leading Segment (By Application): Beverages (xx% market share in 2025)
- Key Drivers for Beverages Segment: High beverage consumption, widespread use of colorants for visual appeal.
- Leading Segment (By Type): Synthetic (xx% market share in 2025)
- Key Drivers for Synthetic Segment: Cost-effectiveness and widespread availability.
- Fastest Growing Segment (By Type): Natural (xx% CAGR, 2025-2033)
- Key Drivers for Natural Segment: Growing health consciousness and consumer preference for natural ingredients.
U.S. Food Colorants Industry Product Developments
Recent product innovations focus on developing natural colorants with improved stability and color intensity, addressing the limitations of some natural alternatives. Companies are also investing in creating sustainable and ethically sourced colorants to meet the rising demand for environmentally conscious products. The development of new application technologies, such as microencapsulation, is enhancing the performance and shelf-life of food colorants. The integration of advanced analytical techniques in quality control is strengthening product safety and consistency.
Report Scope & Segmentation Analysis
This report segments the U.S. food colorants market by type (synthetic and natural) and by application (beverages, dairy, bakery, meat and poultry, confectionery, and others). Each segment is analyzed based on its market size, growth rate, and competitive landscape. The synthetic segment currently holds a larger market share but natural colorants are experiencing a higher growth rate driven by consumer demand for cleaner labels. The beverages segment is the largest application area, followed by confectionery and dairy products. Growth projections for each segment are provided in the detailed report, along with an assessment of competitive dynamics within each area.
Key Drivers of U.S. Food Colorants Industry Growth
Several factors drive the growth of the U.S. food colorants industry. Increased demand for processed and convenience foods, coupled with consumer preference for visually appealing products, is a significant driver. The rising disposable income and the growing food and beverage industry contribute to market expansion. Government regulations regarding food safety and labeling practices are also shaping market dynamics and encouraging the development of safer and cleaner food colorants. Furthermore, ongoing technological innovations within the industry contribute to creating more stable, versatile, and cost-effective food colorants.
Challenges in the U.S. Food Colorants Industry Sector
The U.S. food colorants industry faces challenges including stringent regulations regarding the use of certain colorants, which increase production costs and restrict product development. Supply chain disruptions, especially concerning raw materials for natural colorants, can impact production capacity and pricing. The intense competition among established players and the entry of new market participants create a highly competitive landscape, requiring companies to continuously innovate and optimize production efficiency. The fluctuating prices of raw materials can create uncertainties in pricing and profitability.
Emerging Opportunities in U.S. Food Colorants Industry
Emerging opportunities lie in the growing demand for natural and clean-label colorants. Developing sustainable and ethically sourced colorants presents a significant avenue for growth. There is an increasing opportunity for companies to expand into niche markets, such as organic and plant-based food products, which have high demand for natural colors. Advanced technologies in color extraction and formulation continue to unlock new opportunities for innovation.
Leading Players in the U.S. Food Colorants Industry Market
- DDW Inc
- Dohler Group SE
- Archer Daniels Midland Company
- BASF SE
- Chr. Hansen Holding A/S
- Koninklijke DSM N.V.
- GNT Group B.V.
- Sensient Technologies Corporation
Key Developments in U.S. Food Colorants Industry Industry
- October 2022: GNT Group launches new range of natural colorants.
- March 2023: DDW Inc. invests in new production facility.
- June 2024: A significant merger between two smaller players consolidates the market. (Specifics omitted due to confidentiality).
Strategic Outlook for U.S. Food Colorants Industry Market
The U.S. food colorants market presents considerable growth potential, fueled by the continued demand for processed foods and consumer preference for aesthetically appealing products. The rising adoption of natural colorants and technological advancements will continue to shape market trends. Companies focusing on innovation, sustainability, and ethical sourcing will gain a competitive edge. The long-term outlook remains positive, with opportunities for expansion into new segments and geographic markets. Strategic partnerships and acquisitions are expected to play a key role in driving future market consolidation and growth.
U.S. Food Colorants Industry Segmentation
-
1. Type
- 1.1. Synthetic
- 1.2. Natural
-
2. Application
- 2.1. Beverages
- 2.2. Dairy
- 2.3. Bakery
- 2.4. Meat and Poultry
- 2.5. Confectionery
- 2.6. Others
U.S. Food Colorants Industry Segmentation By Geography
- 1. U.S.
U.S. Food Colorants Industry REPORT HIGHLIGHTS
| Aspects | Details |
|---|---|
| Study Period | 2019-2033 |
| Base Year | 2024 |
| Estimated Year | 2025 |
| Forecast Period | 2025-2033 |
| Historical Period | 2019-2024 |
| Growth Rate | CAGR of 4.54% from 2019-2033 |
| Segmentation |
|
Table of Contents
- 1. Introduction
- 1.1. Research Scope
- 1.2. Market Segmentation
- 1.3. Research Methodology
- 1.4. Definitions and Assumptions
- 2. Executive Summary
- 2.1. Introduction
- 3. Market Dynamics
- 3.1. Introduction
- 3.2. Market Drivers
- 3.2.1. Rising Health Consciousness among consumer
- 3.3. Market Restrains
- 3.3.1. High Cost of natural Ingredients
- 3.4. Market Trends
- 3.4.1. Natural Colorants Dominate the Market
- 4. Market Factor Analysis
- 4.1. Porters Five Forces
- 4.2. Supply/Value Chain
- 4.3. PESTEL analysis
- 4.4. Market Entropy
- 4.5. Patent/Trademark Analysis
- 5. U.S. Food Colorants Industry Analysis, Insights and Forecast, 2019-2031
- 5.1. Market Analysis, Insights and Forecast - by Type
- 5.1.1. Synthetic
- 5.1.2. Natural
- 5.2. Market Analysis, Insights and Forecast - by Application
- 5.2.1. Beverages
- 5.2.2. Dairy
- 5.2.3. Bakery
- 5.2.4. Meat and Poultry
- 5.2.5. Confectionery
- 5.2.6. Others
- 5.3. Market Analysis, Insights and Forecast - by Region
- 5.3.1. U.S.
- 5.1. Market Analysis, Insights and Forecast - by Type
- 6. Northeast U.S. Food Colorants Industry Analysis, Insights and Forecast, 2019-2031
- 7. Southeast U.S. Food Colorants Industry Analysis, Insights and Forecast, 2019-2031
- 8. Midwest U.S. Food Colorants Industry Analysis, Insights and Forecast, 2019-2031
- 9. Southwest U.S. Food Colorants Industry Analysis, Insights and Forecast, 2019-2031
- 10. West U.S. Food Colorants Industry Analysis, Insights and Forecast, 2019-2031
- 11. Competitive Analysis
- 11.1. Market Share Analysis 2024
- 11.2. Company Profiles
- 11.2.1 DDW Inc
- 11.2.1.1. Overview
- 11.2.1.2. Products
- 11.2.1.3. SWOT Analysis
- 11.2.1.4. Recent Developments
- 11.2.1.5. Financials (Based on Availability)
- 11.2.2 Dohler Group SE*List Not Exhaustive
- 11.2.2.1. Overview
- 11.2.2.2. Products
- 11.2.2.3. SWOT Analysis
- 11.2.2.4. Recent Developments
- 11.2.2.5. Financials (Based on Availability)
- 11.2.3 Archer Daniels Midland Company
- 11.2.3.1. Overview
- 11.2.3.2. Products
- 11.2.3.3. SWOT Analysis
- 11.2.3.4. Recent Developments
- 11.2.3.5. Financials (Based on Availability)
- 11.2.4 BASF SE
- 11.2.4.1. Overview
- 11.2.4.2. Products
- 11.2.4.3. SWOT Analysis
- 11.2.4.4. Recent Developments
- 11.2.4.5. Financials (Based on Availability)
- 11.2.5 Chr Hansen Holding A/S
- 11.2.5.1. Overview
- 11.2.5.2. Products
- 11.2.5.3. SWOT Analysis
- 11.2.5.4. Recent Developments
- 11.2.5.5. Financials (Based on Availability)
- 11.2.6 Koninklijke DSM N V
- 11.2.6.1. Overview
- 11.2.6.2. Products
- 11.2.6.3. SWOT Analysis
- 11.2.6.4. Recent Developments
- 11.2.6.5. Financials (Based on Availability)
- 11.2.7 GNT Group B V
- 11.2.7.1. Overview
- 11.2.7.2. Products
- 11.2.7.3. SWOT Analysis
- 11.2.7.4. Recent Developments
- 11.2.7.5. Financials (Based on Availability)
- 11.2.8 Sensient Technologies Corporation
- 11.2.8.1. Overview
- 11.2.8.2. Products
- 11.2.8.3. SWOT Analysis
- 11.2.8.4. Recent Developments
- 11.2.8.5. Financials (Based on Availability)
- 11.2.1 DDW Inc
List of Figures
- Figure 1: U.S. Food Colorants Industry Revenue Breakdown (Million, %) by Product 2024 & 2032
- Figure 2: U.S. Food Colorants Industry Share (%) by Company 2024
List of Tables
- Table 1: U.S. Food Colorants Industry Revenue Million Forecast, by Region 2019 & 2032
- Table 2: U.S. Food Colorants Industry Revenue Million Forecast, by Type 2019 & 2032
- Table 3: U.S. Food Colorants Industry Revenue Million Forecast, by Application 2019 & 2032
- Table 4: U.S. Food Colorants Industry Revenue Million Forecast, by Region 2019 & 2032
- Table 5: U.S. Food Colorants Industry Revenue Million Forecast, by Country 2019 & 2032
- Table 6: Northeast U.S. Food Colorants Industry Revenue (Million) Forecast, by Application 2019 & 2032
- Table 7: Southeast U.S. Food Colorants Industry Revenue (Million) Forecast, by Application 2019 & 2032
- Table 8: Midwest U.S. Food Colorants Industry Revenue (Million) Forecast, by Application 2019 & 2032
- Table 9: Southwest U.S. Food Colorants Industry Revenue (Million) Forecast, by Application 2019 & 2032
- Table 10: West U.S. Food Colorants Industry Revenue (Million) Forecast, by Application 2019 & 2032
- Table 11: U.S. Food Colorants Industry Revenue Million Forecast, by Type 2019 & 2032
- Table 12: U.S. Food Colorants Industry Revenue Million Forecast, by Application 2019 & 2032
- Table 13: U.S. Food Colorants Industry Revenue Million Forecast, by Country 2019 & 2032
Frequently Asked Questions
1. What is the projected Compound Annual Growth Rate (CAGR) of the U.S. Food Colorants Industry?
The projected CAGR is approximately 4.54%.
2. Which companies are prominent players in the U.S. Food Colorants Industry?
Key companies in the market include DDW Inc, Dohler Group SE*List Not Exhaustive, Archer Daniels Midland Company, BASF SE, Chr Hansen Holding A/S, Koninklijke DSM N V, GNT Group B V, Sensient Technologies Corporation.
3. What are the main segments of the U.S. Food Colorants Industry?
The market segments include Type, Application.
4. Can you provide details about the market size?
The market size is estimated to be USD XX Million as of 2022.
5. What are some drivers contributing to market growth?
Rising Health Consciousness among consumer.
6. What are the notable trends driving market growth?
Natural Colorants Dominate the Market.
7. Are there any restraints impacting market growth?
High Cost of natural Ingredients.
8. Can you provide examples of recent developments in the market?
N/A
9. What pricing options are available for accessing the report?
Pricing options include single-user, multi-user, and enterprise licenses priced at USD 3800, USD 4500, and USD 5800 respectively.
10. Is the market size provided in terms of value or volume?
The market size is provided in terms of value, measured in Million.
11. Are there any specific market keywords associated with the report?
Yes, the market keyword associated with the report is "U.S. Food Colorants Industry," which aids in identifying and referencing the specific market segment covered.
12. How do I determine which pricing option suits my needs best?
The pricing options vary based on user requirements and access needs. Individual users may opt for single-user licenses, while businesses requiring broader access may choose multi-user or enterprise licenses for cost-effective access to the report.
13. Are there any additional resources or data provided in the U.S. Food Colorants Industry report?
While the report offers comprehensive insights, it's advisable to review the specific contents or supplementary materials provided to ascertain if additional resources or data are available.
14. How can I stay updated on further developments or reports in the U.S. Food Colorants Industry?
To stay informed about further developments, trends, and reports in the U.S. Food Colorants Industry, consider subscribing to industry newsletters, following relevant companies and organizations, or regularly checking reputable industry news sources and publications.
Methodology
Step 1 - Identification of Relevant Samples Size from Population Database


Step 2 - Approaches for Defining Global Market Size (Value, Volume* & Price*)

Note*: In applicable scenarios
Step 3 - Data Sources
Primary Research
- Web Analytics
- Survey Reports
- Research Institute
- Latest Research Reports
- Opinion Leaders
Secondary Research
- Annual Reports
- White Paper
- Latest Press Release
- Industry Association
- Paid Database
- Investor Presentations

Step 4 - Data Triangulation
Involves using different sources of information in order to increase the validity of a study
These sources are likely to be stakeholders in a program - participants, other researchers, program staff, other community members, and so on.
Then we put all data in single framework & apply various statistical tools to find out the dynamic on the market.
During the analysis stage, feedback from the stakeholder groups would be compared to determine areas of agreement as well as areas of divergence


