
Key Insights
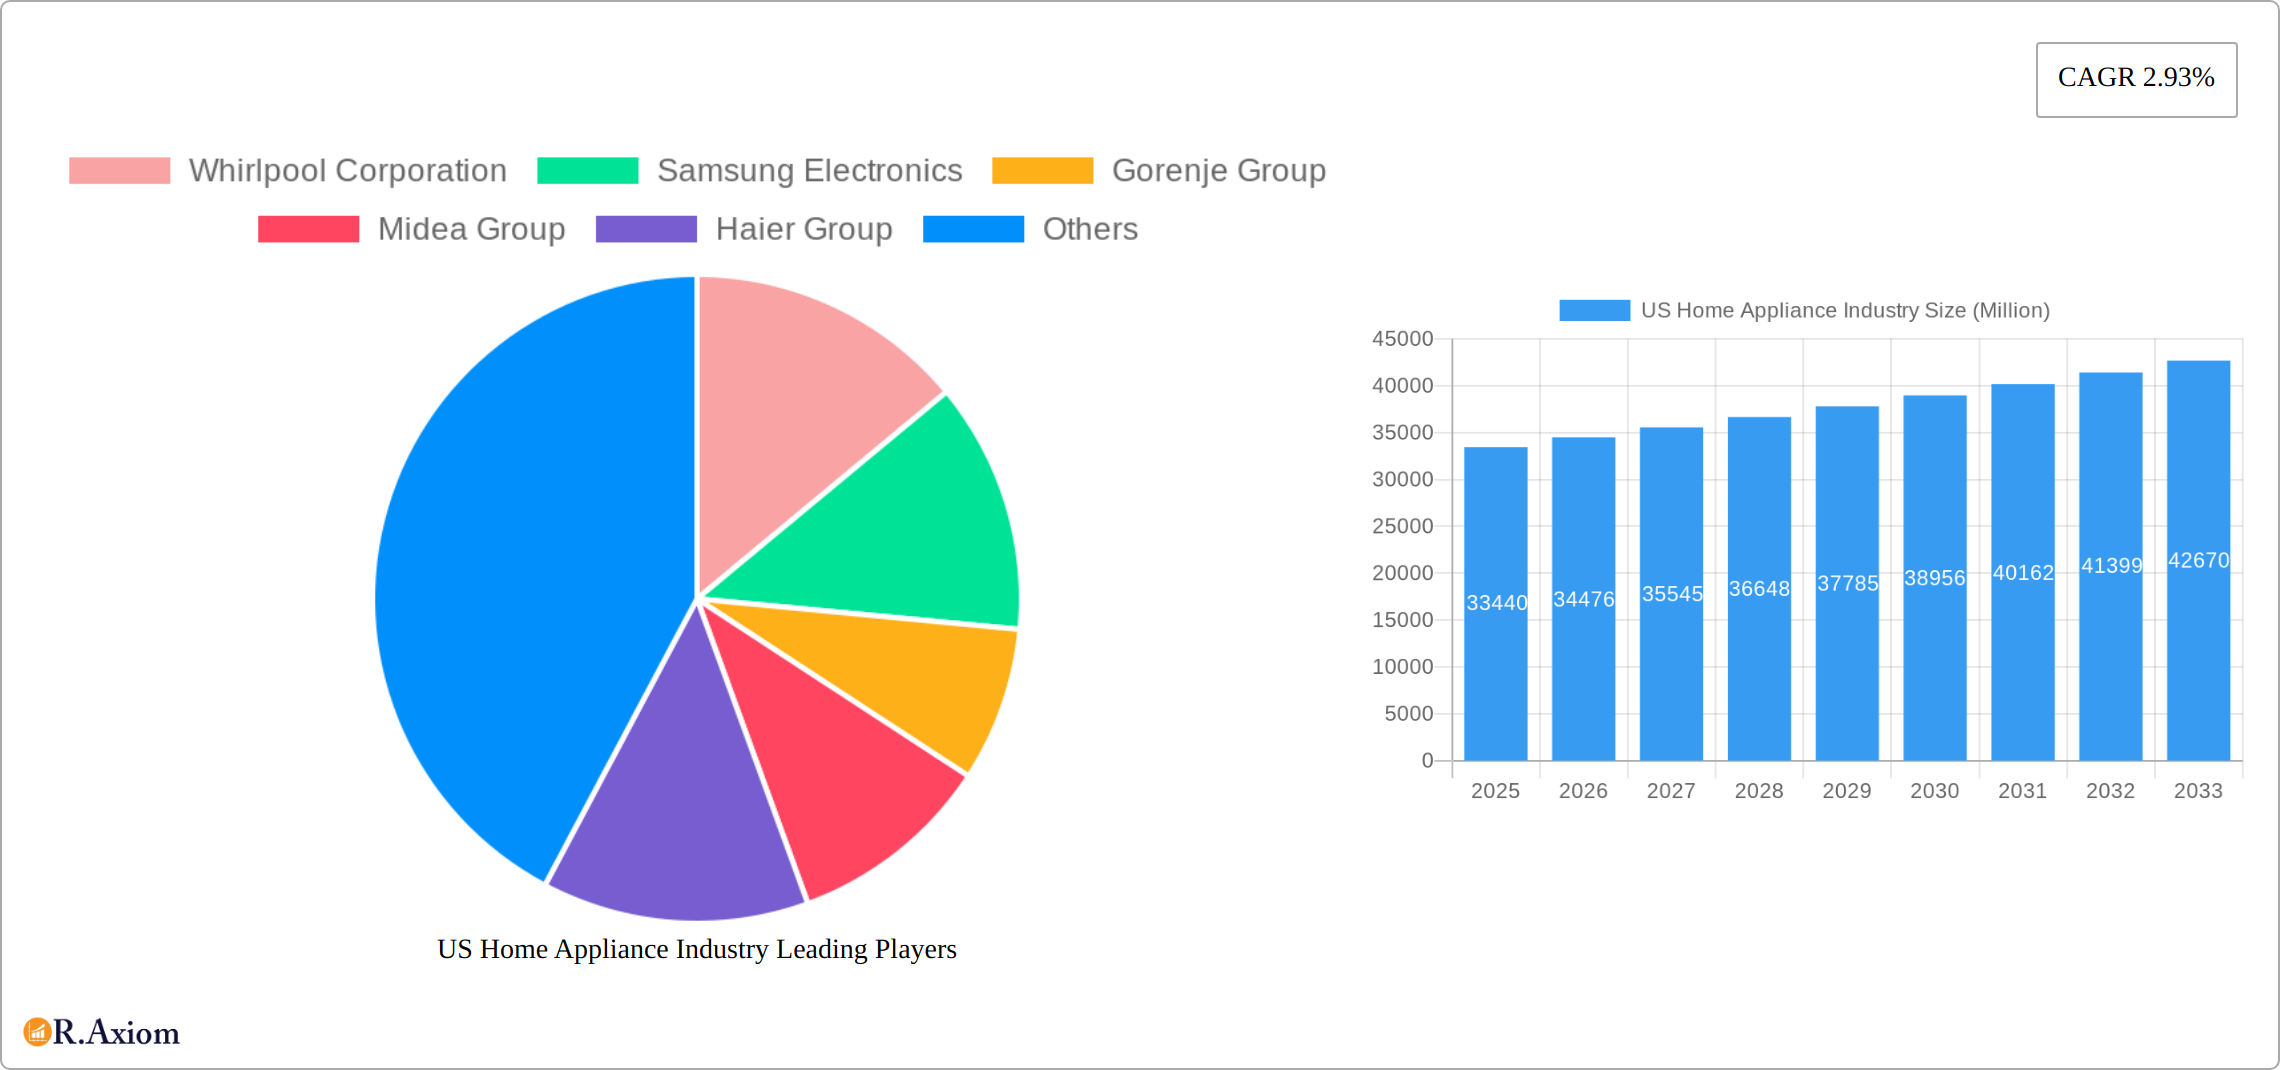
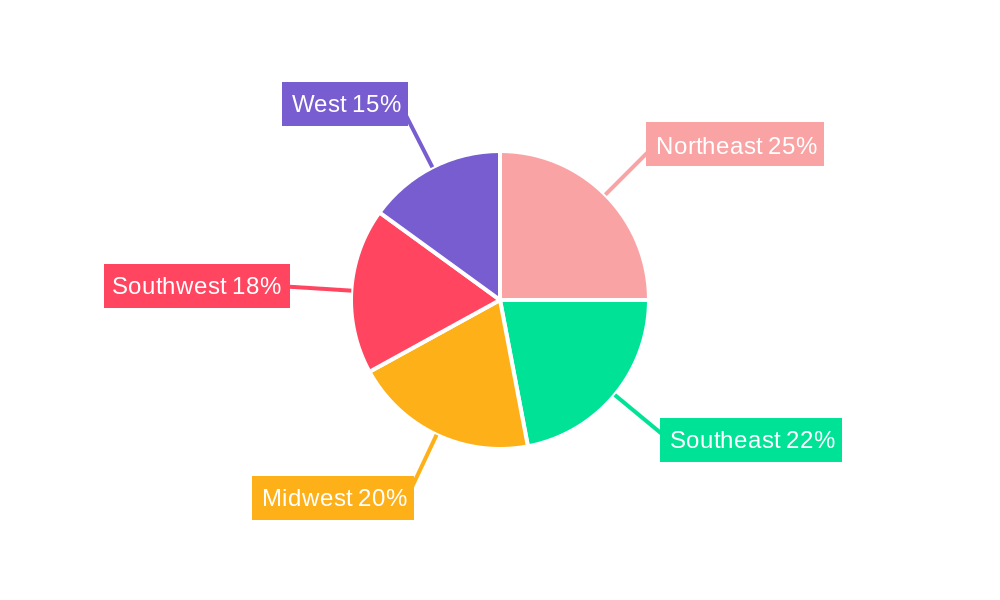
The US home appliance market, valued at $33.44 billion in 2025, is projected to experience steady growth, driven by several key factors. Rising disposable incomes, particularly among millennials and Gen Z, are fueling demand for upgraded appliances, including smart home features and energy-efficient models. Furthermore, an increasing focus on convenience and time-saving solutions is driving the adoption of sophisticated appliances like smart refrigerators and dishwashers. The trend towards smaller household sizes and apartment living is also impacting demand, with a shift towards compact and space-saving appliances. However, economic uncertainty and potential inflationary pressures could act as restraints, potentially slowing down the market's growth rate. Competition is fierce, with established players like Whirlpool, Samsung, and LG battling against newer entrants and private labels. The market is segmented by product type (refrigerators, freezers, air conditioners, dishwashers, washing machines, ovens) and distribution channel (multi-branded stores, exclusive brand outlets, online), with the online channel experiencing significant growth fueled by e-commerce expansion and improved logistics. Regional variations exist within the US, with potential differences in growth rates across Northeast, Southeast, Midwest, Southwest, and West regions due to economic conditions and population density.
Considering a CAGR of 2.93%, the market is expected to see consistent, albeit moderate, expansion over the forecast period (2025-2033). This relatively modest growth rate could be attributed to a market nearing maturity, with saturation in certain segments. However, innovation in product design, features, and energy efficiency, coupled with the increasing adoption of smart home technology, will likely continue to stimulate demand. The competitive landscape remains dynamic, with companies focusing on brand building, strategic partnerships, and technological advancements to maintain a strong market position. Understanding these dynamic forces and regional nuances will be crucial for businesses to navigate this evolving market successfully.
US Home Appliance Industry Market Report: 2019-2033
This comprehensive report provides a detailed analysis of the US home appliance industry, covering market size, segmentation, competitive landscape, and future growth projections from 2019 to 2033. The study period spans 2019-2024 (historical period), with 2025 as the base year and 2025-2033 representing the forecast period. This report is essential for industry stakeholders, investors, and market analysts seeking actionable insights into this dynamic sector.
US Home Appliance Industry Market Concentration & Innovation
The US home appliance market demonstrates a moderately concentrated competitive landscape, dominated by major players such as Whirlpool Corporation, Samsung Electronics, LG Electronics, and Electrolux AB, each commanding a significant market share. However, the presence of numerous regional and international competitors ensures a dynamic and competitive environment. While precise 2024 market share figures are proprietary, Whirlpool, Samsung, LG, and Electrolux collectively hold a substantial portion, leaving the remaining share distributed among other participants. Innovation within the industry is propelled by several key drivers: rapid technological advancements (e.g., smart appliances with integrated IoT capabilities, energy-efficient designs), evolving consumer preferences (demand for aesthetically pleasing, user-friendly appliances), and increasingly stringent government regulations (particularly concerning energy efficiency standards). Product substitution is relatively limited, with leading brands focusing on differentiation through superior features, enhanced design aesthetics, and brand reputation. The industry has witnessed considerable merger and acquisition (M&A) activity in recent years, with transaction values ranging from tens of millions to hundreds of millions of USD. These activities primarily aim to consolidate market position, expand product portfolios, and acquire cutting-edge technologies.
- Key Players: Whirlpool Corporation, Samsung Electronics, LG Electronics, Electrolux AB, and a diverse range of other national and international brands.
- Market Concentration: Moderately concentrated, with a few dominant players and a large number of smaller competitors.
- M&A Activity: Significant activity driven by strategies for market share expansion, technological advancement acquisition, and diversification.
- Innovation Drivers: Smart home integration, IoT connectivity, energy efficiency advancements, evolving consumer aesthetics, and regulatory compliance.
US Home Appliance Industry Industry Trends & Insights
The US home appliance market exhibits consistent growth, fueled by rising disposable incomes, increased urbanization, and a sustained preference for modern, convenient appliances. The Compound Annual Growth Rate (CAGR) from 2019-2024 was [Insert CAGR percentage], and projections indicate a CAGR of [Insert CAGR percentage] for the forecast period (2025-2033). Significant technological disruptions, including the widespread adoption of smart home technology and the Internet of Things (IoT), are fundamentally reshaping consumer preferences and driving demand for connected appliances. The market penetration of smart appliances is steadily increasing, with estimates of approximately [Insert Percentage]% in 2024 and a projected [Insert Percentage]% by 2033. The competitive landscape is characterized by intense rivalry, particularly amongst the leading brands, who compete aggressively through innovation, marketing strategies, and strategic partnerships. A key trend is the growing consumer preference for energy-efficient, sustainable, and aesthetically appealing appliances.
Dominant Markets & Segments in US Home Appliance Industry
The US home appliance market is segmented by product type (refrigerators, freezers, air conditioners, dishwashers, washing machines, ovens) and distribution channel (multi-branded stores, exclusive brand outlets, online). While all segments show growth, refrigerators and washing machines constitute the largest segments by revenue. The online distribution channel is experiencing the fastest growth rate, fueled by increased e-commerce adoption and convenience.
- Dominant Product Segment: Refrigerators and Washing Machines
- Fastest-Growing Distribution Channel: Online Sales
- Key Drivers:
- Economic Policies: Disposable income growth and government incentives for energy-efficient appliances.
- Infrastructure Development: Improved logistics and delivery networks supporting e-commerce.
US Home Appliance Industry Product Developments
Recent product innovations focus on smart technology integration, energy efficiency, and improved user experience. Smart features, such as Wi-Fi connectivity, voice control, and mobile app integration, are becoming increasingly common. Manufacturers are also emphasizing energy-efficient designs and eco-friendly materials to meet evolving consumer preferences and environmental regulations. These developments enhance product differentiation and provide a competitive advantage in the market. The market fit for these innovations is strong, as consumers are increasingly willing to pay a premium for technologically advanced and convenient appliances.
Report Scope & Segmentation Analysis
This report comprehensively segments the US home appliance market by product category (refrigerators, freezers, air conditioners, dishwashers, washing machines, ovens) and distribution channel (multi-branded stores, exclusive brand outlets, online). Each segment's market size, growth projections, and competitive dynamics are analyzed in detail. For instance, the refrigerator segment is expected to grow at a CAGR of xx% from 2025 to 2033, while online sales are projected to show the fastest growth across all distribution channels.
Key Drivers of US Home Appliance Industry Growth
Several key factors drive the growth of the US home appliance industry. These include rising disposable incomes leading to increased consumer spending on home improvement, technological advancements such as smart home integration boosting demand, and government initiatives promoting energy efficiency standards. The increasing adoption of e-commerce also significantly impacts market expansion.
Challenges in the US Home Appliance Industry Sector
The US home appliance industry faces several challenges including supply chain disruptions impacting production costs and availability, intense competition from both domestic and international players, and fluctuating raw material prices affecting profitability. Stringent environmental regulations also impose compliance costs on manufacturers.
Emerging Opportunities in US Home Appliance Industry
Significant opportunities exist within the expanding market for smart home appliances, eco-friendly and energy-efficient models, and high-end, premium appliances. The increasing penetration of e-commerce platforms presents substantial opportunities for established brands to expand their reach and for new entrants to gain a foothold in the market. Furthermore, the growing focus on customization and personalization offers potential for niche players to cater to specific consumer needs and preferences.
Leading Players in the US Home Appliance Industry Market
- Whirlpool Corporation
- Samsung Electronics
- Gorenje Group
- Midea Group
- Haier Group
- Bosch
- Arcelik AS
- Electrolux AB
- Panasonic Corporation
- LG Electronics
Key Developments in US Home Appliance Industry Industry
- April 2023: Haier's launch of an innovative super drum washing machine with intelligent voice control showcases the ongoing focus on technological advancement and consumer-centric features.
- November 2022: Lowe's partnership with Miele significantly expanded the availability of premium appliances in the US market, intensifying competition in the high-end segment and highlighting the importance of strategic retail partnerships.
- [Add more recent developments here with dates and brief descriptions]
Strategic Outlook for US Home Appliance Industry Market
The US home appliance market presents a promising outlook for growth, driven by continued technological innovation, shifting consumer preferences, and expanding e-commerce penetration. Focusing on smart home integration, energy efficiency, and premium product offerings will be key strategic initiatives for success in this competitive landscape. Further penetration into underserved markets and strategic partnerships will also offer substantial opportunities.
US Home Appliance Industry Segmentation
-
1. Product
- 1.1. Refrigerators
- 1.2. Freezers
- 1.3. Air-conditioners
- 1.4. Dishwashers
- 1.5. Washing Machines
- 1.6. Ovens
-
2. Distribution Channel
- 2.1. Multi-Branded Stores
- 2.2. Exclusive Brand Outlets
- 2.3. Online
US Home Appliance Industry Segmentation By Geography
-
1. North America
- 1.1. United States
- 1.2. Canada
- 1.3. Mexico
-
2. South America
- 2.1. Brazil
- 2.2. Argentina
- 2.3. Rest of South America
-
3. Europe
- 3.1. United Kingdom
- 3.2. Germany
- 3.3. France
- 3.4. Italy
- 3.5. Spain
- 3.6. Russia
- 3.7. Benelux
- 3.8. Nordics
- 3.9. Rest of Europe
-
4. Middle East & Africa
- 4.1. Turkey
- 4.2. Israel
- 4.3. GCC
- 4.4. North Africa
- 4.5. South Africa
- 4.6. Rest of Middle East & Africa
-
5. Asia Pacific
- 5.1. China
- 5.2. India
- 5.3. Japan
- 5.4. South Korea
- 5.5. ASEAN
- 5.6. Oceania
- 5.7. Rest of Asia Pacific
US Home Appliance Industry REPORT HIGHLIGHTS
| Aspects | Details |
|---|---|
| Study Period | 2019-2033 |
| Base Year | 2024 |
| Estimated Year | 2025 |
| Forecast Period | 2025-2033 |
| Historical Period | 2019-2024 |
| Growth Rate | CAGR of 2.93% from 2019-2033 |
| Segmentation |
|
Table of Contents
- 1. Introduction
- 1.1. Research Scope
- 1.2. Market Segmentation
- 1.3. Research Methodology
- 1.4. Definitions and Assumptions
- 2. Executive Summary
- 2.1. Introduction
- 3. Market Dynamics
- 3.1. Introduction
- 3.2. Market Drivers
- 3.2.1. Shifts in Consumer Preferences and Lifestyle Changes Drives the Market's Growth; Demand for Time Saving Solutions Drives the Market's Growth
- 3.3. Market Restrains
- 3.3.1. Supply Chain Disruptions; High Cost of Maintenance4.3.2.1; Market Oppurtunities4.; Technological Advancements in Major Home Appliances
- 3.4. Market Trends
- 3.4.1. Increased Adoption of Multi and Advanced Products Driving the Market for Major Home Appliances
- 4. Market Factor Analysis
- 4.1. Porters Five Forces
- 4.2. Supply/Value Chain
- 4.3. PESTEL analysis
- 4.4. Market Entropy
- 4.5. Patent/Trademark Analysis
- 5. Global US Home Appliance Industry Analysis, Insights and Forecast, 2019-2031
- 5.1. Market Analysis, Insights and Forecast - by Product
- 5.1.1. Refrigerators
- 5.1.2. Freezers
- 5.1.3. Air-conditioners
- 5.1.4. Dishwashers
- 5.1.5. Washing Machines
- 5.1.6. Ovens
- 5.2. Market Analysis, Insights and Forecast - by Distribution Channel
- 5.2.1. Multi-Branded Stores
- 5.2.2. Exclusive Brand Outlets
- 5.2.3. Online
- 5.3. Market Analysis, Insights and Forecast - by Region
- 5.3.1. North America
- 5.3.2. South America
- 5.3.3. Europe
- 5.3.4. Middle East & Africa
- 5.3.5. Asia Pacific
- 5.1. Market Analysis, Insights and Forecast - by Product
- 6. North America US Home Appliance Industry Analysis, Insights and Forecast, 2019-2031
- 6.1. Market Analysis, Insights and Forecast - by Product
- 6.1.1. Refrigerators
- 6.1.2. Freezers
- 6.1.3. Air-conditioners
- 6.1.4. Dishwashers
- 6.1.5. Washing Machines
- 6.1.6. Ovens
- 6.2. Market Analysis, Insights and Forecast - by Distribution Channel
- 6.2.1. Multi-Branded Stores
- 6.2.2. Exclusive Brand Outlets
- 6.2.3. Online
- 6.1. Market Analysis, Insights and Forecast - by Product
- 7. South America US Home Appliance Industry Analysis, Insights and Forecast, 2019-2031
- 7.1. Market Analysis, Insights and Forecast - by Product
- 7.1.1. Refrigerators
- 7.1.2. Freezers
- 7.1.3. Air-conditioners
- 7.1.4. Dishwashers
- 7.1.5. Washing Machines
- 7.1.6. Ovens
- 7.2. Market Analysis, Insights and Forecast - by Distribution Channel
- 7.2.1. Multi-Branded Stores
- 7.2.2. Exclusive Brand Outlets
- 7.2.3. Online
- 7.1. Market Analysis, Insights and Forecast - by Product
- 8. Europe US Home Appliance Industry Analysis, Insights and Forecast, 2019-2031
- 8.1. Market Analysis, Insights and Forecast - by Product
- 8.1.1. Refrigerators
- 8.1.2. Freezers
- 8.1.3. Air-conditioners
- 8.1.4. Dishwashers
- 8.1.5. Washing Machines
- 8.1.6. Ovens
- 8.2. Market Analysis, Insights and Forecast - by Distribution Channel
- 8.2.1. Multi-Branded Stores
- 8.2.2. Exclusive Brand Outlets
- 8.2.3. Online
- 8.1. Market Analysis, Insights and Forecast - by Product
- 9. Middle East & Africa US Home Appliance Industry Analysis, Insights and Forecast, 2019-2031
- 9.1. Market Analysis, Insights and Forecast - by Product
- 9.1.1. Refrigerators
- 9.1.2. Freezers
- 9.1.3. Air-conditioners
- 9.1.4. Dishwashers
- 9.1.5. Washing Machines
- 9.1.6. Ovens
- 9.2. Market Analysis, Insights and Forecast - by Distribution Channel
- 9.2.1. Multi-Branded Stores
- 9.2.2. Exclusive Brand Outlets
- 9.2.3. Online
- 9.1. Market Analysis, Insights and Forecast - by Product
- 10. Asia Pacific US Home Appliance Industry Analysis, Insights and Forecast, 2019-2031
- 10.1. Market Analysis, Insights and Forecast - by Product
- 10.1.1. Refrigerators
- 10.1.2. Freezers
- 10.1.3. Air-conditioners
- 10.1.4. Dishwashers
- 10.1.5. Washing Machines
- 10.1.6. Ovens
- 10.2. Market Analysis, Insights and Forecast - by Distribution Channel
- 10.2.1. Multi-Branded Stores
- 10.2.2. Exclusive Brand Outlets
- 10.2.3. Online
- 10.1. Market Analysis, Insights and Forecast - by Product
- 11. Northeast US Home Appliance Industry Analysis, Insights and Forecast, 2019-2031
- 12. Southeast US Home Appliance Industry Analysis, Insights and Forecast, 2019-2031
- 13. Midwest US Home Appliance Industry Analysis, Insights and Forecast, 2019-2031
- 14. Southwest US Home Appliance Industry Analysis, Insights and Forecast, 2019-2031
- 15. West US Home Appliance Industry Analysis, Insights and Forecast, 2019-2031
- 16. Competitive Analysis
- 16.1. Global Market Share Analysis 2024
- 16.2. Company Profiles
- 16.2.1 Whirlpool Corporation
- 16.2.1.1. Overview
- 16.2.1.2. Products
- 16.2.1.3. SWOT Analysis
- 16.2.1.4. Recent Developments
- 16.2.1.5. Financials (Based on Availability)
- 16.2.2 Samsung Electronics
- 16.2.2.1. Overview
- 16.2.2.2. Products
- 16.2.2.3. SWOT Analysis
- 16.2.2.4. Recent Developments
- 16.2.2.5. Financials (Based on Availability)
- 16.2.3 Gorenje Group
- 16.2.3.1. Overview
- 16.2.3.2. Products
- 16.2.3.3. SWOT Analysis
- 16.2.3.4. Recent Developments
- 16.2.3.5. Financials (Based on Availability)
- 16.2.4 Midea Group
- 16.2.4.1. Overview
- 16.2.4.2. Products
- 16.2.4.3. SWOT Analysis
- 16.2.4.4. Recent Developments
- 16.2.4.5. Financials (Based on Availability)
- 16.2.5 Haier Group
- 16.2.5.1. Overview
- 16.2.5.2. Products
- 16.2.5.3. SWOT Analysis
- 16.2.5.4. Recent Developments
- 16.2.5.5. Financials (Based on Availability)
- 16.2.6 Bosch
- 16.2.6.1. Overview
- 16.2.6.2. Products
- 16.2.6.3. SWOT Analysis
- 16.2.6.4. Recent Developments
- 16.2.6.5. Financials (Based on Availability)
- 16.2.7 Arcelik AS**List Not Exhaustive
- 16.2.7.1. Overview
- 16.2.7.2. Products
- 16.2.7.3. SWOT Analysis
- 16.2.7.4. Recent Developments
- 16.2.7.5. Financials (Based on Availability)
- 16.2.8 Electrolux AB
- 16.2.8.1. Overview
- 16.2.8.2. Products
- 16.2.8.3. SWOT Analysis
- 16.2.8.4. Recent Developments
- 16.2.8.5. Financials (Based on Availability)
- 16.2.9 Panasonic Corporation
- 16.2.9.1. Overview
- 16.2.9.2. Products
- 16.2.9.3. SWOT Analysis
- 16.2.9.4. Recent Developments
- 16.2.9.5. Financials (Based on Availability)
- 16.2.10 LG Electronics
- 16.2.10.1. Overview
- 16.2.10.2. Products
- 16.2.10.3. SWOT Analysis
- 16.2.10.4. Recent Developments
- 16.2.10.5. Financials (Based on Availability)
- 16.2.1 Whirlpool Corporation
List of Figures
- Figure 1: Global US Home Appliance Industry Revenue Breakdown (Million, %) by Region 2024 & 2032
- Figure 2: United states US Home Appliance Industry Revenue (Million), by Country 2024 & 2032
- Figure 3: United states US Home Appliance Industry Revenue Share (%), by Country 2024 & 2032
- Figure 4: North America US Home Appliance Industry Revenue (Million), by Product 2024 & 2032
- Figure 5: North America US Home Appliance Industry Revenue Share (%), by Product 2024 & 2032
- Figure 6: North America US Home Appliance Industry Revenue (Million), by Distribution Channel 2024 & 2032
- Figure 7: North America US Home Appliance Industry Revenue Share (%), by Distribution Channel 2024 & 2032
- Figure 8: North America US Home Appliance Industry Revenue (Million), by Country 2024 & 2032
- Figure 9: North America US Home Appliance Industry Revenue Share (%), by Country 2024 & 2032
- Figure 10: South America US Home Appliance Industry Revenue (Million), by Product 2024 & 2032
- Figure 11: South America US Home Appliance Industry Revenue Share (%), by Product 2024 & 2032
- Figure 12: South America US Home Appliance Industry Revenue (Million), by Distribution Channel 2024 & 2032
- Figure 13: South America US Home Appliance Industry Revenue Share (%), by Distribution Channel 2024 & 2032
- Figure 14: South America US Home Appliance Industry Revenue (Million), by Country 2024 & 2032
- Figure 15: South America US Home Appliance Industry Revenue Share (%), by Country 2024 & 2032
- Figure 16: Europe US Home Appliance Industry Revenue (Million), by Product 2024 & 2032
- Figure 17: Europe US Home Appliance Industry Revenue Share (%), by Product 2024 & 2032
- Figure 18: Europe US Home Appliance Industry Revenue (Million), by Distribution Channel 2024 & 2032
- Figure 19: Europe US Home Appliance Industry Revenue Share (%), by Distribution Channel 2024 & 2032
- Figure 20: Europe US Home Appliance Industry Revenue (Million), by Country 2024 & 2032
- Figure 21: Europe US Home Appliance Industry Revenue Share (%), by Country 2024 & 2032
- Figure 22: Middle East & Africa US Home Appliance Industry Revenue (Million), by Product 2024 & 2032
- Figure 23: Middle East & Africa US Home Appliance Industry Revenue Share (%), by Product 2024 & 2032
- Figure 24: Middle East & Africa US Home Appliance Industry Revenue (Million), by Distribution Channel 2024 & 2032
- Figure 25: Middle East & Africa US Home Appliance Industry Revenue Share (%), by Distribution Channel 2024 & 2032
- Figure 26: Middle East & Africa US Home Appliance Industry Revenue (Million), by Country 2024 & 2032
- Figure 27: Middle East & Africa US Home Appliance Industry Revenue Share (%), by Country 2024 & 2032
- Figure 28: Asia Pacific US Home Appliance Industry Revenue (Million), by Product 2024 & 2032
- Figure 29: Asia Pacific US Home Appliance Industry Revenue Share (%), by Product 2024 & 2032
- Figure 30: Asia Pacific US Home Appliance Industry Revenue (Million), by Distribution Channel 2024 & 2032
- Figure 31: Asia Pacific US Home Appliance Industry Revenue Share (%), by Distribution Channel 2024 & 2032
- Figure 32: Asia Pacific US Home Appliance Industry Revenue (Million), by Country 2024 & 2032
- Figure 33: Asia Pacific US Home Appliance Industry Revenue Share (%), by Country 2024 & 2032
List of Tables
- Table 1: Global US Home Appliance Industry Revenue Million Forecast, by Region 2019 & 2032
- Table 2: Global US Home Appliance Industry Revenue Million Forecast, by Product 2019 & 2032
- Table 3: Global US Home Appliance Industry Revenue Million Forecast, by Distribution Channel 2019 & 2032
- Table 4: Global US Home Appliance Industry Revenue Million Forecast, by Region 2019 & 2032
- Table 5: Global US Home Appliance Industry Revenue Million Forecast, by Country 2019 & 2032
- Table 6: Northeast US Home Appliance Industry Revenue (Million) Forecast, by Application 2019 & 2032
- Table 7: Southeast US Home Appliance Industry Revenue (Million) Forecast, by Application 2019 & 2032
- Table 8: Midwest US Home Appliance Industry Revenue (Million) Forecast, by Application 2019 & 2032
- Table 9: Southwest US Home Appliance Industry Revenue (Million) Forecast, by Application 2019 & 2032
- Table 10: West US Home Appliance Industry Revenue (Million) Forecast, by Application 2019 & 2032
- Table 11: Global US Home Appliance Industry Revenue Million Forecast, by Product 2019 & 2032
- Table 12: Global US Home Appliance Industry Revenue Million Forecast, by Distribution Channel 2019 & 2032
- Table 13: Global US Home Appliance Industry Revenue Million Forecast, by Country 2019 & 2032
- Table 14: United States US Home Appliance Industry Revenue (Million) Forecast, by Application 2019 & 2032
- Table 15: Canada US Home Appliance Industry Revenue (Million) Forecast, by Application 2019 & 2032
- Table 16: Mexico US Home Appliance Industry Revenue (Million) Forecast, by Application 2019 & 2032
- Table 17: Global US Home Appliance Industry Revenue Million Forecast, by Product 2019 & 2032
- Table 18: Global US Home Appliance Industry Revenue Million Forecast, by Distribution Channel 2019 & 2032
- Table 19: Global US Home Appliance Industry Revenue Million Forecast, by Country 2019 & 2032
- Table 20: Brazil US Home Appliance Industry Revenue (Million) Forecast, by Application 2019 & 2032
- Table 21: Argentina US Home Appliance Industry Revenue (Million) Forecast, by Application 2019 & 2032
- Table 22: Rest of South America US Home Appliance Industry Revenue (Million) Forecast, by Application 2019 & 2032
- Table 23: Global US Home Appliance Industry Revenue Million Forecast, by Product 2019 & 2032
- Table 24: Global US Home Appliance Industry Revenue Million Forecast, by Distribution Channel 2019 & 2032
- Table 25: Global US Home Appliance Industry Revenue Million Forecast, by Country 2019 & 2032
- Table 26: United Kingdom US Home Appliance Industry Revenue (Million) Forecast, by Application 2019 & 2032
- Table 27: Germany US Home Appliance Industry Revenue (Million) Forecast, by Application 2019 & 2032
- Table 28: France US Home Appliance Industry Revenue (Million) Forecast, by Application 2019 & 2032
- Table 29: Italy US Home Appliance Industry Revenue (Million) Forecast, by Application 2019 & 2032
- Table 30: Spain US Home Appliance Industry Revenue (Million) Forecast, by Application 2019 & 2032
- Table 31: Russia US Home Appliance Industry Revenue (Million) Forecast, by Application 2019 & 2032
- Table 32: Benelux US Home Appliance Industry Revenue (Million) Forecast, by Application 2019 & 2032
- Table 33: Nordics US Home Appliance Industry Revenue (Million) Forecast, by Application 2019 & 2032
- Table 34: Rest of Europe US Home Appliance Industry Revenue (Million) Forecast, by Application 2019 & 2032
- Table 35: Global US Home Appliance Industry Revenue Million Forecast, by Product 2019 & 2032
- Table 36: Global US Home Appliance Industry Revenue Million Forecast, by Distribution Channel 2019 & 2032
- Table 37: Global US Home Appliance Industry Revenue Million Forecast, by Country 2019 & 2032
- Table 38: Turkey US Home Appliance Industry Revenue (Million) Forecast, by Application 2019 & 2032
- Table 39: Israel US Home Appliance Industry Revenue (Million) Forecast, by Application 2019 & 2032
- Table 40: GCC US Home Appliance Industry Revenue (Million) Forecast, by Application 2019 & 2032
- Table 41: North Africa US Home Appliance Industry Revenue (Million) Forecast, by Application 2019 & 2032
- Table 42: South Africa US Home Appliance Industry Revenue (Million) Forecast, by Application 2019 & 2032
- Table 43: Rest of Middle East & Africa US Home Appliance Industry Revenue (Million) Forecast, by Application 2019 & 2032
- Table 44: Global US Home Appliance Industry Revenue Million Forecast, by Product 2019 & 2032
- Table 45: Global US Home Appliance Industry Revenue Million Forecast, by Distribution Channel 2019 & 2032
- Table 46: Global US Home Appliance Industry Revenue Million Forecast, by Country 2019 & 2032
- Table 47: China US Home Appliance Industry Revenue (Million) Forecast, by Application 2019 & 2032
- Table 48: India US Home Appliance Industry Revenue (Million) Forecast, by Application 2019 & 2032
- Table 49: Japan US Home Appliance Industry Revenue (Million) Forecast, by Application 2019 & 2032
- Table 50: South Korea US Home Appliance Industry Revenue (Million) Forecast, by Application 2019 & 2032
- Table 51: ASEAN US Home Appliance Industry Revenue (Million) Forecast, by Application 2019 & 2032
- Table 52: Oceania US Home Appliance Industry Revenue (Million) Forecast, by Application 2019 & 2032
- Table 53: Rest of Asia Pacific US Home Appliance Industry Revenue (Million) Forecast, by Application 2019 & 2032
Frequently Asked Questions
1. What is the projected Compound Annual Growth Rate (CAGR) of the US Home Appliance Industry?
The projected CAGR is approximately 2.93%.
2. Which companies are prominent players in the US Home Appliance Industry?
Key companies in the market include Whirlpool Corporation, Samsung Electronics, Gorenje Group, Midea Group, Haier Group, Bosch, Arcelik AS**List Not Exhaustive, Electrolux AB, Panasonic Corporation, LG Electronics.
3. What are the main segments of the US Home Appliance Industry?
The market segments include Product, Distribution Channel.
4. Can you provide details about the market size?
The market size is estimated to be USD 33.44 Million as of 2022.
5. What are some drivers contributing to market growth?
Shifts in Consumer Preferences and Lifestyle Changes Drives the Market's Growth; Demand for Time Saving Solutions Drives the Market's Growth.
6. What are the notable trends driving market growth?
Increased Adoption of Multi and Advanced Products Driving the Market for Major Home Appliances.
7. Are there any restraints impacting market growth?
Supply Chain Disruptions; High Cost of Maintenance4.3.2.1; Market Oppurtunities4.; Technological Advancements in Major Home Appliances.
8. Can you provide examples of recent developments in the market?
April 2023: Haier launched an innovative super drum washing machine with intelligent voice control, and the excellent drum ensures effective washing performance.
9. What pricing options are available for accessing the report?
Pricing options include single-user, multi-user, and enterprise licenses priced at USD 3800, USD 4500, and USD 5800 respectively.
10. Is the market size provided in terms of value or volume?
The market size is provided in terms of value, measured in Million.
11. Are there any specific market keywords associated with the report?
Yes, the market keyword associated with the report is "US Home Appliance Industry," which aids in identifying and referencing the specific market segment covered.
12. How do I determine which pricing option suits my needs best?
The pricing options vary based on user requirements and access needs. Individual users may opt for single-user licenses, while businesses requiring broader access may choose multi-user or enterprise licenses for cost-effective access to the report.
13. Are there any additional resources or data provided in the US Home Appliance Industry report?
While the report offers comprehensive insights, it's advisable to review the specific contents or supplementary materials provided to ascertain if additional resources or data are available.
14. How can I stay updated on further developments or reports in the US Home Appliance Industry?
To stay informed about further developments, trends, and reports in the US Home Appliance Industry, consider subscribing to industry newsletters, following relevant companies and organizations, or regularly checking reputable industry news sources and publications.
Methodology
Step 1 - Identification of Relevant Samples Size from Population Database


Step 2 - Approaches for Defining Global Market Size (Value, Volume* & Price*)

Note*: In applicable scenarios
Step 3 - Data Sources
Primary Research
- Web Analytics
- Survey Reports
- Research Institute
- Latest Research Reports
- Opinion Leaders
Secondary Research
- Annual Reports
- White Paper
- Latest Press Release
- Industry Association
- Paid Database
- Investor Presentations

Step 4 - Data Triangulation
Involves using different sources of information in order to increase the validity of a study
These sources are likely to be stakeholders in a program - participants, other researchers, program staff, other community members, and so on.
Then we put all data in single framework & apply various statistical tools to find out the dynamic on the market.
During the analysis stage, feedback from the stakeholder groups would be compared to determine areas of agreement as well as areas of divergence


