Key Insights
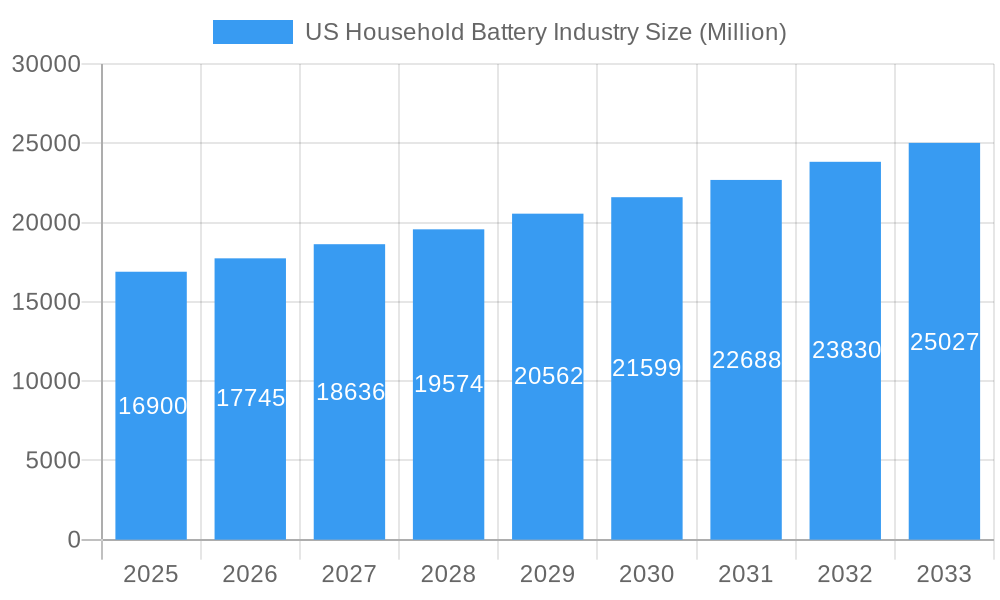
The U.S. household battery market, projected to reach $16.04 billion by 2025, is forecast to grow at a Compound Annual Growth Rate (CAGR) of 10.3% through 2033. This significant expansion is driven by increasing demand for portable electronics, the indirect influence of the electric vehicle sector, and a growing consumer preference for sustainable, rechargeable battery solutions over single-use options. Key challenges include raw material price volatility, particularly for lithium and critical minerals. The market is segmented by battery type, with lithium-ion dominating due to superior energy density and lifespan. Retail remains the primary distribution channel, though online sales are rapidly increasing. Major competitors such as Exide Technologies, Duracell, and Panasonic are focused on technological innovation, performance enhancement, and environmental sustainability. Demand is relatively evenly distributed across U.S. regions.
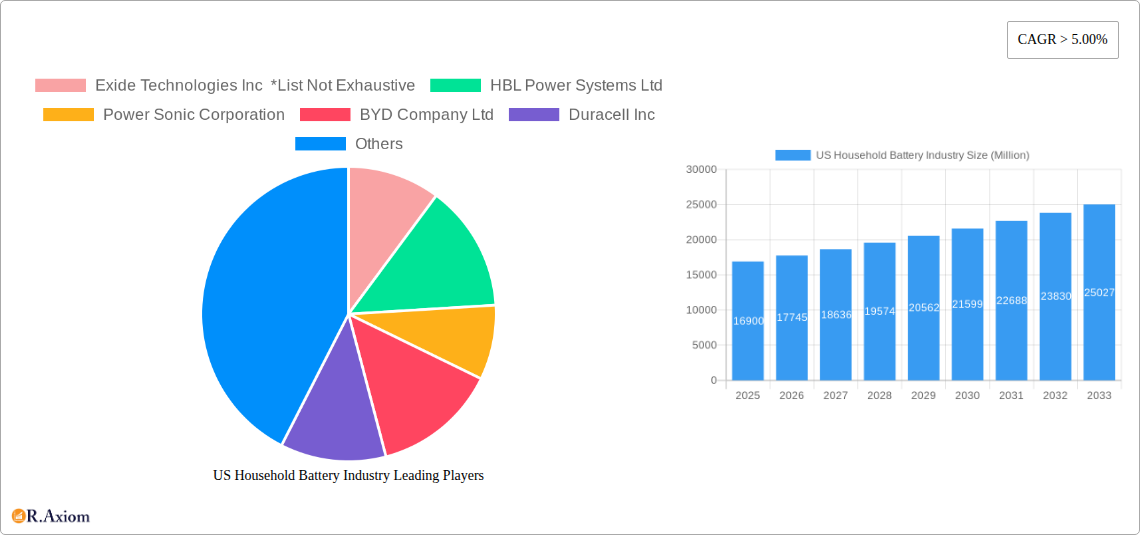
US Household Battery Industry Market Size (In Billion)
The forecast period (2025-2033) anticipates sustained growth propelled by technological advancements that will deliver higher capacity, extended lifespan, and more eco-friendly batteries. Enhanced consumer consciousness regarding sustainable choices will further boost rechargeable battery adoption. Potential regulatory shifts in battery disposal and recycling, coupled with persistent supply chain complexities, will influence market dynamics. Mergers, acquisitions, product innovation, and strategic marketing by both established and emerging players will continue to shape the competitive landscape. The market's future growth depends on balancing rising consumer demand, environmental responsibility, and supply chain resilience.
US Household Battery Industry Company Market Share
US Household Battery Industry Market Report: 2019-2033
This comprehensive report provides a detailed analysis of the US household battery industry, encompassing market size, segmentation, growth drivers, challenges, and future outlook. The study period covers 2019-2033, with 2025 as the base and estimated year. The report offers actionable insights for industry stakeholders, investors, and businesses operating within this dynamic sector.
US Household Battery Industry Market Concentration & Innovation
This section analyzes the competitive landscape of the US household battery market, examining market concentration, innovation drivers, regulatory influences, and market dynamics. The report will delve into the market share held by key players such as Exide Technologies Inc, HBL Power Systems Ltd, Power Sonic Corporation, BYD Company Ltd, Duracell Inc, Zeus Battery Products, Energizer Holdings Inc, Panasonic Corporation, Rayovac (Spectrum Brands, Inc.), Sony Corporation, and Maxell Holdings, Ltd. The analysis will quantify market share for each company where data is available, otherwise the xx value will be used for market share. Furthermore, the report will investigate recent mergers and acquisitions (M&A) activities within the industry, assessing their impact on market consolidation and technological advancements. The analysis will include an assessment of deal values where data is available, otherwise xx value will be used. The influence of regulatory frameworks on innovation and competition will be thoroughly examined, along with an evaluation of the impact of substitute products and evolving end-user trends. The section will conclude by highlighting key innovation drivers and their potential to disrupt the market.
US Household Battery Industry Industry Trends & Insights
This section provides a deep dive into the key trends shaping the US household battery market. It will analyze the market growth drivers, including the rising demand for portable electronics, the expansion of the electric vehicle (EV) market, and the increasing adoption of energy storage solutions in residential settings. The report will also explore technological disruptions, such as advancements in battery chemistry and energy density, and assess their impact on market dynamics. Consumer preferences, such as a growing preference for eco-friendly and high-performance batteries, will be examined, along with their influence on product development and marketing strategies. The competitive dynamics within the market will be analyzed, including pricing strategies, product differentiation, and branding efforts. Key metrics such as Compound Annual Growth Rate (CAGR) and market penetration for different battery types will be provided, forecasting market size at xx Million for 2025 and projected to xx Million by 2033.
Dominant Markets & Segments in US Household Battery Industry
This section identifies the dominant segments within the US household battery market, analyzing key drivers and competitive landscapes for each.
- Product Type:
- Lead-Acid Batteries: Market dominance analysis will include factors such as cost-effectiveness, established infrastructure, and continued usage in specific applications. Growth projections and market sizes will be included for the forecast period.
- Lithium-Ion Batteries: Analysis will focus on factors driving growth, including superior performance characteristics and increasing demand from portable electronics and automotive applications. Market size, projections, and competitive dynamics will be explored.
- Other Battery Types: This section will explore niche battery types and their growth potential. Market size will be estimated at xx Million for the base year, projected to xx Million by 2033.
- Application:
- Portable Electronics: Dominance will be analyzed considering factors such as consumer electronics demand and innovation. Market size will be xx Million, projected to grow to xx Million by 2033.
- Automotive: Growth drivers such as the rising popularity of hybrid and electric vehicles will be examined. The projected market size is xx Million in 2025 and is expected to grow to xx Million by 2033.
- Industrial Applications: This section will consider the role of industrial applications and their projected growth. Market size for the base year is estimated at xx Million, projected to xx Million in 2033.
- Distribution Channel:
- Retail: Analysis will assess retail channel dominance, including brick-and-mortar stores and online retailers. Market size in 2025 is projected to be xx Million, growing to xx Million by 2033.
- Wholesale: This section will examine the role of wholesalers and their contribution to market size. The estimated 2025 market size is xx Million, projected to xx Million by 2033.
- Online: Growth analysis of online sales channels considering factors like e-commerce expansion and convenience. The market size for 2025 is estimated at xx Million and is projected to grow to xx Million in 2033.
US Household Battery Industry Product Developments
The US household battery market witnesses continuous product innovation. Advancements in battery chemistry, such as improved lithium-ion technologies and the exploration of solid-state batteries, are driving performance enhancements and extended lifespans. Miniaturization trends are shaping the design of batteries for portable electronics, while increased energy density is crucial for electric vehicles and energy storage systems. These developments directly influence competitive advantages, with companies investing heavily in research and development to offer superior products and cater to specific market needs.
Report Scope & Segmentation Analysis
This report segments the US household battery market by product type (Lead-Acid, Lithium-ion, Others), application (Portable Electronics, Automotive, Industrial), and distribution channel (Retail, Wholesale, Online). Each segment’s growth projections, market size (in Millions), and competitive dynamics are analyzed, providing a comprehensive overview of the market landscape. For each segment, market size data for 2025 and projected market size for 2033 will be provided. Competitive dynamics within each segment, including key players and market share, will also be analyzed.
Key Drivers of US Household Battery Industry Growth
Several factors fuel the growth of the US household battery industry. Technological advancements, particularly in lithium-ion battery technology, enhance energy density and lifespan. Economic growth and rising disposable incomes drive demand for electronic devices and electric vehicles. Government regulations and incentives promoting renewable energy and electric mobility stimulate the adoption of batteries in various applications. For instance, the Inflation Reduction Act of 2022 provides significant financial incentives for domestic battery manufacturing, boosting industry growth.
Challenges in the US Household Battery Industry Sector
The US household battery industry faces challenges, including volatile raw material prices impacting production costs. Supply chain disruptions and geopolitical instability can hinder the availability of essential materials. Intense competition among established players and new entrants puts pressure on pricing and profitability. Environmental concerns related to battery disposal and recycling necessitate sustainable solutions. The regulatory landscape, including safety standards and environmental regulations, adds complexity to operations.
Emerging Opportunities in US Household Battery Industry
Several opportunities exist for growth. The increasing adoption of electric vehicles presents a significant market opportunity. Advancements in battery technology, such as solid-state batteries, offer potential for improved performance and safety. The growing demand for energy storage solutions in residential settings creates opportunities for home battery systems. The expansion of the renewable energy sector further boosts demand for energy storage batteries.
Leading Players in the US Household Battery Industry Market
- Exide Technologies Inc
- HBL Power Systems Ltd
- Power Sonic Corporation
- BYD Company Ltd
- Duracell Inc
- Zeus Battery Products
- Energizer Holdings Inc
- Panasonic Corporation
- Rayovac (Spectrum Brands, Inc.)
- Sony Corporation
- Maxell Holdings, Ltd.
Key Developments in US Household Battery Industry Industry
- August 2022: President Biden signed the Inflation Reduction Act, allocating over USD 60 billion to American clean energy manufacturing, including USD 30 billion in production tax credits for batteries. This significantly boosts domestic battery production and market growth.
- December 2022: The US Department of Energy approved a USD 2.5 billion loan to Ultium Cells LLC for building new lithium-ion battery cell manufacturing facilities in Ohio, Tennessee, and Michigan. This investment accelerates the expansion of domestic battery manufacturing capacity.
Strategic Outlook for US Household Battery Industry Market
The US household battery market is poised for substantial growth driven by technological advancements, increasing demand for electric vehicles, and supportive government policies. The Inflation Reduction Act and other initiatives create a favorable environment for domestic manufacturing and innovation. Emerging battery technologies, such as solid-state batteries, promise further performance improvements and market expansion. Companies with strong R&D capabilities, sustainable supply chains, and strategic partnerships will be best positioned to capitalize on this growth.
US Household Battery Industry Segmentation
- 1. Alkaline Batteries
- 2. Lead-acid Batteries
- 3. Lithium-ion Batteries
- 4. Other Types
US Household Battery Industry Segmentation By Geography
-
1. North America
- 1.1. United States
- 1.2. Canada
- 1.3. Mexico
-
2. South America
- 2.1. Brazil
- 2.2. Argentina
- 2.3. Rest of South America
-
3. Europe
- 3.1. United Kingdom
- 3.2. Germany
- 3.3. France
- 3.4. Italy
- 3.5. Spain
- 3.6. Russia
- 3.7. Benelux
- 3.8. Nordics
- 3.9. Rest of Europe
-
4. Middle East & Africa
- 4.1. Turkey
- 4.2. Israel
- 4.3. GCC
- 4.4. North Africa
- 4.5. South Africa
- 4.6. Rest of Middle East & Africa
-
5. Asia Pacific
- 5.1. China
- 5.2. India
- 5.3. Japan
- 5.4. South Korea
- 5.5. ASEAN
- 5.6. Oceania
- 5.7. Rest of Asia Pacific
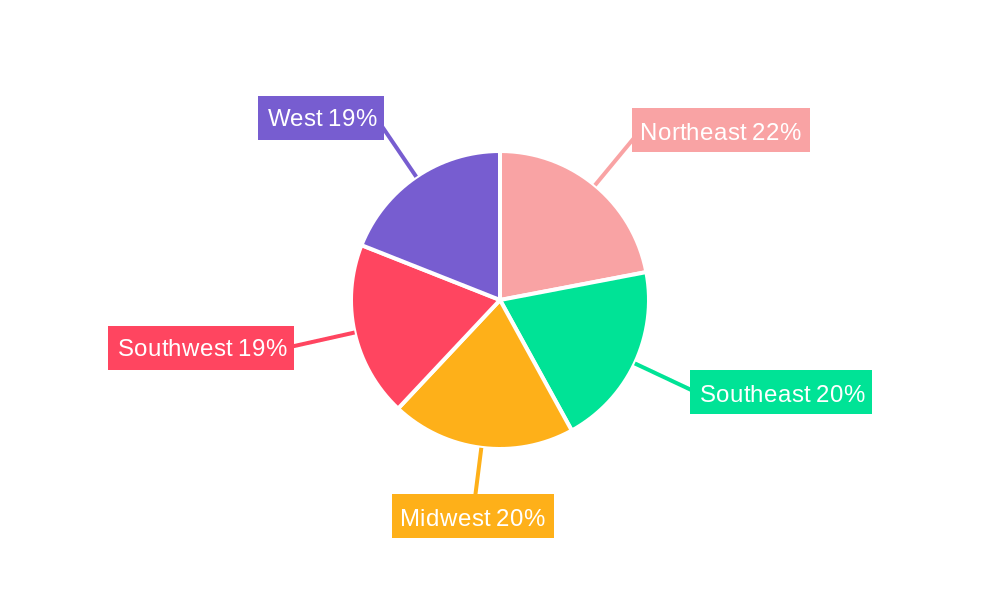
US Household Battery Industry Regional Market Share
Geographic Coverage of US Household Battery Industry
US Household Battery Industry REPORT HIGHLIGHTS
| Aspects | Details |
|---|---|
| Study Period | 2020-2034 |
| Base Year | 2025 |
| Estimated Year | 2026 |
| Forecast Period | 2026-2034 |
| Historical Period | 2020-2025 |
| Growth Rate | CAGR of 10.3% from 2020-2034 |
| Segmentation |
|
Table of Contents
- 1. Introduction
- 1.1. Research Scope
- 1.2. Market Segmentation
- 1.3. Research Objective
- 1.4. Definitions and Assumptions
- 2. Executive Summary
- 2.1. Market Snapshot
- 3. Market Dynamics
- 3.1. Market Drivers
- 3.2. Market Restrains
- 3.3. Market Trends
- 3.4. Market Opportunities
- 4. Market Factor Analysis
- 4.1. Porters Five Forces
- 4.1.1. Bargaining Power of Suppliers
- 4.1.2. Bargaining Power of Buyers
- 4.1.3. Threat of New Entrants
- 4.1.4. Threat of Substitutes
- 4.1.5. Competitive Rivalry
- 4.2. PESTEL analysis
- 4.3. BCG Analysis
- 4.3.1. Stars (High Growth, High Market Share)
- 4.3.2. Cash Cows (Low Growth, High Market Share)
- 4.3.3. Question Mark (High Growth, Low Market Share)
- 4.3.4. Dogs (Low Growth, Low Market Share)
- 4.4. Ansoff Matrix Analysis
- 4.5. Supply Chain Analysis
- 4.6. Regulatory Landscape
- 4.7. Current Market Potential and Opportunity Assessment (TAM–SAM–SOM Framework)
- 4.8. RAX Analyst Note
- 4.1. Porters Five Forces
- 5. Market Analysis, Insights and Forecast 2021-2033
- 5.1. Market Analysis, Insights and Forecast - by Alkaline Batteries
- 5.2. Market Analysis, Insights and Forecast - by Lead-acid Batteries
- 5.3. Market Analysis, Insights and Forecast - by Lithium-ion Batteries
- 5.4. Market Analysis, Insights and Forecast - by Other Types
- 5.5. Market Analysis, Insights and Forecast - by Region
- 5.5.1. North America
- 5.5.2. South America
- 5.5.3. Europe
- 5.5.4. Middle East & Africa
- 5.5.5. Asia Pacific
- 6. Global US Household Battery Industry Analysis, Insights and Forecast, 2021-2033
- 6.1. Market Analysis, Insights and Forecast - by Alkaline Batteries
- 6.2. Market Analysis, Insights and Forecast - by Lead-acid Batteries
- 6.3. Market Analysis, Insights and Forecast - by Lithium-ion Batteries
- 6.4. Market Analysis, Insights and Forecast - by Other Types
- 7. North America US Household Battery Industry Analysis, Insights and Forecast, 2020-2032
- 7.1. Market Analysis, Insights and Forecast - by Alkaline Batteries
- 7.2. Market Analysis, Insights and Forecast - by Lead-acid Batteries
- 7.3. Market Analysis, Insights and Forecast - by Lithium-ion Batteries
- 7.4. Market Analysis, Insights and Forecast - by Other Types
- 8. South America US Household Battery Industry Analysis, Insights and Forecast, 2020-2032
- 8.1. Market Analysis, Insights and Forecast - by Alkaline Batteries
- 8.2. Market Analysis, Insights and Forecast - by Lead-acid Batteries
- 8.3. Market Analysis, Insights and Forecast - by Lithium-ion Batteries
- 8.4. Market Analysis, Insights and Forecast - by Other Types
- 9. Europe US Household Battery Industry Analysis, Insights and Forecast, 2020-2032
- 9.1. Market Analysis, Insights and Forecast - by Alkaline Batteries
- 9.2. Market Analysis, Insights and Forecast - by Lead-acid Batteries
- 9.3. Market Analysis, Insights and Forecast - by Lithium-ion Batteries
- 9.4. Market Analysis, Insights and Forecast - by Other Types
- 10. Middle East & Africa US Household Battery Industry Analysis, Insights and Forecast, 2020-2032
- 10.1. Market Analysis, Insights and Forecast - by Alkaline Batteries
- 10.2. Market Analysis, Insights and Forecast - by Lead-acid Batteries
- 10.3. Market Analysis, Insights and Forecast - by Lithium-ion Batteries
- 10.4. Market Analysis, Insights and Forecast - by Other Types
- 11. Asia Pacific US Household Battery Industry Analysis, Insights and Forecast, 2020-2032
- 11.1. Market Analysis, Insights and Forecast - by Alkaline Batteries
- 11.2. Market Analysis, Insights and Forecast - by Lead-acid Batteries
- 11.3. Market Analysis, Insights and Forecast - by Lithium-ion Batteries
- 11.4. Market Analysis, Insights and Forecast - by Other Types
- 12. Competitive Analysis
- 12.1. Company Profiles
- 12.1.1 Exide Technologies Inc *List Not Exhaustive
- 12.1.1.1. Company Overview
- 12.1.1.2. Products
- 12.1.1.3. Company Financials
- 12.1.1.4. SWOT Analysis
- 12.1.2 HBL Power Systems Ltd
- 12.1.2.1. Company Overview
- 12.1.2.2. Products
- 12.1.2.3. Company Financials
- 12.1.2.4. SWOT Analysis
- 12.1.3 Power Sonic Corporation
- 12.1.3.1. Company Overview
- 12.1.3.2. Products
- 12.1.3.3. Company Financials
- 12.1.3.4. SWOT Analysis
- 12.1.4 BYD Company Ltd
- 12.1.4.1. Company Overview
- 12.1.4.2. Products
- 12.1.4.3. Company Financials
- 12.1.4.4. SWOT Analysis
- 12.1.5 Duracell Inc
- 12.1.5.1. Company Overview
- 12.1.5.2. Products
- 12.1.5.3. Company Financials
- 12.1.5.4. SWOT Analysis
- 12.1.6 Zeus Battery Products
- 12.1.6.1. Company Overview
- 12.1.6.2. Products
- 12.1.6.3. Company Financials
- 12.1.6.4. SWOT Analysis
- 12.1.7 Energizer Holdings Inc
- 12.1.7.1. Company Overview
- 12.1.7.2. Products
- 12.1.7.3. Company Financials
- 12.1.7.4. SWOT Analysis
- 12.1.8 Panasonic Corporation
- 12.1.8.1. Company Overview
- 12.1.8.2. Products
- 12.1.8.3. Company Financials
- 12.1.8.4. SWOT Analysis
- 12.1.9 Rayovac (Spectrum Brands Inc.)
- 12.1.9.1. Company Overview
- 12.1.9.2. Products
- 12.1.9.3. Company Financials
- 12.1.9.4. SWOT Analysis
- 12.1.10 Sony Corporation
- 12.1.10.1. Company Overview
- 12.1.10.2. Products
- 12.1.10.3. Company Financials
- 12.1.10.4. SWOT Analysis
- 12.1.11 Maxell Holdings Ltd.
- 12.1.11.1. Company Overview
- 12.1.11.2. Products
- 12.1.11.3. Company Financials
- 12.1.11.4. SWOT Analysis
- 12.1.1 Exide Technologies Inc *List Not Exhaustive
- 12.2. Market Entropy
- 12.2.1 Company's Key Areas Served
- 12.2.2 Recent Developments
- 12.3. Company Market Share Analysis 2025
- 12.3.1 Top 5 Companies Market Share Analysis
- 12.3.2 Top 3 Companies Market Share Analysis
- 12.4. List of Potential Customers
- 13. Research Methodology
List of Figures
- Figure 1: Global US Household Battery Industry Revenue Breakdown (billion, %) by Region 2025 & 2033
- Figure 2: Global US Household Battery Industry Volume Breakdown (K Tons, %) by Region 2025 & 2033
- Figure 3: North America US Household Battery Industry Revenue (billion), by Alkaline Batteries 2025 & 2033
- Figure 4: North America US Household Battery Industry Volume (K Tons), by Alkaline Batteries 2025 & 2033
- Figure 5: North America US Household Battery Industry Revenue Share (%), by Alkaline Batteries 2025 & 2033
- Figure 6: North America US Household Battery Industry Volume Share (%), by Alkaline Batteries 2025 & 2033
- Figure 7: North America US Household Battery Industry Revenue (billion), by Lead-acid Batteries 2025 & 2033
- Figure 8: North America US Household Battery Industry Volume (K Tons), by Lead-acid Batteries 2025 & 2033
- Figure 9: North America US Household Battery Industry Revenue Share (%), by Lead-acid Batteries 2025 & 2033
- Figure 10: North America US Household Battery Industry Volume Share (%), by Lead-acid Batteries 2025 & 2033
- Figure 11: North America US Household Battery Industry Revenue (billion), by Lithium-ion Batteries 2025 & 2033
- Figure 12: North America US Household Battery Industry Volume (K Tons), by Lithium-ion Batteries 2025 & 2033
- Figure 13: North America US Household Battery Industry Revenue Share (%), by Lithium-ion Batteries 2025 & 2033
- Figure 14: North America US Household Battery Industry Volume Share (%), by Lithium-ion Batteries 2025 & 2033
- Figure 15: North America US Household Battery Industry Revenue (billion), by Other Types 2025 & 2033
- Figure 16: North America US Household Battery Industry Volume (K Tons), by Other Types 2025 & 2033
- Figure 17: North America US Household Battery Industry Revenue Share (%), by Other Types 2025 & 2033
- Figure 18: North America US Household Battery Industry Volume Share (%), by Other Types 2025 & 2033
- Figure 19: North America US Household Battery Industry Revenue (billion), by Country 2025 & 2033
- Figure 20: North America US Household Battery Industry Volume (K Tons), by Country 2025 & 2033
- Figure 21: North America US Household Battery Industry Revenue Share (%), by Country 2025 & 2033
- Figure 22: North America US Household Battery Industry Volume Share (%), by Country 2025 & 2033
- Figure 23: South America US Household Battery Industry Revenue (billion), by Alkaline Batteries 2025 & 2033
- Figure 24: South America US Household Battery Industry Volume (K Tons), by Alkaline Batteries 2025 & 2033
- Figure 25: South America US Household Battery Industry Revenue Share (%), by Alkaline Batteries 2025 & 2033
- Figure 26: South America US Household Battery Industry Volume Share (%), by Alkaline Batteries 2025 & 2033
- Figure 27: South America US Household Battery Industry Revenue (billion), by Lead-acid Batteries 2025 & 2033
- Figure 28: South America US Household Battery Industry Volume (K Tons), by Lead-acid Batteries 2025 & 2033
- Figure 29: South America US Household Battery Industry Revenue Share (%), by Lead-acid Batteries 2025 & 2033
- Figure 30: South America US Household Battery Industry Volume Share (%), by Lead-acid Batteries 2025 & 2033
- Figure 31: South America US Household Battery Industry Revenue (billion), by Lithium-ion Batteries 2025 & 2033
- Figure 32: South America US Household Battery Industry Volume (K Tons), by Lithium-ion Batteries 2025 & 2033
- Figure 33: South America US Household Battery Industry Revenue Share (%), by Lithium-ion Batteries 2025 & 2033
- Figure 34: South America US Household Battery Industry Volume Share (%), by Lithium-ion Batteries 2025 & 2033
- Figure 35: South America US Household Battery Industry Revenue (billion), by Other Types 2025 & 2033
- Figure 36: South America US Household Battery Industry Volume (K Tons), by Other Types 2025 & 2033
- Figure 37: South America US Household Battery Industry Revenue Share (%), by Other Types 2025 & 2033
- Figure 38: South America US Household Battery Industry Volume Share (%), by Other Types 2025 & 2033
- Figure 39: South America US Household Battery Industry Revenue (billion), by Country 2025 & 2033
- Figure 40: South America US Household Battery Industry Volume (K Tons), by Country 2025 & 2033
- Figure 41: South America US Household Battery Industry Revenue Share (%), by Country 2025 & 2033
- Figure 42: South America US Household Battery Industry Volume Share (%), by Country 2025 & 2033
- Figure 43: Europe US Household Battery Industry Revenue (billion), by Alkaline Batteries 2025 & 2033
- Figure 44: Europe US Household Battery Industry Volume (K Tons), by Alkaline Batteries 2025 & 2033
- Figure 45: Europe US Household Battery Industry Revenue Share (%), by Alkaline Batteries 2025 & 2033
- Figure 46: Europe US Household Battery Industry Volume Share (%), by Alkaline Batteries 2025 & 2033
- Figure 47: Europe US Household Battery Industry Revenue (billion), by Lead-acid Batteries 2025 & 2033
- Figure 48: Europe US Household Battery Industry Volume (K Tons), by Lead-acid Batteries 2025 & 2033
- Figure 49: Europe US Household Battery Industry Revenue Share (%), by Lead-acid Batteries 2025 & 2033
- Figure 50: Europe US Household Battery Industry Volume Share (%), by Lead-acid Batteries 2025 & 2033
- Figure 51: Europe US Household Battery Industry Revenue (billion), by Lithium-ion Batteries 2025 & 2033
- Figure 52: Europe US Household Battery Industry Volume (K Tons), by Lithium-ion Batteries 2025 & 2033
- Figure 53: Europe US Household Battery Industry Revenue Share (%), by Lithium-ion Batteries 2025 & 2033
- Figure 54: Europe US Household Battery Industry Volume Share (%), by Lithium-ion Batteries 2025 & 2033
- Figure 55: Europe US Household Battery Industry Revenue (billion), by Other Types 2025 & 2033
- Figure 56: Europe US Household Battery Industry Volume (K Tons), by Other Types 2025 & 2033
- Figure 57: Europe US Household Battery Industry Revenue Share (%), by Other Types 2025 & 2033
- Figure 58: Europe US Household Battery Industry Volume Share (%), by Other Types 2025 & 2033
- Figure 59: Europe US Household Battery Industry Revenue (billion), by Country 2025 & 2033
- Figure 60: Europe US Household Battery Industry Volume (K Tons), by Country 2025 & 2033
- Figure 61: Europe US Household Battery Industry Revenue Share (%), by Country 2025 & 2033
- Figure 62: Europe US Household Battery Industry Volume Share (%), by Country 2025 & 2033
- Figure 63: Middle East & Africa US Household Battery Industry Revenue (billion), by Alkaline Batteries 2025 & 2033
- Figure 64: Middle East & Africa US Household Battery Industry Volume (K Tons), by Alkaline Batteries 2025 & 2033
- Figure 65: Middle East & Africa US Household Battery Industry Revenue Share (%), by Alkaline Batteries 2025 & 2033
- Figure 66: Middle East & Africa US Household Battery Industry Volume Share (%), by Alkaline Batteries 2025 & 2033
- Figure 67: Middle East & Africa US Household Battery Industry Revenue (billion), by Lead-acid Batteries 2025 & 2033
- Figure 68: Middle East & Africa US Household Battery Industry Volume (K Tons), by Lead-acid Batteries 2025 & 2033
- Figure 69: Middle East & Africa US Household Battery Industry Revenue Share (%), by Lead-acid Batteries 2025 & 2033
- Figure 70: Middle East & Africa US Household Battery Industry Volume Share (%), by Lead-acid Batteries 2025 & 2033
- Figure 71: Middle East & Africa US Household Battery Industry Revenue (billion), by Lithium-ion Batteries 2025 & 2033
- Figure 72: Middle East & Africa US Household Battery Industry Volume (K Tons), by Lithium-ion Batteries 2025 & 2033
- Figure 73: Middle East & Africa US Household Battery Industry Revenue Share (%), by Lithium-ion Batteries 2025 & 2033
- Figure 74: Middle East & Africa US Household Battery Industry Volume Share (%), by Lithium-ion Batteries 2025 & 2033
- Figure 75: Middle East & Africa US Household Battery Industry Revenue (billion), by Other Types 2025 & 2033
- Figure 76: Middle East & Africa US Household Battery Industry Volume (K Tons), by Other Types 2025 & 2033
- Figure 77: Middle East & Africa US Household Battery Industry Revenue Share (%), by Other Types 2025 & 2033
- Figure 78: Middle East & Africa US Household Battery Industry Volume Share (%), by Other Types 2025 & 2033
- Figure 79: Middle East & Africa US Household Battery Industry Revenue (billion), by Country 2025 & 2033
- Figure 80: Middle East & Africa US Household Battery Industry Volume (K Tons), by Country 2025 & 2033
- Figure 81: Middle East & Africa US Household Battery Industry Revenue Share (%), by Country 2025 & 2033
- Figure 82: Middle East & Africa US Household Battery Industry Volume Share (%), by Country 2025 & 2033
- Figure 83: Asia Pacific US Household Battery Industry Revenue (billion), by Alkaline Batteries 2025 & 2033
- Figure 84: Asia Pacific US Household Battery Industry Volume (K Tons), by Alkaline Batteries 2025 & 2033
- Figure 85: Asia Pacific US Household Battery Industry Revenue Share (%), by Alkaline Batteries 2025 & 2033
- Figure 86: Asia Pacific US Household Battery Industry Volume Share (%), by Alkaline Batteries 2025 & 2033
- Figure 87: Asia Pacific US Household Battery Industry Revenue (billion), by Lead-acid Batteries 2025 & 2033
- Figure 88: Asia Pacific US Household Battery Industry Volume (K Tons), by Lead-acid Batteries 2025 & 2033
- Figure 89: Asia Pacific US Household Battery Industry Revenue Share (%), by Lead-acid Batteries 2025 & 2033
- Figure 90: Asia Pacific US Household Battery Industry Volume Share (%), by Lead-acid Batteries 2025 & 2033
- Figure 91: Asia Pacific US Household Battery Industry Revenue (billion), by Lithium-ion Batteries 2025 & 2033
- Figure 92: Asia Pacific US Household Battery Industry Volume (K Tons), by Lithium-ion Batteries 2025 & 2033
- Figure 93: Asia Pacific US Household Battery Industry Revenue Share (%), by Lithium-ion Batteries 2025 & 2033
- Figure 94: Asia Pacific US Household Battery Industry Volume Share (%), by Lithium-ion Batteries 2025 & 2033
- Figure 95: Asia Pacific US Household Battery Industry Revenue (billion), by Other Types 2025 & 2033
- Figure 96: Asia Pacific US Household Battery Industry Volume (K Tons), by Other Types 2025 & 2033
- Figure 97: Asia Pacific US Household Battery Industry Revenue Share (%), by Other Types 2025 & 2033
- Figure 98: Asia Pacific US Household Battery Industry Volume Share (%), by Other Types 2025 & 2033
- Figure 99: Asia Pacific US Household Battery Industry Revenue (billion), by Country 2025 & 2033
- Figure 100: Asia Pacific US Household Battery Industry Volume (K Tons), by Country 2025 & 2033
- Figure 101: Asia Pacific US Household Battery Industry Revenue Share (%), by Country 2025 & 2033
- Figure 102: Asia Pacific US Household Battery Industry Volume Share (%), by Country 2025 & 2033
List of Tables
- Table 1: Global US Household Battery Industry Revenue billion Forecast, by Alkaline Batteries 2020 & 2033
- Table 2: Global US Household Battery Industry Volume K Tons Forecast, by Alkaline Batteries 2020 & 2033
- Table 3: Global US Household Battery Industry Revenue billion Forecast, by Lead-acid Batteries 2020 & 2033
- Table 4: Global US Household Battery Industry Volume K Tons Forecast, by Lead-acid Batteries 2020 & 2033
- Table 5: Global US Household Battery Industry Revenue billion Forecast, by Lithium-ion Batteries 2020 & 2033
- Table 6: Global US Household Battery Industry Volume K Tons Forecast, by Lithium-ion Batteries 2020 & 2033
- Table 7: Global US Household Battery Industry Revenue billion Forecast, by Other Types 2020 & 2033
- Table 8: Global US Household Battery Industry Volume K Tons Forecast, by Other Types 2020 & 2033
- Table 9: Global US Household Battery Industry Revenue billion Forecast, by Region 2020 & 2033
- Table 10: Global US Household Battery Industry Volume K Tons Forecast, by Region 2020 & 2033
- Table 11: Global US Household Battery Industry Revenue billion Forecast, by Alkaline Batteries 2020 & 2033
- Table 12: Global US Household Battery Industry Volume K Tons Forecast, by Alkaline Batteries 2020 & 2033
- Table 13: Global US Household Battery Industry Revenue billion Forecast, by Lead-acid Batteries 2020 & 2033
- Table 14: Global US Household Battery Industry Volume K Tons Forecast, by Lead-acid Batteries 2020 & 2033
- Table 15: Global US Household Battery Industry Revenue billion Forecast, by Lithium-ion Batteries 2020 & 2033
- Table 16: Global US Household Battery Industry Volume K Tons Forecast, by Lithium-ion Batteries 2020 & 2033
- Table 17: Global US Household Battery Industry Revenue billion Forecast, by Other Types 2020 & 2033
- Table 18: Global US Household Battery Industry Volume K Tons Forecast, by Other Types 2020 & 2033
- Table 19: Global US Household Battery Industry Revenue billion Forecast, by Country 2020 & 2033
- Table 20: Global US Household Battery Industry Volume K Tons Forecast, by Country 2020 & 2033
- Table 21: United States US Household Battery Industry Revenue (billion) Forecast, by Application 2020 & 2033
- Table 22: United States US Household Battery Industry Volume (K Tons) Forecast, by Application 2020 & 2033
- Table 23: Canada US Household Battery Industry Revenue (billion) Forecast, by Application 2020 & 2033
- Table 24: Canada US Household Battery Industry Volume (K Tons) Forecast, by Application 2020 & 2033
- Table 25: Mexico US Household Battery Industry Revenue (billion) Forecast, by Application 2020 & 2033
- Table 26: Mexico US Household Battery Industry Volume (K Tons) Forecast, by Application 2020 & 2033
- Table 27: Global US Household Battery Industry Revenue billion Forecast, by Alkaline Batteries 2020 & 2033
- Table 28: Global US Household Battery Industry Volume K Tons Forecast, by Alkaline Batteries 2020 & 2033
- Table 29: Global US Household Battery Industry Revenue billion Forecast, by Lead-acid Batteries 2020 & 2033
- Table 30: Global US Household Battery Industry Volume K Tons Forecast, by Lead-acid Batteries 2020 & 2033
- Table 31: Global US Household Battery Industry Revenue billion Forecast, by Lithium-ion Batteries 2020 & 2033
- Table 32: Global US Household Battery Industry Volume K Tons Forecast, by Lithium-ion Batteries 2020 & 2033
- Table 33: Global US Household Battery Industry Revenue billion Forecast, by Other Types 2020 & 2033
- Table 34: Global US Household Battery Industry Volume K Tons Forecast, by Other Types 2020 & 2033
- Table 35: Global US Household Battery Industry Revenue billion Forecast, by Country 2020 & 2033
- Table 36: Global US Household Battery Industry Volume K Tons Forecast, by Country 2020 & 2033
- Table 37: Brazil US Household Battery Industry Revenue (billion) Forecast, by Application 2020 & 2033
- Table 38: Brazil US Household Battery Industry Volume (K Tons) Forecast, by Application 2020 & 2033
- Table 39: Argentina US Household Battery Industry Revenue (billion) Forecast, by Application 2020 & 2033
- Table 40: Argentina US Household Battery Industry Volume (K Tons) Forecast, by Application 2020 & 2033
- Table 41: Rest of South America US Household Battery Industry Revenue (billion) Forecast, by Application 2020 & 2033
- Table 42: Rest of South America US Household Battery Industry Volume (K Tons) Forecast, by Application 2020 & 2033
- Table 43: Global US Household Battery Industry Revenue billion Forecast, by Alkaline Batteries 2020 & 2033
- Table 44: Global US Household Battery Industry Volume K Tons Forecast, by Alkaline Batteries 2020 & 2033
- Table 45: Global US Household Battery Industry Revenue billion Forecast, by Lead-acid Batteries 2020 & 2033
- Table 46: Global US Household Battery Industry Volume K Tons Forecast, by Lead-acid Batteries 2020 & 2033
- Table 47: Global US Household Battery Industry Revenue billion Forecast, by Lithium-ion Batteries 2020 & 2033
- Table 48: Global US Household Battery Industry Volume K Tons Forecast, by Lithium-ion Batteries 2020 & 2033
- Table 49: Global US Household Battery Industry Revenue billion Forecast, by Other Types 2020 & 2033
- Table 50: Global US Household Battery Industry Volume K Tons Forecast, by Other Types 2020 & 2033
- Table 51: Global US Household Battery Industry Revenue billion Forecast, by Country 2020 & 2033
- Table 52: Global US Household Battery Industry Volume K Tons Forecast, by Country 2020 & 2033
- Table 53: United Kingdom US Household Battery Industry Revenue (billion) Forecast, by Application 2020 & 2033
- Table 54: United Kingdom US Household Battery Industry Volume (K Tons) Forecast, by Application 2020 & 2033
- Table 55: Germany US Household Battery Industry Revenue (billion) Forecast, by Application 2020 & 2033
- Table 56: Germany US Household Battery Industry Volume (K Tons) Forecast, by Application 2020 & 2033
- Table 57: France US Household Battery Industry Revenue (billion) Forecast, by Application 2020 & 2033
- Table 58: France US Household Battery Industry Volume (K Tons) Forecast, by Application 2020 & 2033
- Table 59: Italy US Household Battery Industry Revenue (billion) Forecast, by Application 2020 & 2033
- Table 60: Italy US Household Battery Industry Volume (K Tons) Forecast, by Application 2020 & 2033
- Table 61: Spain US Household Battery Industry Revenue (billion) Forecast, by Application 2020 & 2033
- Table 62: Spain US Household Battery Industry Volume (K Tons) Forecast, by Application 2020 & 2033
- Table 63: Russia US Household Battery Industry Revenue (billion) Forecast, by Application 2020 & 2033
- Table 64: Russia US Household Battery Industry Volume (K Tons) Forecast, by Application 2020 & 2033
- Table 65: Benelux US Household Battery Industry Revenue (billion) Forecast, by Application 2020 & 2033
- Table 66: Benelux US Household Battery Industry Volume (K Tons) Forecast, by Application 2020 & 2033
- Table 67: Nordics US Household Battery Industry Revenue (billion) Forecast, by Application 2020 & 2033
- Table 68: Nordics US Household Battery Industry Volume (K Tons) Forecast, by Application 2020 & 2033
- Table 69: Rest of Europe US Household Battery Industry Revenue (billion) Forecast, by Application 2020 & 2033
- Table 70: Rest of Europe US Household Battery Industry Volume (K Tons) Forecast, by Application 2020 & 2033
- Table 71: Global US Household Battery Industry Revenue billion Forecast, by Alkaline Batteries 2020 & 2033
- Table 72: Global US Household Battery Industry Volume K Tons Forecast, by Alkaline Batteries 2020 & 2033
- Table 73: Global US Household Battery Industry Revenue billion Forecast, by Lead-acid Batteries 2020 & 2033
- Table 74: Global US Household Battery Industry Volume K Tons Forecast, by Lead-acid Batteries 2020 & 2033
- Table 75: Global US Household Battery Industry Revenue billion Forecast, by Lithium-ion Batteries 2020 & 2033
- Table 76: Global US Household Battery Industry Volume K Tons Forecast, by Lithium-ion Batteries 2020 & 2033
- Table 77: Global US Household Battery Industry Revenue billion Forecast, by Other Types 2020 & 2033
- Table 78: Global US Household Battery Industry Volume K Tons Forecast, by Other Types 2020 & 2033
- Table 79: Global US Household Battery Industry Revenue billion Forecast, by Country 2020 & 2033
- Table 80: Global US Household Battery Industry Volume K Tons Forecast, by Country 2020 & 2033
- Table 81: Turkey US Household Battery Industry Revenue (billion) Forecast, by Application 2020 & 2033
- Table 82: Turkey US Household Battery Industry Volume (K Tons) Forecast, by Application 2020 & 2033
- Table 83: Israel US Household Battery Industry Revenue (billion) Forecast, by Application 2020 & 2033
- Table 84: Israel US Household Battery Industry Volume (K Tons) Forecast, by Application 2020 & 2033
- Table 85: GCC US Household Battery Industry Revenue (billion) Forecast, by Application 2020 & 2033
- Table 86: GCC US Household Battery Industry Volume (K Tons) Forecast, by Application 2020 & 2033
- Table 87: North Africa US Household Battery Industry Revenue (billion) Forecast, by Application 2020 & 2033
- Table 88: North Africa US Household Battery Industry Volume (K Tons) Forecast, by Application 2020 & 2033
- Table 89: South Africa US Household Battery Industry Revenue (billion) Forecast, by Application 2020 & 2033
- Table 90: South Africa US Household Battery Industry Volume (K Tons) Forecast, by Application 2020 & 2033
- Table 91: Rest of Middle East & Africa US Household Battery Industry Revenue (billion) Forecast, by Application 2020 & 2033
- Table 92: Rest of Middle East & Africa US Household Battery Industry Volume (K Tons) Forecast, by Application 2020 & 2033
- Table 93: Global US Household Battery Industry Revenue billion Forecast, by Alkaline Batteries 2020 & 2033
- Table 94: Global US Household Battery Industry Volume K Tons Forecast, by Alkaline Batteries 2020 & 2033
- Table 95: Global US Household Battery Industry Revenue billion Forecast, by Lead-acid Batteries 2020 & 2033
- Table 96: Global US Household Battery Industry Volume K Tons Forecast, by Lead-acid Batteries 2020 & 2033
- Table 97: Global US Household Battery Industry Revenue billion Forecast, by Lithium-ion Batteries 2020 & 2033
- Table 98: Global US Household Battery Industry Volume K Tons Forecast, by Lithium-ion Batteries 2020 & 2033
- Table 99: Global US Household Battery Industry Revenue billion Forecast, by Other Types 2020 & 2033
- Table 100: Global US Household Battery Industry Volume K Tons Forecast, by Other Types 2020 & 2033
- Table 101: Global US Household Battery Industry Revenue billion Forecast, by Country 2020 & 2033
- Table 102: Global US Household Battery Industry Volume K Tons Forecast, by Country 2020 & 2033
- Table 103: China US Household Battery Industry Revenue (billion) Forecast, by Application 2020 & 2033
- Table 104: China US Household Battery Industry Volume (K Tons) Forecast, by Application 2020 & 2033
- Table 105: India US Household Battery Industry Revenue (billion) Forecast, by Application 2020 & 2033
- Table 106: India US Household Battery Industry Volume (K Tons) Forecast, by Application 2020 & 2033
- Table 107: Japan US Household Battery Industry Revenue (billion) Forecast, by Application 2020 & 2033
- Table 108: Japan US Household Battery Industry Volume (K Tons) Forecast, by Application 2020 & 2033
- Table 109: South Korea US Household Battery Industry Revenue (billion) Forecast, by Application 2020 & 2033
- Table 110: South Korea US Household Battery Industry Volume (K Tons) Forecast, by Application 2020 & 2033
- Table 111: ASEAN US Household Battery Industry Revenue (billion) Forecast, by Application 2020 & 2033
- Table 112: ASEAN US Household Battery Industry Volume (K Tons) Forecast, by Application 2020 & 2033
- Table 113: Oceania US Household Battery Industry Revenue (billion) Forecast, by Application 2020 & 2033
- Table 114: Oceania US Household Battery Industry Volume (K Tons) Forecast, by Application 2020 & 2033
- Table 115: Rest of Asia Pacific US Household Battery Industry Revenue (billion) Forecast, by Application 2020 & 2033
- Table 116: Rest of Asia Pacific US Household Battery Industry Volume (K Tons) Forecast, by Application 2020 & 2033
Frequently Asked Questions
1. What is the projected Compound Annual Growth Rate (CAGR) of the US Household Battery Industry?
The projected CAGR is approximately 10.3%.
2. Which companies are prominent players in the US Household Battery Industry?
Key companies in the market include Exide Technologies Inc *List Not Exhaustive, HBL Power Systems Ltd, Power Sonic Corporation, BYD Company Ltd, Duracell Inc, Zeus Battery Products, Energizer Holdings Inc, Panasonic Corporation, Rayovac (Spectrum Brands, Inc.) , Sony Corporation, Maxell Holdings, Ltd..
3. What are the main segments of the US Household Battery Industry?
The market segments include Alkaline Batteries, Lead-acid Batteries, Lithium-ion Batteries, Other Types.
4. Can you provide details about the market size?
The market size is estimated to be USD 16.04 billion as of 2022.
5. What are some drivers contributing to market growth?
4.; Increasing Investments in Water Treatment by Developing Countries4.; Growing Demand for the Various End-Use Sectors.
6. What are the notable trends driving market growth?
Lithium-Ion Battery to Dominate the Market.
7. Are there any restraints impacting market growth?
4.; Availability of Cheap and Alternative Pumps.
8. Can you provide examples of recent developments in the market?
December 2022: The US Department of Energy (DOE) announced the conclusion of a USD 2.5 billion loan to Ultium Cells LLC to assist in financing the building of new lithium-ion battery cell manufacturing facilities in Ohio, Tennessee, and Michigan through its Loan Programs Office (LPO). The three facilities will be managed by Ultium Cells, a joint venture between General Motors and LG Energy Solution.
9. What pricing options are available for accessing the report?
Pricing options include single-user, multi-user, and enterprise licenses priced at USD 3800, USD 4500, and USD 5800 respectively.
10. Is the market size provided in terms of value or volume?
The market size is provided in terms of value, measured in billion and volume, measured in K Tons.
11. Are there any specific market keywords associated with the report?
Yes, the market keyword associated with the report is "US Household Battery Industry," which aids in identifying and referencing the specific market segment covered.
12. How do I determine which pricing option suits my needs best?
The pricing options vary based on user requirements and access needs. Individual users may opt for single-user licenses, while businesses requiring broader access may choose multi-user or enterprise licenses for cost-effective access to the report.
13. Are there any additional resources or data provided in the US Household Battery Industry report?
While the report offers comprehensive insights, it's advisable to review the specific contents or supplementary materials provided to ascertain if additional resources or data are available.
14. How can I stay updated on further developments or reports in the US Household Battery Industry?
To stay informed about further developments, trends, and reports in the US Household Battery Industry, consider subscribing to industry newsletters, following relevant companies and organizations, or regularly checking reputable industry news sources and publications.
Methodology
Step 1 - Identification of Relevant Samples Size from Population Database


Step 2 - Approaches for Defining Global Market Size (Value, Volume* & Price*)

Note*: In applicable scenarios
Step 3 - Data Sources
Primary Research
- Web Analytics
- Survey Reports
- Research Institute
- Latest Research Reports
- Opinion Leaders
Secondary Research
- Annual Reports
- White Paper
- Latest Press Release
- Industry Association
- Paid Database
- Investor Presentations

Step 4 - Data Triangulation
Involves using different sources of information in order to increase the validity of a study
These sources are likely to be stakeholders in a program - participants, other researchers, program staff, other community members, and so on.
Then we put all data in single framework & apply various statistical tools to find out the dynamic on the market.
During the analysis stage, feedback from the stakeholder groups would be compared to determine areas of agreement as well as areas of divergence

