US Liquid Nematicide Market 2025-2033 Overview: Trends, Dynamics, and Growth Opportunities

US Liquid Nematicide Market by Production Analysis, by Consumption Analysis, by Import Market Analysis (Value & Volume), by Export Market Analysis (Value & Volume), by Price Trend Analysis, by North America (United States, Canada, Mexico), by South America (Brazil, Argentina, Rest of South America), by Europe (United Kingdom, Germany, France, Italy, Spain, Russia, Benelux, Nordics, Rest of Europe), by Middle East & Africa (Turkey, Israel, GCC, North Africa, South Africa, Rest of Middle East & Africa), by Asia Pacific (China, India, Japan, South Korea, ASEAN, Oceania, Rest of Asia Pacific) Forecast 2025-2033

Jun 29 2025
Base Year: 2024

197 Pages
Main Logo

US Liquid Nematicide Market 2025-2033 Overview: Trends, Dynamics, and Growth Opportunities


Home
Industries
Agriculture
sponsor image

Tailored for you

  • In-depth Analysis Tailored to Specified Regions or Segments
  • Company Profiles Customized to User Preferences
  • Comprehensive Insights Focused on Specific Segments or Regions
  • Customized Evaluation of Competitive Landscape to Meet Your Needs
  • Tailored Customization to Address Other Specific Requirements
Ask for customization


Key Insights

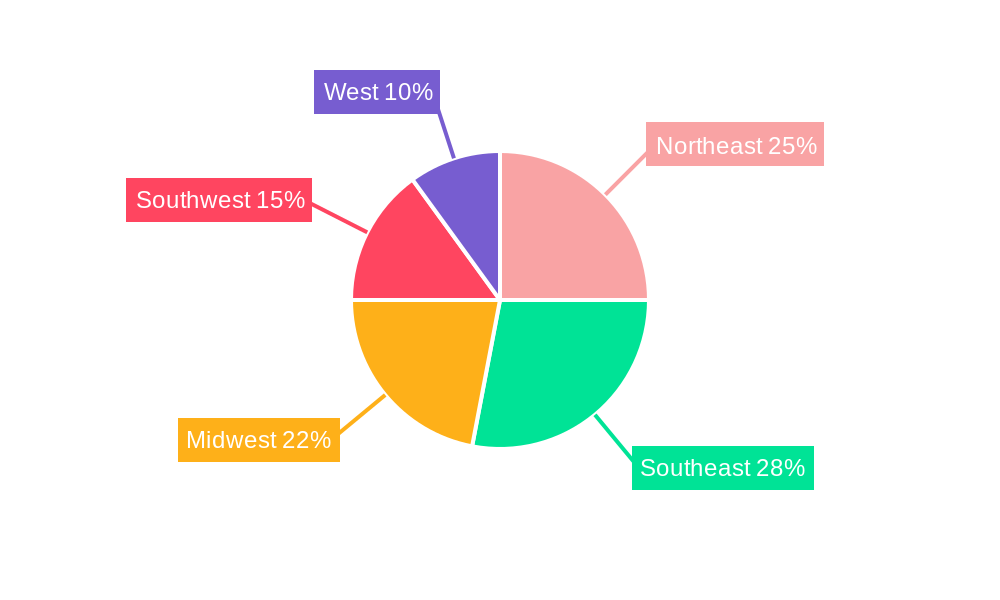
The US liquid nematicide market is experiencing steady growth, driven by increasing demand for high-yield crops and the persistent threat of nematode infestations impacting agricultural productivity. The market's expansion is fueled by several factors, including the rising adoption of advanced farming techniques, growing awareness of nematode-related crop losses, and the increasing availability of effective and relatively safer nematicide formulations. The liquid formulation enjoys preference due to its ease of application and compatibility with existing irrigation systems. Within the segment, organophosphate and carbamate nematicides continue to hold significant market share, albeit facing growing scrutiny due to environmental concerns. This is leading to increased interest in bio-based nematicides, which offer a more sustainable alternative while catering to the growing demand for environmentally friendly agricultural practices. The commercial crops segment, encompassing high-value fruits and vegetables, is a major contributor to market revenue, followed by grains and cereals. Key players in the US market, including Syngenta, Bayer CropScience, and BASF, are actively engaged in research and development to introduce innovative, higher-efficacy, and environmentally sound nematicide solutions. The Northeast, Midwest, and Southeast regions represent significant market segments due to their extensive agricultural lands and diverse crop production.

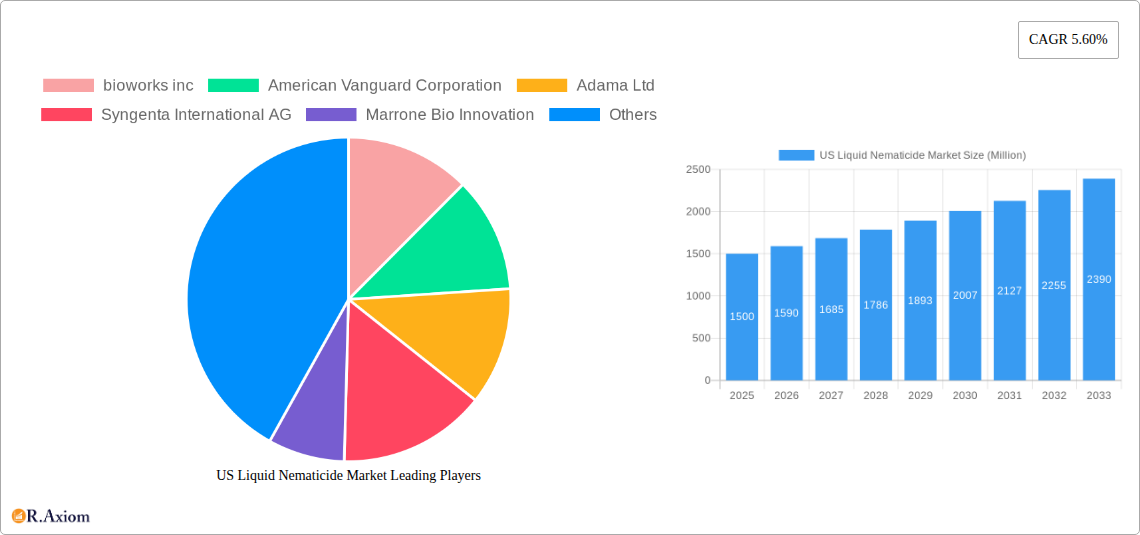
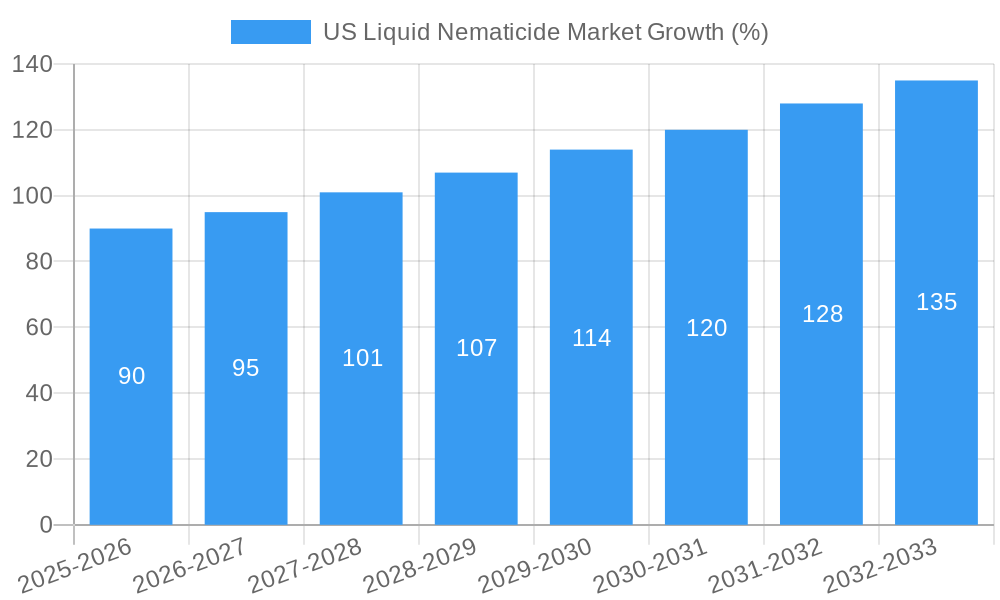
Despite positive growth trajectories, the market faces challenges. Regulatory hurdles related to the use of certain chemical nematicides, coupled with rising production costs and the potential impact of climate change on pest prevalence, act as constraints. However, ongoing innovations in nematicide technology, coupled with supportive government policies promoting sustainable agriculture and pest management practices, are expected to mitigate these challenges. The forecast period (2025-2033) anticipates consistent market growth, primarily driven by the increasing adoption of bio-based nematicides and a growing focus on integrated pest management strategies across various agricultural sectors in the United States. The projected CAGR of 5.60% indicates a promising outlook for the US liquid nematicide market, with significant potential for further expansion.

US Liquid Nematicide Market: A Comprehensive Report (2019-2033)

This comprehensive report provides an in-depth analysis of the US liquid nematicide market, encompassing market size, segmentation, growth drivers, challenges, and key players. The study period spans from 2019 to 2033, with 2025 serving as the base and estimated year. The forecast period is 2025-2033, and the historical period covers 2019-2024. This report is essential for stakeholders seeking actionable insights and strategic guidance within this dynamic sector.

US Liquid Nematicide Market Research Report - Market Size, Growth & Forecast

US Liquid Nematicide Market Concentration & Innovation

The US liquid nematicide market exhibits a moderately concentrated structure, with a few major players holding significant market share. In 2025, the top five companies—Syngenta International AG, Bayer CropScience AG, BASF SE, Corteva Agriscience, and Adama Ltd—are estimated to collectively account for approximately 65% of the market. However, the market is witnessing increased competition from smaller, specialized companies focused on bio-based nematicides. Innovation is driven by the need for more effective, sustainable, and environmentally friendly solutions.

  • Market Share (2025 Estimate): Syngenta (20%), Bayer (18%), BASF (15%), Corteva (8%), Adama (4%). Others (35%)
  • M&A Activity: The past five years have witnessed a moderate level of M&A activity, with deal values ranging from $xx Million to $xx Million. These transactions primarily focused on strengthening product portfolios and expanding geographical reach. Consolidation is expected to continue as larger companies seek to enhance their market position.
  • Regulatory Framework: The Environmental Protection Agency (EPA) plays a crucial role in regulating nematicides, impacting innovation and market access. Stringent regulations necessitate significant investment in research and development to comply with environmental standards.
  • Product Substitutes: The market faces competition from alternative pest management strategies, including biological control methods and crop rotation. The increasing awareness of the environmental impact of chemical nematicides is driving demand for eco-friendly alternatives.
  • End-User Trends: The growing demand for higher-yielding crops and the increasing prevalence of nematode infestations are key drivers of market growth. Farmers are increasingly adopting integrated pest management (IPM) strategies, incorporating nematicides as part of a broader approach.

US Liquid Nematicide Market Industry Trends & Insights

The US liquid nematicide market is projected to witness a Compound Annual Growth Rate (CAGR) of xx% during the forecast period (2025-2033). This growth is driven by several factors. The rising prevalence of nematode infestations in various crops due to changing climatic conditions and intensive agriculture is a primary driver. Furthermore, increasing consumer demand for high-quality, disease-free produce is driving adoption of nematicides by farmers.

Technological advancements in nematicide formulations, such as the development of more targeted and effective bio-based nematicides, are also contributing to market expansion. However, consumer concerns about the environmental impact of chemical nematicides and stricter regulatory requirements pose challenges to the market's growth. The market penetration of bio-based nematicides is steadily increasing, albeit from a relatively small base, representing a significant opportunity for future growth. The competitive landscape is characterized by both intense rivalry among established players and the emergence of new entrants offering innovative solutions. This dynamic environment fosters innovation but also creates challenges for maintaining market share. The market is witnessing a gradual shift towards sustainable and environmentally friendly practices, impacting the demand for traditional chemical nematicides.

US Liquid Nematicide Market Growth

Dominant Markets & Segments in US Liquid Nematicide Market

The liquid nematicide market is dominated by the Fruits & Vegetables application type, followed by Commercial Crops. The high value of these crops and the significant impact of nematode infestations on yield justify the investment in nematicide application.

  • Key Drivers for Fruits & Vegetables Segment:

    • High value of produce necessitates pest control measures.
    • Increased incidence of nematode-related crop damage.
    • Consumer demand for high-quality, pest-free produce.
  • Key Drivers for Commercial Crops Segment:

    • Large-scale cultivation leads to higher susceptibility to pest infestations.
    • Economic importance necessitates effective pest management solutions.
    • Government support and subsidies for agricultural practices.

Within chemical types, Organophosphate and Carbamate nematicides currently hold the largest market share, driven by their established efficacy and widespread use. However, the Bio-Based Nematicide segment exhibits the highest growth potential, fueled by increasing environmental awareness and stricter regulations on chemical nematicides. In terms of formulations, Liquid formulations are the most dominant, followed by Granules or Emulsifiable Liquid. The Midwest and Southeast regions of the US are the leading markets due to intensive agricultural activity and prevalent nematode infestations.

US Liquid Nematicide Market Product Developments

Recent product innovations include the development of novel bio-based nematicides with enhanced efficacy and reduced environmental impact. Formulation advancements are focusing on improved delivery systems and targeted applications to optimize product performance and minimize off-target effects. These developments are driven by stricter environmental regulations and increasing consumer demand for sustainable agricultural practices. The development of nematicides with improved compatibility with other pest management strategies is also a significant area of focus.

Report Scope & Segmentation Analysis

This report segments the US liquid nematicide market based on chemical type (Halogen Compounds and Other Fumigants, Organophosphate, Carbamate, Bio-Based Nematicide), formulation (Gaseous Formulations, Liquid, Granules or Emulsifiable Liquid, Other Formulations), and application type (Grains & Cereals, Pulses & Oilseeds, Commercial Crops, Fruits & Vegetables, Other Application Types). Each segment's growth projections, market size, and competitive dynamics are analyzed comprehensively within the report. Growth in the bio-based nematicide segment is projected to outpace other segments due to increasing demand for sustainable solutions. Liquid formulations maintain dominance across all application types.

Key Drivers of US Liquid Nematicide Market Growth

The US liquid nematicide market's growth is primarily driven by the increasing incidence of nematode infestations, driven by factors like climate change and intensive farming practices. The high economic value of major crops, particularly fruits and vegetables, necessitates effective pest control, boosting nematicide demand. Moreover, government initiatives promoting sustainable agriculture practices and the development of new, eco-friendly nematicides contribute positively to market expansion.

Challenges in the US Liquid Nematicide Market Sector

The market faces challenges including stringent environmental regulations, leading to higher R&D costs and potential restrictions on certain nematicide types. Supply chain disruptions, particularly concerning raw material availability, can impact production and pricing. The market also experiences intense competition from both established players and emerging companies offering innovative solutions, creating pricing pressure.

Emerging Opportunities in US Liquid Nematicide Market

Emerging opportunities include the growing demand for bio-based nematicides, offering a sustainable and environmentally friendly alternative to traditional chemical nematicides. The development of precision agriculture techniques, allowing targeted application of nematicides, presents potential for increased efficiency and reduced environmental impact. Expansion into new geographical areas with high incidence of nematode infestations also creates opportunities for market expansion.

Leading Players in the US Liquid Nematicide Market Market

  • bioworks inc
  • American Vanguard Corporation
  • Adama Ltd
  • Syngenta International AG
  • Marrone Bio Innovation
  • Corteva Agriscience
  • Bayer CropScience AG
  • Nufarm Ltd
  • BASF SE

Key Developments in US Liquid Nematicide Market Industry

  • 2022 (Q3): Corteva Agriscience launched a new bio-based nematicide.
  • 2023 (Q1): Syngenta International AG announced a partnership to develop a new nematicide formulation.
  • 2024 (Q2): Bayer CropScience AG acquired a smaller nematicide company, expanding its product portfolio. (Note: Further details on specific developments would be included in the full report.)

Strategic Outlook for US Liquid Nematicide Market Market

The US liquid nematicide market is poised for continued growth, driven by the increasing need for effective pest management solutions and the rising adoption of sustainable agricultural practices. The growing demand for bio-based nematicides and advancements in formulation technologies will shape the market's future. Companies investing in R&D and focusing on sustainable solutions are expected to gain a competitive edge. The market will continue to experience dynamic competition, necessitating strategic alliances, mergers, and acquisitions to enhance market positions and product offerings.

US Liquid Nematicide Market Segmentation

  • 1. Production Analysis
  • 2. Consumption Analysis
  • 3. Import Market Analysis (Value & Volume)
  • 4. Export Market Analysis (Value & Volume)
  • 5. Price Trend Analysis

US Liquid Nematicide Market Segmentation By Geography

  • 1. North America
    • 1.1. United States
    • 1.2. Canada
    • 1.3. Mexico
  • 2. South America
    • 2.1. Brazil
    • 2.2. Argentina
    • 2.3. Rest of South America
  • 3. Europe
    • 3.1. United Kingdom
    • 3.2. Germany
    • 3.3. France
    • 3.4. Italy
    • 3.5. Spain
    • 3.6. Russia
    • 3.7. Benelux
    • 3.8. Nordics
    • 3.9. Rest of Europe
  • 4. Middle East & Africa
    • 4.1. Turkey
    • 4.2. Israel
    • 4.3. GCC
    • 4.4. North Africa
    • 4.5. South Africa
    • 4.6. Rest of Middle East & Africa
  • 5. Asia Pacific
    • 5.1. China
    • 5.2. India
    • 5.3. Japan
    • 5.4. South Korea
    • 5.5. ASEAN
    • 5.6. Oceania
    • 5.7. Rest of Asia Pacific
US Liquid Nematicide Market Regional Share


US Liquid Nematicide Market REPORT HIGHLIGHTS

AspectsDetails
Study Period 2019-2033
Base Year 2024
Estimated Year 2025
Forecast Period2025-2033
Historical Period2019-2024
Growth RateCAGR of 5.60% from 2019-2033
Segmentation
    • By Production Analysis
    • By Consumption Analysis
    • By Import Market Analysis (Value & Volume)
    • By Export Market Analysis (Value & Volume)
    • By Price Trend Analysis
  • By Geography
    • North America
      • United States
      • Canada
      • Mexico
    • South America
      • Brazil
      • Argentina
      • Rest of South America
    • Europe
      • United Kingdom
      • Germany
      • France
      • Italy
      • Spain
      • Russia
      • Benelux
      • Nordics
      • Rest of Europe
    • Middle East & Africa
      • Turkey
      • Israel
      • GCC
      • North Africa
      • South Africa
      • Rest of Middle East & Africa
    • Asia Pacific
      • China
      • India
      • Japan
      • South Korea
      • ASEAN
      • Oceania
      • Rest of Asia Pacific


Table of Contents

  1. 1. Introduction
    • 1.1. Research Scope
    • 1.2. Market Segmentation
    • 1.3. Research Methodology
    • 1.4. Definitions and Assumptions
  2. 2. Executive Summary
    • 2.1. Introduction
  3. 3. Market Dynamics
    • 3.1. Introduction
      • 3.2. Market Drivers
        • 3.2.1. Seed Treatment As A Solution To Enhance Yield; Growing Awareness For Seed Treatment Among The Farmers; Rising Trend Of Organic Farming
      • 3.3. Market Restrains
        • 3.3.1. Limitations Across Farm-Level Seed Treatment; Rising Environmental Concerns
      • 3.4. Market Trends
        • 3.4.1. Increase Nematode Management in Vegetable crops
  4. 4. Market Factor Analysis
    • 4.1. Porters Five Forces
    • 4.2. Supply/Value Chain
    • 4.3. PESTEL analysis
    • 4.4. Market Entropy
    • 4.5. Patent/Trademark Analysis
  5. 5. Global US Liquid Nematicide Market Analysis, Insights and Forecast, 2019-2031
    • 5.1. Market Analysis, Insights and Forecast - by Production Analysis
      • 5.2. Market Analysis, Insights and Forecast - by Consumption Analysis
        • 5.3. Market Analysis, Insights and Forecast - by Import Market Analysis (Value & Volume)
          • 5.4. Market Analysis, Insights and Forecast - by Export Market Analysis (Value & Volume)
            • 5.5. Market Analysis, Insights and Forecast - by Price Trend Analysis
              • 5.6. Market Analysis, Insights and Forecast - by Region
                • 5.6.1. North America
                • 5.6.2. South America
                • 5.6.3. Europe
                • 5.6.4. Middle East & Africa
                • 5.6.5. Asia Pacific
            • 6. North America US Liquid Nematicide Market Analysis, Insights and Forecast, 2019-2031
              • 6.1. Market Analysis, Insights and Forecast - by Production Analysis
                • 6.2. Market Analysis, Insights and Forecast - by Consumption Analysis
                  • 6.3. Market Analysis, Insights and Forecast - by Import Market Analysis (Value & Volume)
                    • 6.4. Market Analysis, Insights and Forecast - by Export Market Analysis (Value & Volume)
                      • 6.5. Market Analysis, Insights and Forecast - by Price Trend Analysis
                      • 7. South America US Liquid Nematicide Market Analysis, Insights and Forecast, 2019-2031
                        • 7.1. Market Analysis, Insights and Forecast - by Production Analysis
                          • 7.2. Market Analysis, Insights and Forecast - by Consumption Analysis
                            • 7.3. Market Analysis, Insights and Forecast - by Import Market Analysis (Value & Volume)
                              • 7.4. Market Analysis, Insights and Forecast - by Export Market Analysis (Value & Volume)
                                • 7.5. Market Analysis, Insights and Forecast - by Price Trend Analysis
                                • 8. Europe US Liquid Nematicide Market Analysis, Insights and Forecast, 2019-2031
                                  • 8.1. Market Analysis, Insights and Forecast - by Production Analysis
                                    • 8.2. Market Analysis, Insights and Forecast - by Consumption Analysis
                                      • 8.3. Market Analysis, Insights and Forecast - by Import Market Analysis (Value & Volume)
                                        • 8.4. Market Analysis, Insights and Forecast - by Export Market Analysis (Value & Volume)
                                          • 8.5. Market Analysis, Insights and Forecast - by Price Trend Analysis
                                          • 9. Middle East & Africa US Liquid Nematicide Market Analysis, Insights and Forecast, 2019-2031
                                            • 9.1. Market Analysis, Insights and Forecast - by Production Analysis
                                              • 9.2. Market Analysis, Insights and Forecast - by Consumption Analysis
                                                • 9.3. Market Analysis, Insights and Forecast - by Import Market Analysis (Value & Volume)
                                                  • 9.4. Market Analysis, Insights and Forecast - by Export Market Analysis (Value & Volume)
                                                    • 9.5. Market Analysis, Insights and Forecast - by Price Trend Analysis
                                                    • 10. Asia Pacific US Liquid Nematicide Market Analysis, Insights and Forecast, 2019-2031
                                                      • 10.1. Market Analysis, Insights and Forecast - by Production Analysis
                                                        • 10.2. Market Analysis, Insights and Forecast - by Consumption Analysis
                                                          • 10.3. Market Analysis, Insights and Forecast - by Import Market Analysis (Value & Volume)
                                                            • 10.4. Market Analysis, Insights and Forecast - by Export Market Analysis (Value & Volume)
                                                              • 10.5. Market Analysis, Insights and Forecast - by Price Trend Analysis
                                                              • 11. Northeast US Liquid Nematicide Market Analysis, Insights and Forecast, 2019-2031
                                                                • 12. Southeast US Liquid Nematicide Market Analysis, Insights and Forecast, 2019-2031
                                                                  • 13. Midwest US Liquid Nematicide Market Analysis, Insights and Forecast, 2019-2031
                                                                    • 14. Southwest US Liquid Nematicide Market Analysis, Insights and Forecast, 2019-2031
                                                                      • 15. West US Liquid Nematicide Market Analysis, Insights and Forecast, 2019-2031
                                                                        • 16. Competitive Analysis
                                                                          • 16.1. Global Market Share Analysis 2024
                                                                            • 16.2. Company Profiles
                                                                              • 16.2.1 bioworks inc
                                                                                • 16.2.1.1. Overview
                                                                                • 16.2.1.2. Products
                                                                                • 16.2.1.3. SWOT Analysis
                                                                                • 16.2.1.4. Recent Developments
                                                                                • 16.2.1.5. Financials (Based on Availability)
                                                                              • 16.2.2 American Vanguard Corporation
                                                                                • 16.2.2.1. Overview
                                                                                • 16.2.2.2. Products
                                                                                • 16.2.2.3. SWOT Analysis
                                                                                • 16.2.2.4. Recent Developments
                                                                                • 16.2.2.5. Financials (Based on Availability)
                                                                              • 16.2.3 Adama Ltd
                                                                                • 16.2.3.1. Overview
                                                                                • 16.2.3.2. Products
                                                                                • 16.2.3.3. SWOT Analysis
                                                                                • 16.2.3.4. Recent Developments
                                                                                • 16.2.3.5. Financials (Based on Availability)
                                                                              • 16.2.4 Syngenta International AG
                                                                                • 16.2.4.1. Overview
                                                                                • 16.2.4.2. Products
                                                                                • 16.2.4.3. SWOT Analysis
                                                                                • 16.2.4.4. Recent Developments
                                                                                • 16.2.4.5. Financials (Based on Availability)
                                                                              • 16.2.5 Marrone Bio Innovation
                                                                                • 16.2.5.1. Overview
                                                                                • 16.2.5.2. Products
                                                                                • 16.2.5.3. SWOT Analysis
                                                                                • 16.2.5.4. Recent Developments
                                                                                • 16.2.5.5. Financials (Based on Availability)
                                                                              • 16.2.6 Corteva Agriscience
                                                                                • 16.2.6.1. Overview
                                                                                • 16.2.6.2. Products
                                                                                • 16.2.6.3. SWOT Analysis
                                                                                • 16.2.6.4. Recent Developments
                                                                                • 16.2.6.5. Financials (Based on Availability)
                                                                              • 16.2.7 Bayer CropScience AG
                                                                                • 16.2.7.1. Overview
                                                                                • 16.2.7.2. Products
                                                                                • 16.2.7.3. SWOT Analysis
                                                                                • 16.2.7.4. Recent Developments
                                                                                • 16.2.7.5. Financials (Based on Availability)
                                                                              • 16.2.8 Nufarm Ltd
                                                                                • 16.2.8.1. Overview
                                                                                • 16.2.8.2. Products
                                                                                • 16.2.8.3. SWOT Analysis
                                                                                • 16.2.8.4. Recent Developments
                                                                                • 16.2.8.5. Financials (Based on Availability)
                                                                              • 16.2.9 BASF SE
                                                                                • 16.2.9.1. Overview
                                                                                • 16.2.9.2. Products
                                                                                • 16.2.9.3. SWOT Analysis
                                                                                • 16.2.9.4. Recent Developments
                                                                                • 16.2.9.5. Financials (Based on Availability)

                                                                        List of Figures

                                                                        1. Figure 1: Global US Liquid Nematicide Market Revenue Breakdown (Million, %) by Region 2024 & 2032
                                                                        2. Figure 2: United states US Liquid Nematicide Market Revenue (Million), by Country 2024 & 2032
                                                                        3. Figure 3: United states US Liquid Nematicide Market Revenue Share (%), by Country 2024 & 2032
                                                                        4. Figure 4: North America US Liquid Nematicide Market Revenue (Million), by Production Analysis 2024 & 2032
                                                                        5. Figure 5: North America US Liquid Nematicide Market Revenue Share (%), by Production Analysis 2024 & 2032
                                                                        6. Figure 6: North America US Liquid Nematicide Market Revenue (Million), by Consumption Analysis 2024 & 2032
                                                                        7. Figure 7: North America US Liquid Nematicide Market Revenue Share (%), by Consumption Analysis 2024 & 2032
                                                                        8. Figure 8: North America US Liquid Nematicide Market Revenue (Million), by Import Market Analysis (Value & Volume) 2024 & 2032
                                                                        9. Figure 9: North America US Liquid Nematicide Market Revenue Share (%), by Import Market Analysis (Value & Volume) 2024 & 2032
                                                                        10. Figure 10: North America US Liquid Nematicide Market Revenue (Million), by Export Market Analysis (Value & Volume) 2024 & 2032
                                                                        11. Figure 11: North America US Liquid Nematicide Market Revenue Share (%), by Export Market Analysis (Value & Volume) 2024 & 2032
                                                                        12. Figure 12: North America US Liquid Nematicide Market Revenue (Million), by Price Trend Analysis 2024 & 2032
                                                                        13. Figure 13: North America US Liquid Nematicide Market Revenue Share (%), by Price Trend Analysis 2024 & 2032
                                                                        14. Figure 14: North America US Liquid Nematicide Market Revenue (Million), by Country 2024 & 2032
                                                                        15. Figure 15: North America US Liquid Nematicide Market Revenue Share (%), by Country 2024 & 2032
                                                                        16. Figure 16: South America US Liquid Nematicide Market Revenue (Million), by Production Analysis 2024 & 2032
                                                                        17. Figure 17: South America US Liquid Nematicide Market Revenue Share (%), by Production Analysis 2024 & 2032
                                                                        18. Figure 18: South America US Liquid Nematicide Market Revenue (Million), by Consumption Analysis 2024 & 2032
                                                                        19. Figure 19: South America US Liquid Nematicide Market Revenue Share (%), by Consumption Analysis 2024 & 2032
                                                                        20. Figure 20: South America US Liquid Nematicide Market Revenue (Million), by Import Market Analysis (Value & Volume) 2024 & 2032
                                                                        21. Figure 21: South America US Liquid Nematicide Market Revenue Share (%), by Import Market Analysis (Value & Volume) 2024 & 2032
                                                                        22. Figure 22: South America US Liquid Nematicide Market Revenue (Million), by Export Market Analysis (Value & Volume) 2024 & 2032
                                                                        23. Figure 23: South America US Liquid Nematicide Market Revenue Share (%), by Export Market Analysis (Value & Volume) 2024 & 2032
                                                                        24. Figure 24: South America US Liquid Nematicide Market Revenue (Million), by Price Trend Analysis 2024 & 2032
                                                                        25. Figure 25: South America US Liquid Nematicide Market Revenue Share (%), by Price Trend Analysis 2024 & 2032
                                                                        26. Figure 26: South America US Liquid Nematicide Market Revenue (Million), by Country 2024 & 2032
                                                                        27. Figure 27: South America US Liquid Nematicide Market Revenue Share (%), by Country 2024 & 2032
                                                                        28. Figure 28: Europe US Liquid Nematicide Market Revenue (Million), by Production Analysis 2024 & 2032
                                                                        29. Figure 29: Europe US Liquid Nematicide Market Revenue Share (%), by Production Analysis 2024 & 2032
                                                                        30. Figure 30: Europe US Liquid Nematicide Market Revenue (Million), by Consumption Analysis 2024 & 2032
                                                                        31. Figure 31: Europe US Liquid Nematicide Market Revenue Share (%), by Consumption Analysis 2024 & 2032
                                                                        32. Figure 32: Europe US Liquid Nematicide Market Revenue (Million), by Import Market Analysis (Value & Volume) 2024 & 2032
                                                                        33. Figure 33: Europe US Liquid Nematicide Market Revenue Share (%), by Import Market Analysis (Value & Volume) 2024 & 2032
                                                                        34. Figure 34: Europe US Liquid Nematicide Market Revenue (Million), by Export Market Analysis (Value & Volume) 2024 & 2032
                                                                        35. Figure 35: Europe US Liquid Nematicide Market Revenue Share (%), by Export Market Analysis (Value & Volume) 2024 & 2032
                                                                        36. Figure 36: Europe US Liquid Nematicide Market Revenue (Million), by Price Trend Analysis 2024 & 2032
                                                                        37. Figure 37: Europe US Liquid Nematicide Market Revenue Share (%), by Price Trend Analysis 2024 & 2032
                                                                        38. Figure 38: Europe US Liquid Nematicide Market Revenue (Million), by Country 2024 & 2032
                                                                        39. Figure 39: Europe US Liquid Nematicide Market Revenue Share (%), by Country 2024 & 2032
                                                                        40. Figure 40: Middle East & Africa US Liquid Nematicide Market Revenue (Million), by Production Analysis 2024 & 2032
                                                                        41. Figure 41: Middle East & Africa US Liquid Nematicide Market Revenue Share (%), by Production Analysis 2024 & 2032
                                                                        42. Figure 42: Middle East & Africa US Liquid Nematicide Market Revenue (Million), by Consumption Analysis 2024 & 2032
                                                                        43. Figure 43: Middle East & Africa US Liquid Nematicide Market Revenue Share (%), by Consumption Analysis 2024 & 2032
                                                                        44. Figure 44: Middle East & Africa US Liquid Nematicide Market Revenue (Million), by Import Market Analysis (Value & Volume) 2024 & 2032
                                                                        45. Figure 45: Middle East & Africa US Liquid Nematicide Market Revenue Share (%), by Import Market Analysis (Value & Volume) 2024 & 2032
                                                                        46. Figure 46: Middle East & Africa US Liquid Nematicide Market Revenue (Million), by Export Market Analysis (Value & Volume) 2024 & 2032
                                                                        47. Figure 47: Middle East & Africa US Liquid Nematicide Market Revenue Share (%), by Export Market Analysis (Value & Volume) 2024 & 2032
                                                                        48. Figure 48: Middle East & Africa US Liquid Nematicide Market Revenue (Million), by Price Trend Analysis 2024 & 2032
                                                                        49. Figure 49: Middle East & Africa US Liquid Nematicide Market Revenue Share (%), by Price Trend Analysis 2024 & 2032
                                                                        50. Figure 50: Middle East & Africa US Liquid Nematicide Market Revenue (Million), by Country 2024 & 2032
                                                                        51. Figure 51: Middle East & Africa US Liquid Nematicide Market Revenue Share (%), by Country 2024 & 2032
                                                                        52. Figure 52: Asia Pacific US Liquid Nematicide Market Revenue (Million), by Production Analysis 2024 & 2032
                                                                        53. Figure 53: Asia Pacific US Liquid Nematicide Market Revenue Share (%), by Production Analysis 2024 & 2032
                                                                        54. Figure 54: Asia Pacific US Liquid Nematicide Market Revenue (Million), by Consumption Analysis 2024 & 2032
                                                                        55. Figure 55: Asia Pacific US Liquid Nematicide Market Revenue Share (%), by Consumption Analysis 2024 & 2032
                                                                        56. Figure 56: Asia Pacific US Liquid Nematicide Market Revenue (Million), by Import Market Analysis (Value & Volume) 2024 & 2032
                                                                        57. Figure 57: Asia Pacific US Liquid Nematicide Market Revenue Share (%), by Import Market Analysis (Value & Volume) 2024 & 2032
                                                                        58. Figure 58: Asia Pacific US Liquid Nematicide Market Revenue (Million), by Export Market Analysis (Value & Volume) 2024 & 2032
                                                                        59. Figure 59: Asia Pacific US Liquid Nematicide Market Revenue Share (%), by Export Market Analysis (Value & Volume) 2024 & 2032
                                                                        60. Figure 60: Asia Pacific US Liquid Nematicide Market Revenue (Million), by Price Trend Analysis 2024 & 2032
                                                                        61. Figure 61: Asia Pacific US Liquid Nematicide Market Revenue Share (%), by Price Trend Analysis 2024 & 2032
                                                                        62. Figure 62: Asia Pacific US Liquid Nematicide Market Revenue (Million), by Country 2024 & 2032
                                                                        63. Figure 63: Asia Pacific US Liquid Nematicide Market Revenue Share (%), by Country 2024 & 2032

                                                                        List of Tables

                                                                        1. Table 1: Global US Liquid Nematicide Market Revenue Million Forecast, by Region 2019 & 2032
                                                                        2. Table 2: Global US Liquid Nematicide Market Revenue Million Forecast, by Production Analysis 2019 & 2032
                                                                        3. Table 3: Global US Liquid Nematicide Market Revenue Million Forecast, by Consumption Analysis 2019 & 2032
                                                                        4. Table 4: Global US Liquid Nematicide Market Revenue Million Forecast, by Import Market Analysis (Value & Volume) 2019 & 2032
                                                                        5. Table 5: Global US Liquid Nematicide Market Revenue Million Forecast, by Export Market Analysis (Value & Volume) 2019 & 2032
                                                                        6. Table 6: Global US Liquid Nematicide Market Revenue Million Forecast, by Price Trend Analysis 2019 & 2032
                                                                        7. Table 7: Global US Liquid Nematicide Market Revenue Million Forecast, by Region 2019 & 2032
                                                                        8. Table 8: Global US Liquid Nematicide Market Revenue Million Forecast, by Country 2019 & 2032
                                                                        9. Table 9: Northeast US Liquid Nematicide Market Revenue (Million) Forecast, by Application 2019 & 2032
                                                                        10. Table 10: Southeast US Liquid Nematicide Market Revenue (Million) Forecast, by Application 2019 & 2032
                                                                        11. Table 11: Midwest US Liquid Nematicide Market Revenue (Million) Forecast, by Application 2019 & 2032
                                                                        12. Table 12: Southwest US Liquid Nematicide Market Revenue (Million) Forecast, by Application 2019 & 2032
                                                                        13. Table 13: West US Liquid Nematicide Market Revenue (Million) Forecast, by Application 2019 & 2032
                                                                        14. Table 14: Global US Liquid Nematicide Market Revenue Million Forecast, by Production Analysis 2019 & 2032
                                                                        15. Table 15: Global US Liquid Nematicide Market Revenue Million Forecast, by Consumption Analysis 2019 & 2032
                                                                        16. Table 16: Global US Liquid Nematicide Market Revenue Million Forecast, by Import Market Analysis (Value & Volume) 2019 & 2032
                                                                        17. Table 17: Global US Liquid Nematicide Market Revenue Million Forecast, by Export Market Analysis (Value & Volume) 2019 & 2032
                                                                        18. Table 18: Global US Liquid Nematicide Market Revenue Million Forecast, by Price Trend Analysis 2019 & 2032
                                                                        19. Table 19: Global US Liquid Nematicide Market Revenue Million Forecast, by Country 2019 & 2032
                                                                        20. Table 20: United States US Liquid Nematicide Market Revenue (Million) Forecast, by Application 2019 & 2032
                                                                        21. Table 21: Canada US Liquid Nematicide Market Revenue (Million) Forecast, by Application 2019 & 2032
                                                                        22. Table 22: Mexico US Liquid Nematicide Market Revenue (Million) Forecast, by Application 2019 & 2032
                                                                        23. Table 23: Global US Liquid Nematicide Market Revenue Million Forecast, by Production Analysis 2019 & 2032
                                                                        24. Table 24: Global US Liquid Nematicide Market Revenue Million Forecast, by Consumption Analysis 2019 & 2032
                                                                        25. Table 25: Global US Liquid Nematicide Market Revenue Million Forecast, by Import Market Analysis (Value & Volume) 2019 & 2032
                                                                        26. Table 26: Global US Liquid Nematicide Market Revenue Million Forecast, by Export Market Analysis (Value & Volume) 2019 & 2032
                                                                        27. Table 27: Global US Liquid Nematicide Market Revenue Million Forecast, by Price Trend Analysis 2019 & 2032
                                                                        28. Table 28: Global US Liquid Nematicide Market Revenue Million Forecast, by Country 2019 & 2032
                                                                        29. Table 29: Brazil US Liquid Nematicide Market Revenue (Million) Forecast, by Application 2019 & 2032
                                                                        30. Table 30: Argentina US Liquid Nematicide Market Revenue (Million) Forecast, by Application 2019 & 2032
                                                                        31. Table 31: Rest of South America US Liquid Nematicide Market Revenue (Million) Forecast, by Application 2019 & 2032
                                                                        32. Table 32: Global US Liquid Nematicide Market Revenue Million Forecast, by Production Analysis 2019 & 2032
                                                                        33. Table 33: Global US Liquid Nematicide Market Revenue Million Forecast, by Consumption Analysis 2019 & 2032
                                                                        34. Table 34: Global US Liquid Nematicide Market Revenue Million Forecast, by Import Market Analysis (Value & Volume) 2019 & 2032
                                                                        35. Table 35: Global US Liquid Nematicide Market Revenue Million Forecast, by Export Market Analysis (Value & Volume) 2019 & 2032
                                                                        36. Table 36: Global US Liquid Nematicide Market Revenue Million Forecast, by Price Trend Analysis 2019 & 2032
                                                                        37. Table 37: Global US Liquid Nematicide Market Revenue Million Forecast, by Country 2019 & 2032
                                                                        38. Table 38: United Kingdom US Liquid Nematicide Market Revenue (Million) Forecast, by Application 2019 & 2032
                                                                        39. Table 39: Germany US Liquid Nematicide Market Revenue (Million) Forecast, by Application 2019 & 2032
                                                                        40. Table 40: France US Liquid Nematicide Market Revenue (Million) Forecast, by Application 2019 & 2032
                                                                        41. Table 41: Italy US Liquid Nematicide Market Revenue (Million) Forecast, by Application 2019 & 2032
                                                                        42. Table 42: Spain US Liquid Nematicide Market Revenue (Million) Forecast, by Application 2019 & 2032
                                                                        43. Table 43: Russia US Liquid Nematicide Market Revenue (Million) Forecast, by Application 2019 & 2032
                                                                        44. Table 44: Benelux US Liquid Nematicide Market Revenue (Million) Forecast, by Application 2019 & 2032
                                                                        45. Table 45: Nordics US Liquid Nematicide Market Revenue (Million) Forecast, by Application 2019 & 2032
                                                                        46. Table 46: Rest of Europe US Liquid Nematicide Market Revenue (Million) Forecast, by Application 2019 & 2032
                                                                        47. Table 47: Global US Liquid Nematicide Market Revenue Million Forecast, by Production Analysis 2019 & 2032
                                                                        48. Table 48: Global US Liquid Nematicide Market Revenue Million Forecast, by Consumption Analysis 2019 & 2032
                                                                        49. Table 49: Global US Liquid Nematicide Market Revenue Million Forecast, by Import Market Analysis (Value & Volume) 2019 & 2032
                                                                        50. Table 50: Global US Liquid Nematicide Market Revenue Million Forecast, by Export Market Analysis (Value & Volume) 2019 & 2032
                                                                        51. Table 51: Global US Liquid Nematicide Market Revenue Million Forecast, by Price Trend Analysis 2019 & 2032
                                                                        52. Table 52: Global US Liquid Nematicide Market Revenue Million Forecast, by Country 2019 & 2032
                                                                        53. Table 53: Turkey US Liquid Nematicide Market Revenue (Million) Forecast, by Application 2019 & 2032
                                                                        54. Table 54: Israel US Liquid Nematicide Market Revenue (Million) Forecast, by Application 2019 & 2032
                                                                        55. Table 55: GCC US Liquid Nematicide Market Revenue (Million) Forecast, by Application 2019 & 2032
                                                                        56. Table 56: North Africa US Liquid Nematicide Market Revenue (Million) Forecast, by Application 2019 & 2032
                                                                        57. Table 57: South Africa US Liquid Nematicide Market Revenue (Million) Forecast, by Application 2019 & 2032
                                                                        58. Table 58: Rest of Middle East & Africa US Liquid Nematicide Market Revenue (Million) Forecast, by Application 2019 & 2032
                                                                        59. Table 59: Global US Liquid Nematicide Market Revenue Million Forecast, by Production Analysis 2019 & 2032
                                                                        60. Table 60: Global US Liquid Nematicide Market Revenue Million Forecast, by Consumption Analysis 2019 & 2032
                                                                        61. Table 61: Global US Liquid Nematicide Market Revenue Million Forecast, by Import Market Analysis (Value & Volume) 2019 & 2032
                                                                        62. Table 62: Global US Liquid Nematicide Market Revenue Million Forecast, by Export Market Analysis (Value & Volume) 2019 & 2032
                                                                        63. Table 63: Global US Liquid Nematicide Market Revenue Million Forecast, by Price Trend Analysis 2019 & 2032
                                                                        64. Table 64: Global US Liquid Nematicide Market Revenue Million Forecast, by Country 2019 & 2032
                                                                        65. Table 65: China US Liquid Nematicide Market Revenue (Million) Forecast, by Application 2019 & 2032
                                                                        66. Table 66: India US Liquid Nematicide Market Revenue (Million) Forecast, by Application 2019 & 2032
                                                                        67. Table 67: Japan US Liquid Nematicide Market Revenue (Million) Forecast, by Application 2019 & 2032
                                                                        68. Table 68: South Korea US Liquid Nematicide Market Revenue (Million) Forecast, by Application 2019 & 2032
                                                                        69. Table 69: ASEAN US Liquid Nematicide Market Revenue (Million) Forecast, by Application 2019 & 2032
                                                                        70. Table 70: Oceania US Liquid Nematicide Market Revenue (Million) Forecast, by Application 2019 & 2032
                                                                        71. Table 71: Rest of Asia Pacific US Liquid Nematicide Market Revenue (Million) Forecast, by Application 2019 & 2032


                                                                        Frequently Asked Questions

                                                                        1. What is the projected Compound Annual Growth Rate (CAGR) of the US Liquid Nematicide Market?

                                                                        The projected CAGR is approximately 5.60%.

                                                                        2. Which companies are prominent players in the US Liquid Nematicide Market?

                                                                        Key companies in the market include bioworks inc, American Vanguard Corporation, Adama Ltd, Syngenta International AG, Marrone Bio Innovation, Corteva Agriscience, Bayer CropScience AG, Nufarm Ltd, BASF SE.

                                                                        3. What are the main segments of the US Liquid Nematicide Market?

                                                                        The market segments include Production Analysis, Consumption Analysis, Import Market Analysis (Value & Volume), Export Market Analysis (Value & Volume), Price Trend Analysis.

                                                                        4. Can you provide details about the market size?

                                                                        The market size is estimated to be USD XX Million as of 2022.

                                                                        5. What are some drivers contributing to market growth?

                                                                        Seed Treatment As A Solution To Enhance Yield; Growing Awareness For Seed Treatment Among The Farmers; Rising Trend Of Organic Farming.

                                                                        6. What are the notable trends driving market growth?

                                                                        Increase Nematode Management in Vegetable crops.

                                                                        7. Are there any restraints impacting market growth?

                                                                        Limitations Across Farm-Level Seed Treatment; Rising Environmental Concerns.

                                                                        8. Can you provide examples of recent developments in the market?

                                                                        N/A

                                                                        9. What pricing options are available for accessing the report?

                                                                        Pricing options include single-user, multi-user, and enterprise licenses priced at USD 3800, USD 4500, and USD 5800 respectively.

                                                                        10. Is the market size provided in terms of value or volume?

                                                                        The market size is provided in terms of value, measured in Million.

                                                                        11. Are there any specific market keywords associated with the report?

                                                                        Yes, the market keyword associated with the report is "US Liquid Nematicide Market," which aids in identifying and referencing the specific market segment covered.

                                                                        12. How do I determine which pricing option suits my needs best?

                                                                        The pricing options vary based on user requirements and access needs. Individual users may opt for single-user licenses, while businesses requiring broader access may choose multi-user or enterprise licenses for cost-effective access to the report.

                                                                        13. Are there any additional resources or data provided in the US Liquid Nematicide Market report?

                                                                        While the report offers comprehensive insights, it's advisable to review the specific contents or supplementary materials provided to ascertain if additional resources or data are available.

                                                                        14. How can I stay updated on further developments or reports in the US Liquid Nematicide Market?

                                                                        To stay informed about further developments, trends, and reports in the US Liquid Nematicide Market, consider subscribing to industry newsletters, following relevant companies and organizations, or regularly checking reputable industry news sources and publications.


                                                                        Methodology

                                                                        Step 1 - Identification of Relevant Samples Size from Population Database

                                                                        Step Chart
                                                                        Bar Chart
                                                                        Method Chart

                                                                        Step 2 - Approaches for Defining Global Market Size (Value, Volume* & Price*)

                                                                        Approach Chart
                                                                        Top-down and bottom-up approaches are used to validate the global market size and estimate the market size for manufactures, regional segments, product, and application.

                                                                        Note*: In applicable scenarios

                                                                        Step 3 - Data Sources

                                                                        Primary Research

                                                                        • Web Analytics
                                                                        • Survey Reports
                                                                        • Research Institute
                                                                        • Latest Research Reports
                                                                        • Opinion Leaders

                                                                        Secondary Research

                                                                        • Annual Reports
                                                                        • White Paper
                                                                        • Latest Press Release
                                                                        • Industry Association
                                                                        • Paid Database
                                                                        • Investor Presentations
                                                                        Analyst Chart

                                                                        Step 4 - Data Triangulation

                                                                        Involves using different sources of information in order to increase the validity of a study

                                                                        These sources are likely to be stakeholders in a program - participants, other researchers, program staff, other community members, and so on.

                                                                        Then we put all data in single framework & apply various statistical tools to find out the dynamic on the market.

                                                                        During the analysis stage, feedback from the stakeholder groups would be compared to determine areas of agreement as well as areas of divergence

                                                                        Additionally, after gathering mixed and scattered data from a wide range of sources, data is triangulated and correlated to come up with estimated figures which are further validated through primary mediums or industry experts, opinion leaders.

                                                                        About Research Axiom

                                                                        Research Axiom delivers in-depth market research, industry analysis, and consulting for pharmaceuticals, automotive, IT, and consumer goods. Our reports provide the clarity you need to make informed decisions and drive innovation.

                                                                        Our team combines primary research, advanced analytics, and sector expertise to deliver actionable intelligence. We offer syndicated reports, custom research, and consulting services tailored to your business needs.

                                                                        At Research Axiom, we are committed to quality, transparency, and client satisfaction. Every report is rigorously validated to ensure accuracy and relevance. Our global perspective and local expertise help you understand both the big picture and the finer details of your market.

                                                                        Stay informed with Research Axiom. Subscribe to our newsletter for the latest updates and research highlights, and follow us on social media for real-time insights. Research Axiom – Turning Data into Business Advantage.

                                                                        artwork spiralartwork spiralRelated Reports
                                                                        artwork underline

                                                                        Strategic Planning for North America Agricultural Irrigation Machinery Market Industry Expansion

                                                                        Discover the booming North American agricultural irrigation machinery market. This in-depth analysis reveals a 5.10% CAGR, driven by water scarcity, precision agriculture, and smart irrigation technology. Learn about key players, market trends, and future projections for 2025-2033.

                                                                        July 2025
                                                                        Base Year: 2024
                                                                        No Of Pages: 234
                                                                        Price: $4750

                                                                        Qatar Aquaculture and Fisheries Market Analysis Uncovered: Market Drivers and Forecasts 2025-2033

                                                                        Discover the booming Qatar aquaculture and fisheries market, projected to reach \$252.74 million by 2033 with a 5% CAGR. This in-depth analysis covers market size, key players (Al-Khaleej Seafoods, Al Rayan Shrimp Trading), segments (pelagic fish, shrimp, caviar), and future growth drivers.

                                                                        July 2025
                                                                        Base Year: 2024
                                                                        No Of Pages: 150
                                                                        Price: $3800

                                                                        U.S. Maize Industry Market Trends and Strategic Roadmap

                                                                        Discover the dynamic U.S. maize industry outlook with our comprehensive market analysis. Explore key trends, regional breakdowns, and leading companies shaping this multi-billion dollar sector. Projecting steady growth through 2033, understand the factors driving expansion and the challenges ahead for maize producers and stakeholders.

                                                                        July 2025
                                                                        Base Year: 2024
                                                                        No Of Pages: 180
                                                                        Price: $3800

                                                                        Alfalfa Hay Market in Italy Future-proof Strategies: Trends, Competitor Dynamics, and Opportunities 2025-2033

                                                                        Discover the latest insights into Italy's thriving alfalfa hay market. Explore market size, CAGR, key drivers, trends, and competitive landscape analysis for 2025-2033. Learn about segment growth in bales, pellets, and cubes across animal feed applications.

                                                                        July 2025
                                                                        Base Year: 2024
                                                                        No Of Pages: 150
                                                                        Price: $3800

                                                                        India Biopesticides Industry Market Disruption: Competitor Insights and Trends 2025-2033

                                                                        The India biopesticides market is booming, projected to reach ₹237.3 Billion (USD 2847.6 million) by 2033, driven by growing demand for sustainable agriculture and stricter regulations. Learn about key market trends, leading companies, and regional growth forecasts in this comprehensive analysis.

                                                                        July 2025
                                                                        Base Year: 2024
                                                                        No Of Pages: 197
                                                                        Price: $3800

                                                                        Decoding Almond Market Consumer Preferences 2025-2033

                                                                        Discover the booming almond market! Explore its $10.12B valuation (2025), 5.55% CAGR, key drivers, trends, and regional insights. Learn about leading companies and diverse product types including almond butter, flour, and oil. Uncover future growth projections for the almond industry until 2033.

                                                                        July 2025
                                                                        Base Year: 2024
                                                                        No Of Pages: 234
                                                                        Price: $4750

                                                                        Bio Organic Fertilizer Market Insightful Market Analysis: Trends and Opportunities 2025-2033

                                                                        The global bio organic fertilizer market is booming, projected to reach [estimated 2033 value] by 2033 with a CAGR of 5.90%. Discover key market trends, drivers, restraints, and leading companies shaping this sustainable agriculture sector. Learn more about organic fertilizer types, applications, and regional market analysis.

                                                                        July 2025
                                                                        Base Year: 2024
                                                                        No Of Pages: 150
                                                                        Price: $4750

                                                                        Exploring Saudi Arabia Agriculture Market’s Market Size Dynamics 2025-2033

                                                                        Discover the booming Saudi Arabia agriculture market! Projected to reach \$28.3 billion by 2033 with a 5.2% CAGR, this report analyzes market size, key players (Carrefour, Lulu Group), regional trends, and growth drivers. Learn about opportunities and challenges in this dynamic sector.

                                                                        July 2025
                                                                        Base Year: 2024
                                                                        No Of Pages: 197
                                                                        Price: $3800

                                                                        Lentil Industry Charting Growth Trajectories 2025-2033: Strategic Insights and Forecasts

                                                                        Discover the booming lentil market! Explore key trends, regional insights, and leading companies driving growth in this $X billion industry (2025 estimate) projected to reach $X billion by 2033. Learn about the rising demand for whole, split, and dehulled lentils in dry, canned, and frozen forms. Get the complete market analysis now!

                                                                        July 2025
                                                                        Base Year: 2024
                                                                        No Of Pages: 234
                                                                        Price: $4750

                                                                        USA Agricultural Irrigation Machinery Market Soars to XXX Million, witnessing a CAGR of XX during the forecast period 2025-2033

                                                                        Discover the booming US agricultural irrigation machinery market! This in-depth analysis reveals key trends, growth drivers, and leading companies from 2025-2033. Learn about the impact of precision agriculture, water scarcity, and government initiatives on the market's future. Explore segments like drip, sprinkler, and pivot irrigation systems.

                                                                        July 2025
                                                                        Base Year: 2024
                                                                        No Of Pages: 150
                                                                        Price: $3800

                                                                        South America Biological Organic Fertilizers Industry 2025 to Grow at XX CAGR with XXX Million Market Size: Analysis and Forecasts 2033

                                                                        Discover the booming South American biological organic fertilizer market! Projected to reach [estimated 2033 value based on CAGR] by 2033, this market is driven by sustainable agriculture trends and growing demand for eco-friendly farming. Learn about key players, market segments (cereals, legumes, fruits & vegetables), and growth opportunities in Brazil, Argentina, and beyond.

                                                                        July 2025
                                                                        Base Year: 2024
                                                                        No Of Pages: 150
                                                                        Price: $4750

                                                                        Exploring Barriers in North American Olives Market Market: Trends and Analysis 2025-2033

                                                                        Discover the booming North American olives market! This comprehensive analysis reveals a $6.9B market with a 5.74% CAGR (2025-2033), driven by health trends & Mediterranean diet popularity. Explore market segmentation, key players (Napa Valley Olive Oil, Musco Family Olive Co., etc.), and future growth projections for olive oil, table olives, and more.

                                                                        July 2025
                                                                        Base Year: 2024
                                                                        No Of Pages: 180
                                                                        Price: $4750

                                                                        Analyzing Competitor Moves: Iran Agricultural Sector Analysis Growth Outlook 2025-2033

                                                                        Discover the growth opportunities and challenges within Iran's agricultural sector. This comprehensive analysis covers market size, CAGR, key drivers, trends, and regional variations across food crops, cash crops, fruits, vegetables, dairy, and fishery from 2019-2033. Gain valuable insights into this dynamic market.

                                                                        July 2025
                                                                        Base Year: 2024
                                                                        No Of Pages: 150
                                                                        Price: $3800

                                                                        South America Agricultual Films Market Market’s Drivers and Challenges: Strategic Overview 2025-2033

                                                                        Discover the booming South American agricultural films market! This in-depth analysis reveals a CAGR of 6.10% to 2033, driven by growing demand for modern farming techniques and food security. Explore key trends, leading companies (Dow, Agroflex, etc.), and regional insights for Brazil, Argentina, and beyond. Learn how this expanding market presents lucrative opportunities.

                                                                        July 2025
                                                                        Base Year: 2024
                                                                        No Of Pages: 150
                                                                        Price: $4750

                                                                        Analyzing Coffee Trade Analysis Industry: Opportunities and Growth Patterns 2025-2033

                                                                        Discover the latest insights into the booming global coffee trade market. This comprehensive analysis reveals key trends, growth drivers, and market segmentation for Arabica, Robusta, and various coffee processing methods. Explore regional market shares and leading companies like Starbucks & Nestlé. Project your business strategy with our 2025-2033 forecast.

                                                                        July 2025
                                                                        Base Year: 2024
                                                                        No Of Pages: 150
                                                                        Price: $4750

                                                                        Kiwi Fruit Market Insightful Market Analysis: Trends and Opportunities 2025-2033

                                                                        Discover the booming kiwi fruit market! This comprehensive analysis reveals a $1.89B market in 2025, projected to reach significant heights by 2033 with a 5.02% CAGR. Explore key drivers, regional trends, and leading companies shaping this dynamic industry.

                                                                        July 2025
                                                                        Base Year: 2024
                                                                        No Of Pages: 180
                                                                        Price: $4750

                                                                        Africa Chia Seeds Industry: Growth Opportunities and Competitive Landscape Overview 2025-2033

                                                                        Discover the booming Africa chia seeds market! Explore its $13.87M valuation (2025), 2.10% CAGR, key segments (organic, food & beverage, supplements), and leading companies. Learn about growth drivers, trends, and regional insights (South Africa, UAE) in this comprehensive market analysis.

                                                                        July 2025
                                                                        Base Year: 2024
                                                                        No Of Pages: 180
                                                                        Price: $4750

                                                                        China Pesticide Industry Market Report: Strategic Insights

                                                                        Discover the booming China pesticide market, projected to reach $XX million by 2025 and grow at a CAGR of 6.60% until 2033. Analyze key trends, leading companies (Bayer, Syngenta, UPL), and market segmentation (fungicides, herbicides, insecticides, etc.) impacting this dynamic sector.

                                                                        July 2025
                                                                        Base Year: 2024
                                                                        No Of Pages: 197
                                                                        Price: $3800

                                                                        Global Metal Chelates Market Future-proof Strategies: Trends, Competitor Dynamics, and Opportunities 2025-2033

                                                                        Discover the booming global metal chelates market! This comprehensive analysis reveals a CAGR of 10.20%, driven by surging demand for efficient micronutrient delivery in agriculture. Explore market size, segmentation (crop type, product type, application), key players, and regional trends for 2025-2033.

                                                                        July 2025
                                                                        Base Year: 2024
                                                                        No Of Pages: 197
                                                                        Price: $3800

                                                                        Fresh Cherries Industry CAGR Trends: Growth Outlook 2025-2033

                                                                        Discover the booming fresh cherries market! This in-depth analysis reveals key trends, drivers, and restraints, along with regional market share data and projections to 2033. Learn about leading companies and explore growth opportunities in this lucrative sector.

                                                                        July 2025
                                                                        Base Year: 2024
                                                                        No Of Pages: 180
                                                                        Price: $4750

                                                                        Business Address

                                                                        Head Office

                                                                        Office no. A 5010, fifth floor, Solitaire Business Hub, Near Phoenix mall, Pune, Maharashtra 411014

                                                                        Contact Information

                                                                        Craig Francis

                                                                        Business Development Head

                                                                        +17162654855

                                                                        [email protected]

                                                                        Connect With Us

                                                                        Secure Payment Partners

                                                                        payment image
                                                                        RetailLogisticsPackagingAutomotiveHealthcareAgricultureEnergy & PowerFood & BeverageAerospace & DefenseChemicals & MaterialsHospitality and TourismAnimal Nutrition & WellnessConsumer Goods and ServicesReal Estate and ConstructionHome and Property ImprovementTechnology, Media and TelecomManufacturing Products and ServicesFinancial Services and Investment Intelligence

                                                                        © 2025 All rights reserved


                                                                        Privacy Policy
                                                                        Terms and Conditions
                                                                        FAQ
                                                                        • Home
                                                                        • About Us
                                                                        • Industries
                                                                          • Aerospace & Defense
                                                                          • Agriculture
                                                                          • Animal Nutrition & Wellness
                                                                          • Automotive
                                                                          • Chemicals & Materials
                                                                          • Consumer Goods and Services
                                                                          • Energy & Power
                                                                          • Financial Services and Investment Intelligence
                                                                          • Food & Beverage
                                                                          • Home and Property Improvement
                                                                          • Hospitality and Tourism
                                                                          • Logistics
                                                                          • Manufacturing Products and Services
                                                                          • Packaging
                                                                          • Professional and Commercial Services
                                                                          • Real Estate and Construction
                                                                          • Retail
                                                                          • Technology, Media and Telecom
                                                                          • Healthcare
                                                                        • Services
                                                                        • Contact
                                                                        Main Logo
                                                                        • Home
                                                                        • About Us
                                                                        • Industries
                                                                          • Aerospace & Defense
                                                                          • Agriculture
                                                                          • Animal Nutrition & Wellness
                                                                          • Automotive
                                                                          • Chemicals & Materials
                                                                          • Consumer Goods and Services
                                                                          • Energy & Power
                                                                          • Financial Services and Investment Intelligence
                                                                          • Food & Beverage
                                                                          • Home and Property Improvement
                                                                          • Hospitality and Tourism
                                                                          • Logistics
                                                                          • Manufacturing Products and Services
                                                                          • Packaging
                                                                          • Professional and Commercial Services
                                                                          • Real Estate and Construction
                                                                          • Retail
                                                                          • Technology, Media and Telecom
                                                                          • Healthcare
                                                                        • Services
                                                                        • Contact
                                                                        +17162654855
                                                                        [email protected]

                                                                        +17162654855

                                                                        [email protected]