
Key Insights
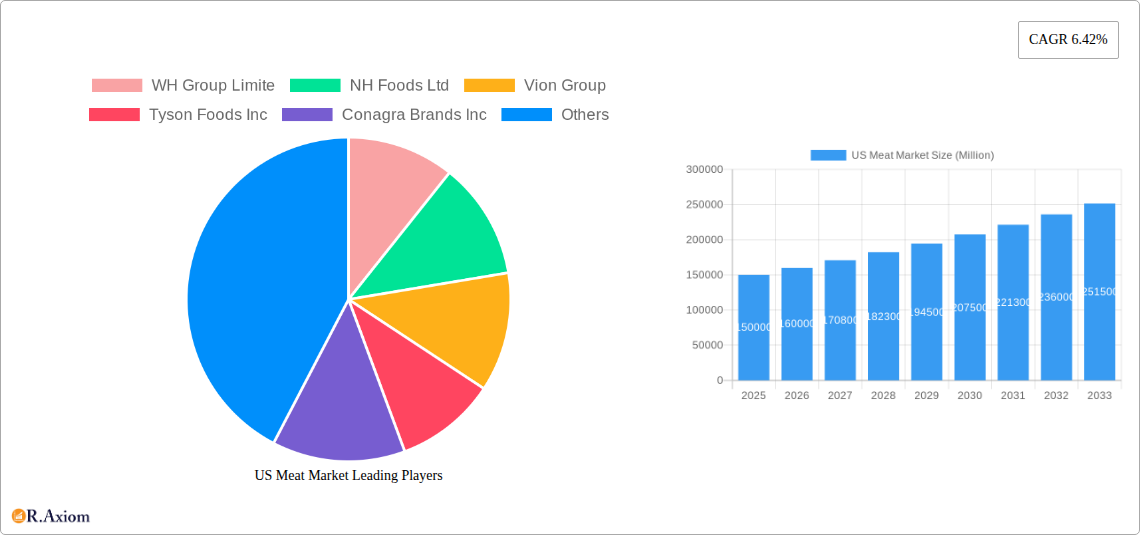
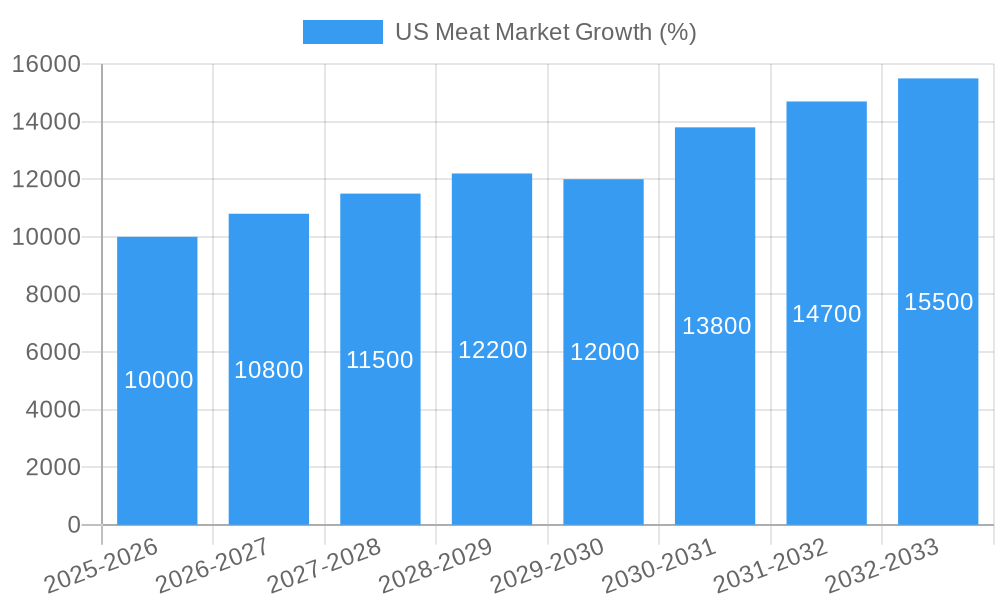
The US meat market, valued at approximately $150 billion in 2025, is projected to experience robust growth, driven by increasing consumer demand, particularly for convenient processed meat products and rising protein consumption. The market's Compound Annual Growth Rate (CAGR) of 6.42% from 2025 to 2033 indicates a significant expansion, reaching an estimated $250 billion by 2033. Key growth drivers include changing dietary habits, increasing disposable incomes, and the expansion of food service industries, including restaurants and food retailers. While beef remains a dominant segment, the market is also witnessing a notable rise in demand for alternative protein sources, influencing the growth of pork and poultry segments. The frozen and processed meat segments are expected to exhibit higher growth rates compared to fresh/chilled due to factors such as longer shelf life, convenience, and increased affordability. Distribution channels are diverse; however, the off-trade segment (grocery stores, supermarkets) holds a significant market share due to consumer preference and wider accessibility. Competition is fierce, with major players such as Tyson Foods, JBS SA, and Cargill Inc. vying for market dominance through strategic expansions, product innovations, and acquisitions.
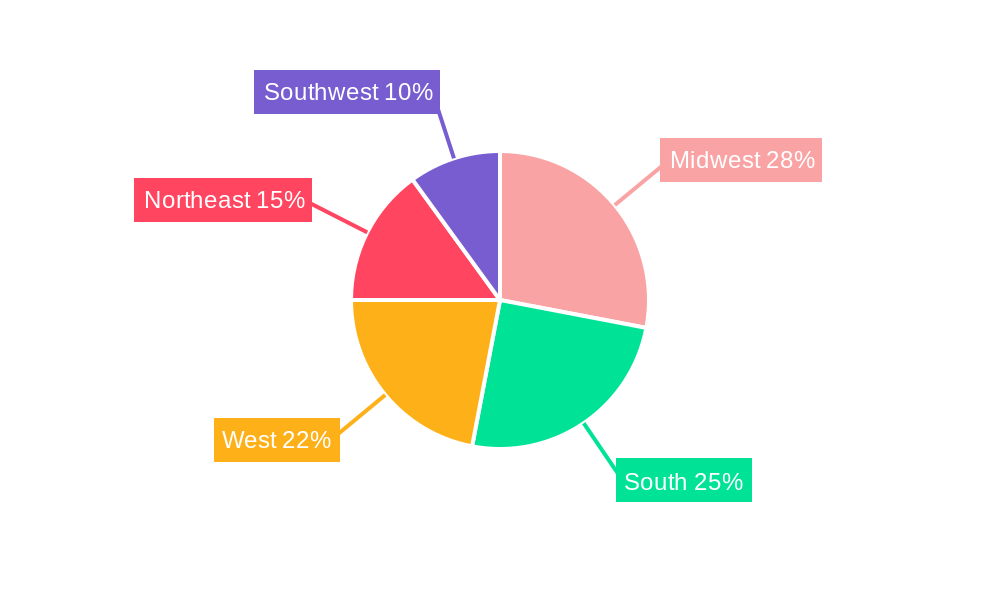
Despite positive growth projections, challenges remain. Increasing input costs (feed, labor, transportation) pose a significant restraint, leading to potential price increases and impacting consumer purchasing power. Growing concerns surrounding animal welfare and sustainability are also influencing consumer purchasing decisions, prompting companies to adopt more ethical and environmentally responsible practices. Regional variations exist; the Midwest and South, with large agricultural bases, exhibit higher market shares, though growth is anticipated across all regions driven by increasing population and urban development. The ongoing impact of global supply chain disruptions and inflationary pressures are also factors influencing the market's trajectory, although growth projections account for a moderation of these factors over the forecast period.
US Meat Market: A Comprehensive Market Report (2019-2033)
This in-depth report provides a comprehensive analysis of the US meat market, encompassing historical data (2019-2024), current estimates (2025), and future projections (2025-2033). It delves into market dynamics, competitive landscapes, and emerging trends, offering actionable insights for industry stakeholders. The report covers key segments including beef, pork, mutton, and other meats, across various forms (canned, fresh/chilled, frozen, processed) and distribution channels (on-trade, off-trade). The total market value is projected to reach xx Million by 2033.
US Meat Market Concentration & Innovation
The US meat market exhibits a moderately concentrated structure, with a few major players holding significant market share. While exact figures are proprietary and require full report access, companies like Tyson Foods Inc, JBS SA, and Cargill Inc command considerable influence. Market share analysis within the report reveals significant variations across different meat types and processing forms.
Innovation is driven by consumer demand for healthier, more convenient, and sustainably produced meat products. This has led to increased investment in plant-based alternatives, improved processing technologies, and sustainable farming practices. The regulatory framework, including food safety regulations and labeling requirements, significantly influences innovation and operational strategies. Product substitutes, particularly plant-based meats, are gaining traction, presenting both challenges and opportunities for traditional meat producers. End-user trends, such as increasing demand for convenience foods and ethnic meat varieties, are shaping product development. Mergers and acquisitions (M&A) activities are another key factor, with recent deals totaling an estimated xx Million in value, primarily focused on enhancing supply chain control and expanding product portfolios. Examples include JBS SA's acquisition of TriOak Foods assets in December 2022.
US Meat Market Industry Trends & Insights
The US meat market is experiencing a period of significant transformation, driven by several key factors. The market is expected to witness a CAGR of xx% during the forecast period (2025-2033), fueled by factors such as rising disposable incomes, increasing urbanization, and changing consumer preferences. Technological disruptions, such as advancements in meat processing and packaging technologies, are improving efficiency and product quality. Consumer preferences are shifting towards healthier options, including leaner meats and organic products, which are influencing the market's product portfolio. Intense competition, both domestically and internationally, is putting pressure on pricing and profitability. Market penetration of specific meat types varies significantly, with beef consistently commanding a major share, while other niche segments showcase notable growth potential.
Dominant Markets & Segments in US Meat Market
Leading Region: The report indicates that the [Specific Region - e.g., Midwest] region dominates the US meat market due to a higher concentration of livestock production and processing facilities.
Dominant Meat Type: Beef consistently holds the largest market share among meat types, driven by strong consumer demand and established distribution networks. Pork and poultry also represent substantial segments.
Preferred Form: Fresh/chilled meat remains the most dominant form, followed by processed meat, driven by convenience and diverse product offerings.
Distribution Channel: The off-trade channel (retail stores, supermarkets) accounts for the lion's share of distribution, reflecting the dominant role of grocery retail.
Key drivers for regional dominance include favorable economic policies supporting livestock farming, well-developed infrastructure for transportation and logistics, and strong consumer purchasing power. The detailed analysis within the report illuminates the competitive landscape within each dominant segment, outlining the strategies adopted by key market players.
US Meat Market Product Developments
Recent product innovations emphasize convenience, health, and sustainability. This includes the rise of ready-to-cook meals, organic and grass-fed meat options, and value-added products incorporating ethnic flavors or tailored to specific dietary needs. Technological advancements, such as improved preservation techniques and efficient packaging solutions, are improving product shelf-life and enhancing consumer experience. These innovations are increasingly tailored to specific market segments and consumer preferences, driving competitive advantage within the increasingly sophisticated meat sector.
Report Scope & Segmentation Analysis
This report segments the US meat market across various dimensions:
By Type: Beef, Pork, Mutton, Other Meat (including poultry and seafood) - each segment detailed with individual market size and projected growth, competitive intensity and key trends.
By Form: Canned, Fresh/Chilled, Frozen, Processed - analysis includes the variations in pricing and consumer demand for each form, together with factors influencing market shares across time.
By Distribution Channel: On-Trade (restaurants, hotels), Off-Trade (retail stores, supermarkets) - evaluation assesses the current distribution patterns and future projections for each distribution pathway, highlighting growth drivers for each.
Each segment's analysis includes growth projections, current market size, and competitive dynamics, including market share distribution, pricing strategies, and product differentiation.
Key Drivers of US Meat Market Growth
Several factors propel the growth of the US meat market. Strong consumer demand, fueled by rising incomes and population growth, is a primary driver. Technological advancements, such as improved farming and processing techniques, increase production efficiency and improve product quality. Favorable government policies supporting the agricultural sector contribute to overall market expansion. Finally, changing consumer preferences, which lead to increasing demand for value-added products and convenient meal solutions, significantly impact growth patterns.
Challenges in the US Meat Market Sector
The US meat market faces several challenges. Stringent regulatory requirements regarding food safety and environmental protection can increase operational costs for producers. Fluctuations in livestock prices and feed costs impact profitability. Increasing competition from both domestic and international players puts pressure on margins. Supply chain disruptions, exacerbated by factors such as weather events and geopolitical instability, can affect availability and pricing. These challenges collectively impact the overall market dynamics and profit potential for producers and suppliers.
Emerging Opportunities in US Meat Market
Several opportunities exist for growth within the US meat market. The rising popularity of plant-based meat alternatives creates a demand for innovative hybrid products that combine plant-based and traditional meat components. The increasing demand for convenient and ready-to-eat meat products offers opportunities for value-added product development. Expanding into niche markets, such as organic, grass-fed, and locally sourced meat, can attract health-conscious consumers and support local agricultural businesses. These opportunities represent potential future growth areas for the dynamic US meat industry.
Leading Players in the US Meat Market Market
- WH Group Limited
- NH Foods Ltd
- Vion Group
- Tyson Foods Inc
- Conagra Brands Inc
- Sysco Corporation
- The Kraft Heinz Company
- Hormel Foods Corporation
- Cargill Inc
- Marfrig Global Foods S A
- The Clemens Family Corporation
- JBS SA
- OSI Group
Key Developments in US Meat Market Industry
November 2022: Conagra Brands, Inc. invested approximately USD 60 Million to expand its Troy, Ohio facility, increasing production capacity for Slim Jim products.
December 2022: JBS SA acquired certain assets from TriOak Foods, strengthening its pork supply chain.
April 2023: JBS USA's Swift Prepared Foods launched Principe Foods, producing high-quality Italian meats and charcuterie.
These developments highlight strategic investments in capacity expansion, supply chain consolidation, and diversification of product offerings within the US meat market.
Strategic Outlook for US Meat Market Market
The US meat market is poised for continued growth, driven by evolving consumer preferences, technological advancements, and strategic market positioning by key players. Opportunities lie in product diversification, exploring niche markets such as sustainable and organic meats, and leveraging technological innovations to enhance efficiency and product quality. Future market potential is strongly linked to successfully adapting to changing consumer demands while addressing challenges related to sustainability and food safety. The market's long-term prospects are positive, though subject to ongoing economic and geopolitical conditions.
US Meat Market Segmentation
-
1. Type
- 1.1. Beef
- 1.2. Mutton
- 1.3. Pork
- 1.4. Other Meat
-
2. Form
- 2.1. Canned
- 2.2. Fresh / Chilled
- 2.3. Frozen
- 2.4. Processed
-
3. Distribution Channel
-
3.1. Off-Trade
- 3.1.1. Convenience Stores
- 3.1.2. Online Channel
- 3.1.3. Supermarkets and Hypermarkets
- 3.1.4. Others
- 3.2. On-Trade
-
3.1. Off-Trade
US Meat Market Segmentation By Geography
-
1. North America
- 1.1. United States
- 1.2. Canada
- 1.3. Mexico
-
2. South America
- 2.1. Brazil
- 2.2. Argentina
- 2.3. Rest of South America
-
3. Europe
- 3.1. United Kingdom
- 3.2. Germany
- 3.3. France
- 3.4. Italy
- 3.5. Spain
- 3.6. Russia
- 3.7. Benelux
- 3.8. Nordics
- 3.9. Rest of Europe
-
4. Middle East & Africa
- 4.1. Turkey
- 4.2. Israel
- 4.3. GCC
- 4.4. North Africa
- 4.5. South Africa
- 4.6. Rest of Middle East & Africa
-
5. Asia Pacific
- 5.1. China
- 5.2. India
- 5.3. Japan
- 5.4. South Korea
- 5.5. ASEAN
- 5.6. Oceania
- 5.7. Rest of Asia Pacific
US Meat Market REPORT HIGHLIGHTS
| Aspects | Details |
|---|---|
| Study Period | 2019-2033 |
| Base Year | 2024 |
| Estimated Year | 2025 |
| Forecast Period | 2025-2033 |
| Historical Period | 2019-2024 |
| Growth Rate | CAGR of 6.42% from 2019-2033 |
| Segmentation |
|
Table of Contents
- 1. Introduction
- 1.1. Research Scope
- 1.2. Market Segmentation
- 1.3. Research Methodology
- 1.4. Definitions and Assumptions
- 2. Executive Summary
- 2.1. Introduction
- 3. Market Dynamics
- 3.1. Introduction
- 3.2. Market Drivers
- 3.2.1. Increasing Demand for Low-Fat and Low-Calorie Food; Increasing Product Innovation
- 3.3. Market Restrains
- 3.3.1. ; Threat of New Entrants; Bargaining Power of Buyers/Consumers; Bargaining Power of Suppliers; Threat of Substitute Products; Degree Of Competition
- 3.4. Market Trends
- 3.4.1. OTHER KEY INDUSTRY TRENDS COVERED IN THE REPORT
- 4. Market Factor Analysis
- 4.1. Porters Five Forces
- 4.2. Supply/Value Chain
- 4.3. PESTEL analysis
- 4.4. Market Entropy
- 4.5. Patent/Trademark Analysis
- 5. Global US Meat Market Analysis, Insights and Forecast, 2019-2031
- 5.1. Market Analysis, Insights and Forecast - by Type
- 5.1.1. Beef
- 5.1.2. Mutton
- 5.1.3. Pork
- 5.1.4. Other Meat
- 5.2. Market Analysis, Insights and Forecast - by Form
- 5.2.1. Canned
- 5.2.2. Fresh / Chilled
- 5.2.3. Frozen
- 5.2.4. Processed
- 5.3. Market Analysis, Insights and Forecast - by Distribution Channel
- 5.3.1. Off-Trade
- 5.3.1.1. Convenience Stores
- 5.3.1.2. Online Channel
- 5.3.1.3. Supermarkets and Hypermarkets
- 5.3.1.4. Others
- 5.3.2. On-Trade
- 5.3.1. Off-Trade
- 5.4. Market Analysis, Insights and Forecast - by Region
- 5.4.1. North America
- 5.4.2. South America
- 5.4.3. Europe
- 5.4.4. Middle East & Africa
- 5.4.5. Asia Pacific
- 5.1. Market Analysis, Insights and Forecast - by Type
- 6. North America US Meat Market Analysis, Insights and Forecast, 2019-2031
- 6.1. Market Analysis, Insights and Forecast - by Type
- 6.1.1. Beef
- 6.1.2. Mutton
- 6.1.3. Pork
- 6.1.4. Other Meat
- 6.2. Market Analysis, Insights and Forecast - by Form
- 6.2.1. Canned
- 6.2.2. Fresh / Chilled
- 6.2.3. Frozen
- 6.2.4. Processed
- 6.3. Market Analysis, Insights and Forecast - by Distribution Channel
- 6.3.1. Off-Trade
- 6.3.1.1. Convenience Stores
- 6.3.1.2. Online Channel
- 6.3.1.3. Supermarkets and Hypermarkets
- 6.3.1.4. Others
- 6.3.2. On-Trade
- 6.3.1. Off-Trade
- 6.1. Market Analysis, Insights and Forecast - by Type
- 7. South America US Meat Market Analysis, Insights and Forecast, 2019-2031
- 7.1. Market Analysis, Insights and Forecast - by Type
- 7.1.1. Beef
- 7.1.2. Mutton
- 7.1.3. Pork
- 7.1.4. Other Meat
- 7.2. Market Analysis, Insights and Forecast - by Form
- 7.2.1. Canned
- 7.2.2. Fresh / Chilled
- 7.2.3. Frozen
- 7.2.4. Processed
- 7.3. Market Analysis, Insights and Forecast - by Distribution Channel
- 7.3.1. Off-Trade
- 7.3.1.1. Convenience Stores
- 7.3.1.2. Online Channel
- 7.3.1.3. Supermarkets and Hypermarkets
- 7.3.1.4. Others
- 7.3.2. On-Trade
- 7.3.1. Off-Trade
- 7.1. Market Analysis, Insights and Forecast - by Type
- 8. Europe US Meat Market Analysis, Insights and Forecast, 2019-2031
- 8.1. Market Analysis, Insights and Forecast - by Type
- 8.1.1. Beef
- 8.1.2. Mutton
- 8.1.3. Pork
- 8.1.4. Other Meat
- 8.2. Market Analysis, Insights and Forecast - by Form
- 8.2.1. Canned
- 8.2.2. Fresh / Chilled
- 8.2.3. Frozen
- 8.2.4. Processed
- 8.3. Market Analysis, Insights and Forecast - by Distribution Channel
- 8.3.1. Off-Trade
- 8.3.1.1. Convenience Stores
- 8.3.1.2. Online Channel
- 8.3.1.3. Supermarkets and Hypermarkets
- 8.3.1.4. Others
- 8.3.2. On-Trade
- 8.3.1. Off-Trade
- 8.1. Market Analysis, Insights and Forecast - by Type
- 9. Middle East & Africa US Meat Market Analysis, Insights and Forecast, 2019-2031
- 9.1. Market Analysis, Insights and Forecast - by Type
- 9.1.1. Beef
- 9.1.2. Mutton
- 9.1.3. Pork
- 9.1.4. Other Meat
- 9.2. Market Analysis, Insights and Forecast - by Form
- 9.2.1. Canned
- 9.2.2. Fresh / Chilled
- 9.2.3. Frozen
- 9.2.4. Processed
- 9.3. Market Analysis, Insights and Forecast - by Distribution Channel
- 9.3.1. Off-Trade
- 9.3.1.1. Convenience Stores
- 9.3.1.2. Online Channel
- 9.3.1.3. Supermarkets and Hypermarkets
- 9.3.1.4. Others
- 9.3.2. On-Trade
- 9.3.1. Off-Trade
- 9.1. Market Analysis, Insights and Forecast - by Type
- 10. Asia Pacific US Meat Market Analysis, Insights and Forecast, 2019-2031
- 10.1. Market Analysis, Insights and Forecast - by Type
- 10.1.1. Beef
- 10.1.2. Mutton
- 10.1.3. Pork
- 10.1.4. Other Meat
- 10.2. Market Analysis, Insights and Forecast - by Form
- 10.2.1. Canned
- 10.2.2. Fresh / Chilled
- 10.2.3. Frozen
- 10.2.4. Processed
- 10.3. Market Analysis, Insights and Forecast - by Distribution Channel
- 10.3.1. Off-Trade
- 10.3.1.1. Convenience Stores
- 10.3.1.2. Online Channel
- 10.3.1.3. Supermarkets and Hypermarkets
- 10.3.1.4. Others
- 10.3.2. On-Trade
- 10.3.1. Off-Trade
- 10.1. Market Analysis, Insights and Forecast - by Type
- 11. Northeast US Meat Market Analysis, Insights and Forecast, 2019-2031
- 12. Southeast US Meat Market Analysis, Insights and Forecast, 2019-2031
- 13. Midwest US Meat Market Analysis, Insights and Forecast, 2019-2031
- 14. Southwest US Meat Market Analysis, Insights and Forecast, 2019-2031
- 15. West US Meat Market Analysis, Insights and Forecast, 2019-2031
- 16. Competitive Analysis
- 16.1. Global Market Share Analysis 2024
- 16.2. Company Profiles
- 16.2.1 WH Group Limite
- 16.2.1.1. Overview
- 16.2.1.2. Products
- 16.2.1.3. SWOT Analysis
- 16.2.1.4. Recent Developments
- 16.2.1.5. Financials (Based on Availability)
- 16.2.2 NH Foods Ltd
- 16.2.2.1. Overview
- 16.2.2.2. Products
- 16.2.2.3. SWOT Analysis
- 16.2.2.4. Recent Developments
- 16.2.2.5. Financials (Based on Availability)
- 16.2.3 Vion Group
- 16.2.3.1. Overview
- 16.2.3.2. Products
- 16.2.3.3. SWOT Analysis
- 16.2.3.4. Recent Developments
- 16.2.3.5. Financials (Based on Availability)
- 16.2.4 Tyson Foods Inc
- 16.2.4.1. Overview
- 16.2.4.2. Products
- 16.2.4.3. SWOT Analysis
- 16.2.4.4. Recent Developments
- 16.2.4.5. Financials (Based on Availability)
- 16.2.5 Conagra Brands Inc
- 16.2.5.1. Overview
- 16.2.5.2. Products
- 16.2.5.3. SWOT Analysis
- 16.2.5.4. Recent Developments
- 16.2.5.5. Financials (Based on Availability)
- 16.2.6 Sysco Corporation
- 16.2.6.1. Overview
- 16.2.6.2. Products
- 16.2.6.3. SWOT Analysis
- 16.2.6.4. Recent Developments
- 16.2.6.5. Financials (Based on Availability)
- 16.2.7 The Kraft Heinz Company
- 16.2.7.1. Overview
- 16.2.7.2. Products
- 16.2.7.3. SWOT Analysis
- 16.2.7.4. Recent Developments
- 16.2.7.5. Financials (Based on Availability)
- 16.2.8 Hormel Foods Corporation
- 16.2.8.1. Overview
- 16.2.8.2. Products
- 16.2.8.3. SWOT Analysis
- 16.2.8.4. Recent Developments
- 16.2.8.5. Financials (Based on Availability)
- 16.2.9 Cargill Inc
- 16.2.9.1. Overview
- 16.2.9.2. Products
- 16.2.9.3. SWOT Analysis
- 16.2.9.4. Recent Developments
- 16.2.9.5. Financials (Based on Availability)
- 16.2.10 Marfrig Global Foods S A
- 16.2.10.1. Overview
- 16.2.10.2. Products
- 16.2.10.3. SWOT Analysis
- 16.2.10.4. Recent Developments
- 16.2.10.5. Financials (Based on Availability)
- 16.2.11 The Clemens Family Corporation
- 16.2.11.1. Overview
- 16.2.11.2. Products
- 16.2.11.3. SWOT Analysis
- 16.2.11.4. Recent Developments
- 16.2.11.5. Financials (Based on Availability)
- 16.2.12 JBS SA
- 16.2.12.1. Overview
- 16.2.12.2. Products
- 16.2.12.3. SWOT Analysis
- 16.2.12.4. Recent Developments
- 16.2.12.5. Financials (Based on Availability)
- 16.2.13 OSI Group
- 16.2.13.1. Overview
- 16.2.13.2. Products
- 16.2.13.3. SWOT Analysis
- 16.2.13.4. Recent Developments
- 16.2.13.5. Financials (Based on Availability)
- 16.2.1 WH Group Limite
List of Figures
- Figure 1: Global US Meat Market Revenue Breakdown (Million, %) by Region 2024 & 2032
- Figure 2: United states US Meat Market Revenue (Million), by Country 2024 & 2032
- Figure 3: United states US Meat Market Revenue Share (%), by Country 2024 & 2032
- Figure 4: North America US Meat Market Revenue (Million), by Type 2024 & 2032
- Figure 5: North America US Meat Market Revenue Share (%), by Type 2024 & 2032
- Figure 6: North America US Meat Market Revenue (Million), by Form 2024 & 2032
- Figure 7: North America US Meat Market Revenue Share (%), by Form 2024 & 2032
- Figure 8: North America US Meat Market Revenue (Million), by Distribution Channel 2024 & 2032
- Figure 9: North America US Meat Market Revenue Share (%), by Distribution Channel 2024 & 2032
- Figure 10: North America US Meat Market Revenue (Million), by Country 2024 & 2032
- Figure 11: North America US Meat Market Revenue Share (%), by Country 2024 & 2032
- Figure 12: South America US Meat Market Revenue (Million), by Type 2024 & 2032
- Figure 13: South America US Meat Market Revenue Share (%), by Type 2024 & 2032
- Figure 14: South America US Meat Market Revenue (Million), by Form 2024 & 2032
- Figure 15: South America US Meat Market Revenue Share (%), by Form 2024 & 2032
- Figure 16: South America US Meat Market Revenue (Million), by Distribution Channel 2024 & 2032
- Figure 17: South America US Meat Market Revenue Share (%), by Distribution Channel 2024 & 2032
- Figure 18: South America US Meat Market Revenue (Million), by Country 2024 & 2032
- Figure 19: South America US Meat Market Revenue Share (%), by Country 2024 & 2032
- Figure 20: Europe US Meat Market Revenue (Million), by Type 2024 & 2032
- Figure 21: Europe US Meat Market Revenue Share (%), by Type 2024 & 2032
- Figure 22: Europe US Meat Market Revenue (Million), by Form 2024 & 2032
- Figure 23: Europe US Meat Market Revenue Share (%), by Form 2024 & 2032
- Figure 24: Europe US Meat Market Revenue (Million), by Distribution Channel 2024 & 2032
- Figure 25: Europe US Meat Market Revenue Share (%), by Distribution Channel 2024 & 2032
- Figure 26: Europe US Meat Market Revenue (Million), by Country 2024 & 2032
- Figure 27: Europe US Meat Market Revenue Share (%), by Country 2024 & 2032
- Figure 28: Middle East & Africa US Meat Market Revenue (Million), by Type 2024 & 2032
- Figure 29: Middle East & Africa US Meat Market Revenue Share (%), by Type 2024 & 2032
- Figure 30: Middle East & Africa US Meat Market Revenue (Million), by Form 2024 & 2032
- Figure 31: Middle East & Africa US Meat Market Revenue Share (%), by Form 2024 & 2032
- Figure 32: Middle East & Africa US Meat Market Revenue (Million), by Distribution Channel 2024 & 2032
- Figure 33: Middle East & Africa US Meat Market Revenue Share (%), by Distribution Channel 2024 & 2032
- Figure 34: Middle East & Africa US Meat Market Revenue (Million), by Country 2024 & 2032
- Figure 35: Middle East & Africa US Meat Market Revenue Share (%), by Country 2024 & 2032
- Figure 36: Asia Pacific US Meat Market Revenue (Million), by Type 2024 & 2032
- Figure 37: Asia Pacific US Meat Market Revenue Share (%), by Type 2024 & 2032
- Figure 38: Asia Pacific US Meat Market Revenue (Million), by Form 2024 & 2032
- Figure 39: Asia Pacific US Meat Market Revenue Share (%), by Form 2024 & 2032
- Figure 40: Asia Pacific US Meat Market Revenue (Million), by Distribution Channel 2024 & 2032
- Figure 41: Asia Pacific US Meat Market Revenue Share (%), by Distribution Channel 2024 & 2032
- Figure 42: Asia Pacific US Meat Market Revenue (Million), by Country 2024 & 2032
- Figure 43: Asia Pacific US Meat Market Revenue Share (%), by Country 2024 & 2032
List of Tables
- Table 1: Global US Meat Market Revenue Million Forecast, by Region 2019 & 2032
- Table 2: Global US Meat Market Revenue Million Forecast, by Type 2019 & 2032
- Table 3: Global US Meat Market Revenue Million Forecast, by Form 2019 & 2032
- Table 4: Global US Meat Market Revenue Million Forecast, by Distribution Channel 2019 & 2032
- Table 5: Global US Meat Market Revenue Million Forecast, by Region 2019 & 2032
- Table 6: Global US Meat Market Revenue Million Forecast, by Country 2019 & 2032
- Table 7: Northeast US Meat Market Revenue (Million) Forecast, by Application 2019 & 2032
- Table 8: Southeast US Meat Market Revenue (Million) Forecast, by Application 2019 & 2032
- Table 9: Midwest US Meat Market Revenue (Million) Forecast, by Application 2019 & 2032
- Table 10: Southwest US Meat Market Revenue (Million) Forecast, by Application 2019 & 2032
- Table 11: West US Meat Market Revenue (Million) Forecast, by Application 2019 & 2032
- Table 12: Global US Meat Market Revenue Million Forecast, by Type 2019 & 2032
- Table 13: Global US Meat Market Revenue Million Forecast, by Form 2019 & 2032
- Table 14: Global US Meat Market Revenue Million Forecast, by Distribution Channel 2019 & 2032
- Table 15: Global US Meat Market Revenue Million Forecast, by Country 2019 & 2032
- Table 16: United States US Meat Market Revenue (Million) Forecast, by Application 2019 & 2032
- Table 17: Canada US Meat Market Revenue (Million) Forecast, by Application 2019 & 2032
- Table 18: Mexico US Meat Market Revenue (Million) Forecast, by Application 2019 & 2032
- Table 19: Global US Meat Market Revenue Million Forecast, by Type 2019 & 2032
- Table 20: Global US Meat Market Revenue Million Forecast, by Form 2019 & 2032
- Table 21: Global US Meat Market Revenue Million Forecast, by Distribution Channel 2019 & 2032
- Table 22: Global US Meat Market Revenue Million Forecast, by Country 2019 & 2032
- Table 23: Brazil US Meat Market Revenue (Million) Forecast, by Application 2019 & 2032
- Table 24: Argentina US Meat Market Revenue (Million) Forecast, by Application 2019 & 2032
- Table 25: Rest of South America US Meat Market Revenue (Million) Forecast, by Application 2019 & 2032
- Table 26: Global US Meat Market Revenue Million Forecast, by Type 2019 & 2032
- Table 27: Global US Meat Market Revenue Million Forecast, by Form 2019 & 2032
- Table 28: Global US Meat Market Revenue Million Forecast, by Distribution Channel 2019 & 2032
- Table 29: Global US Meat Market Revenue Million Forecast, by Country 2019 & 2032
- Table 30: United Kingdom US Meat Market Revenue (Million) Forecast, by Application 2019 & 2032
- Table 31: Germany US Meat Market Revenue (Million) Forecast, by Application 2019 & 2032
- Table 32: France US Meat Market Revenue (Million) Forecast, by Application 2019 & 2032
- Table 33: Italy US Meat Market Revenue (Million) Forecast, by Application 2019 & 2032
- Table 34: Spain US Meat Market Revenue (Million) Forecast, by Application 2019 & 2032
- Table 35: Russia US Meat Market Revenue (Million) Forecast, by Application 2019 & 2032
- Table 36: Benelux US Meat Market Revenue (Million) Forecast, by Application 2019 & 2032
- Table 37: Nordics US Meat Market Revenue (Million) Forecast, by Application 2019 & 2032
- Table 38: Rest of Europe US Meat Market Revenue (Million) Forecast, by Application 2019 & 2032
- Table 39: Global US Meat Market Revenue Million Forecast, by Type 2019 & 2032
- Table 40: Global US Meat Market Revenue Million Forecast, by Form 2019 & 2032
- Table 41: Global US Meat Market Revenue Million Forecast, by Distribution Channel 2019 & 2032
- Table 42: Global US Meat Market Revenue Million Forecast, by Country 2019 & 2032
- Table 43: Turkey US Meat Market Revenue (Million) Forecast, by Application 2019 & 2032
- Table 44: Israel US Meat Market Revenue (Million) Forecast, by Application 2019 & 2032
- Table 45: GCC US Meat Market Revenue (Million) Forecast, by Application 2019 & 2032
- Table 46: North Africa US Meat Market Revenue (Million) Forecast, by Application 2019 & 2032
- Table 47: South Africa US Meat Market Revenue (Million) Forecast, by Application 2019 & 2032
- Table 48: Rest of Middle East & Africa US Meat Market Revenue (Million) Forecast, by Application 2019 & 2032
- Table 49: Global US Meat Market Revenue Million Forecast, by Type 2019 & 2032
- Table 50: Global US Meat Market Revenue Million Forecast, by Form 2019 & 2032
- Table 51: Global US Meat Market Revenue Million Forecast, by Distribution Channel 2019 & 2032
- Table 52: Global US Meat Market Revenue Million Forecast, by Country 2019 & 2032
- Table 53: China US Meat Market Revenue (Million) Forecast, by Application 2019 & 2032
- Table 54: India US Meat Market Revenue (Million) Forecast, by Application 2019 & 2032
- Table 55: Japan US Meat Market Revenue (Million) Forecast, by Application 2019 & 2032
- Table 56: South Korea US Meat Market Revenue (Million) Forecast, by Application 2019 & 2032
- Table 57: ASEAN US Meat Market Revenue (Million) Forecast, by Application 2019 & 2032
- Table 58: Oceania US Meat Market Revenue (Million) Forecast, by Application 2019 & 2032
- Table 59: Rest of Asia Pacific US Meat Market Revenue (Million) Forecast, by Application 2019 & 2032
Frequently Asked Questions
1. What is the projected Compound Annual Growth Rate (CAGR) of the US Meat Market?
The projected CAGR is approximately 6.42%.
2. Which companies are prominent players in the US Meat Market?
Key companies in the market include WH Group Limite, NH Foods Ltd, Vion Group, Tyson Foods Inc, Conagra Brands Inc, Sysco Corporation, The Kraft Heinz Company, Hormel Foods Corporation, Cargill Inc, Marfrig Global Foods S A, The Clemens Family Corporation, JBS SA, OSI Group.
3. What are the main segments of the US Meat Market?
The market segments include Type, Form, Distribution Channel.
4. Can you provide details about the market size?
The market size is estimated to be USD XX Million as of 2022.
5. What are some drivers contributing to market growth?
Increasing Demand for Low-Fat and Low-Calorie Food; Increasing Product Innovation.
6. What are the notable trends driving market growth?
OTHER KEY INDUSTRY TRENDS COVERED IN THE REPORT.
7. Are there any restraints impacting market growth?
; Threat of New Entrants; Bargaining Power of Buyers/Consumers; Bargaining Power of Suppliers; Threat of Substitute Products; Degree Of Competition.
8. Can you provide examples of recent developments in the market?
April 2023: Swift Prepared Food, a subsidiary of JBS USA, launched Principe Foods, which produces high-quality Italian meats and charcuterie.December 2022: JBS has acquired “certain assets” from US-based pork supplier TriOak Foods, strengthening its control over the supply chain.November 2022: Conagra Brands, Inc. has announced plans to invest about USD 60 million to expand the Troy facility's production capacity in Ohio, United States. Slim Jim products are mainly manufactured in the facility. Conagra stated that the 389,000 square foot plant will gain around 15,000 square feet as part of the expansion.
9. What pricing options are available for accessing the report?
Pricing options include single-user, multi-user, and enterprise licenses priced at USD 3800, USD 4500, and USD 5800 respectively.
10. Is the market size provided in terms of value or volume?
The market size is provided in terms of value, measured in Million.
11. Are there any specific market keywords associated with the report?
Yes, the market keyword associated with the report is "US Meat Market," which aids in identifying and referencing the specific market segment covered.
12. How do I determine which pricing option suits my needs best?
The pricing options vary based on user requirements and access needs. Individual users may opt for single-user licenses, while businesses requiring broader access may choose multi-user or enterprise licenses for cost-effective access to the report.
13. Are there any additional resources or data provided in the US Meat Market report?
While the report offers comprehensive insights, it's advisable to review the specific contents or supplementary materials provided to ascertain if additional resources or data are available.
14. How can I stay updated on further developments or reports in the US Meat Market?
To stay informed about further developments, trends, and reports in the US Meat Market, consider subscribing to industry newsletters, following relevant companies and organizations, or regularly checking reputable industry news sources and publications.
Methodology
Step 1 - Identification of Relevant Samples Size from Population Database


Step 2 - Approaches for Defining Global Market Size (Value, Volume* & Price*)

Note*: In applicable scenarios
Step 3 - Data Sources
Primary Research
- Web Analytics
- Survey Reports
- Research Institute
- Latest Research Reports
- Opinion Leaders
Secondary Research
- Annual Reports
- White Paper
- Latest Press Release
- Industry Association
- Paid Database
- Investor Presentations

Step 4 - Data Triangulation
Involves using different sources of information in order to increase the validity of a study
These sources are likely to be stakeholders in a program - participants, other researchers, program staff, other community members, and so on.
Then we put all data in single framework & apply various statistical tools to find out the dynamic on the market.
During the analysis stage, feedback from the stakeholder groups would be compared to determine areas of agreement as well as areas of divergence


