

Key Insights
The U.S. transformer market is projected for substantial growth, expected to reach $70.9 billion by 2025, expanding at a CAGR of 9.95%. Key growth drivers include critical infrastructure modernization, escalating electricity demand, and the robust integration of renewable energy sources. The ongoing necessity to replace aging equipment and bolster grid reliability to meet rising industrial and residential power needs are significant market tailwinds. Furthermore, the adoption of smart grid technologies and the deployment of higher-capacity, energy-efficient transformers to support the electrification of transportation and manufacturing sectors are anticipated to accelerate market expansion.
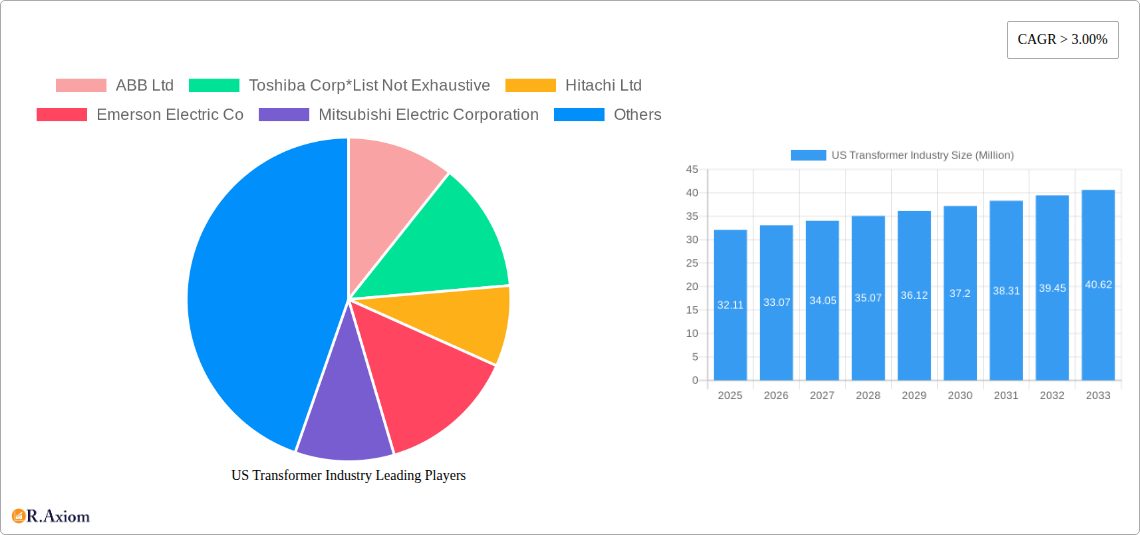
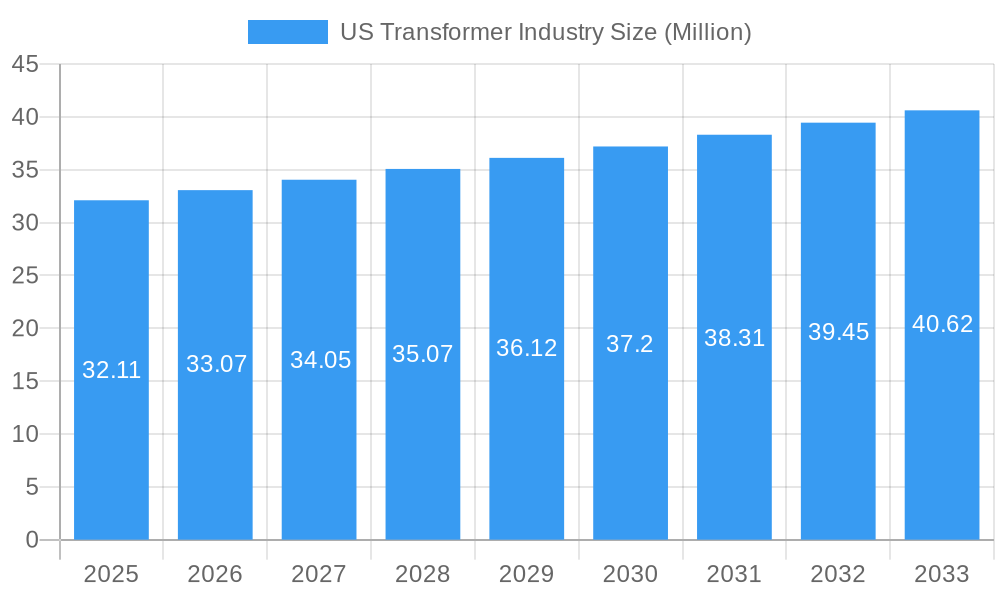
US Transformer Industry Market Size (In Billion)
Navigating challenges such as fluctuating raw material costs and intricate grid management is crucial for sustained market expansion. The sector is observing a strong trend toward advanced transformer designs featuring digital monitoring, superior insulation, and enhanced energy efficiency to minimize power loss. The drive for sustainable energy solutions, encompassing distributed generation and energy storage systems, necessitates innovative transformer technologies. While global supply chain volatility and substantial capital investment requirements present restraints, strategic collaborations and government initiatives focused on energy infrastructure modernization are poised to mitigate these hurdles, fostering a resilient and growing U.S. transformer market throughout the forecast period.
US Transformer Industry Company Market Share
US Transformer Industry Market Concentration & Innovation
The US transformer industry exhibits a moderate to high market concentration, with a few key global players dominating a significant portion of the market share. Leading companies such as Siemens AG, General Electric Company, ABB Ltd, and Hitachi Ltd collectively hold substantial sway, driven by their extensive product portfolios, advanced manufacturing capabilities, and established distribution networks. Innovation in this sector is primarily spurred by the relentless pursuit of energy efficiency, grid modernization, and the integration of renewable energy sources. The development of smart transformers, featuring advanced monitoring and control capabilities, is a significant innovation driver. Regulatory frameworks, particularly those set by the Department of Energy (DOE) and other environmental agencies, play a crucial role in shaping product development and adoption, encouraging the transition towards more sustainable and efficient transformer technologies. While direct product substitutes are limited due to the critical nature of transformers in power transmission and distribution, advancements in power electronics and distributed generation can indirectly influence demand. End-user trends are increasingly focused on enhanced grid reliability, reduced operational costs, and the ability to support fluctuating power loads from renewables and data centers. Mergers and acquisitions (M&A) activity, while not at an extremely high pace, contributes to market consolidation, with recent deal values focusing on acquiring advanced technological capabilities or expanding geographical reach. The market share of the top five players is estimated to be over 70%.
US Transformer Industry Industry Trends & Insights
The US transformer industry is poised for robust growth, driven by a confluence of critical factors including infrastructure upgrades, the accelerating adoption of renewable energy, and the burgeoning demand from the data center sector. The Compound Annual Growth Rate (CAGR) for the US transformer market is projected to be in the range of 5.5% to 7.0% over the forecast period (2025-2033). This growth is intrinsically linked to the need to replace aging grid infrastructure, much of which was installed decades ago and is nearing the end of its operational lifespan. Modernization efforts aim to enhance grid resilience, reduce transmission losses, and accommodate the increasing integration of intermittent renewable energy sources like solar and wind power. The expansion of electric vehicle (EV) charging infrastructure also necessitates a more robust and responsive power grid, driving demand for distribution and power transformers.
Technological disruptions are at the forefront of industry evolution. The shift towards dry-type transformers and advanced insulation materials is gaining traction due to their enhanced safety features, reduced environmental impact, and suitability for indoor applications. The development of smart transformers equipped with sensors, IoT capabilities, and predictive maintenance features is revolutionizing grid management by enabling real-time monitoring, fault detection, and optimized performance. This allows utilities to proactively address issues, minimize downtime, and improve overall grid efficiency. Furthermore, the increasing focus on high-voltage direct current (HVDC) transmission systems to transport power over long distances with minimal loss is creating new market opportunities for specialized transformers.
Consumer preferences within the utility sector are increasingly prioritizing reliability, sustainability, and cost-effectiveness. Utilities are seeking transformer solutions that offer longer lifespans, lower maintenance requirements, and a reduced environmental footprint. The energy efficiency criteria proposed by the US Department of Energy, aiming to increase the reliability of America's electrical system, lower utility costs, and reduce carbon emissions, will significantly influence consumer choices and manufacturer product development. Market penetration of advanced transformer technologies is expected to rise as these benefits become more pronounced and regulatory mandates evolve. The competitive landscape is characterized by a blend of established global giants and specialized domestic manufacturers, each vying for market share through technological innovation, product quality, and service offerings.
Dominant Markets & Segments in US Transformer Industry
Production Analysis:
The Midwest region of the United States historically holds a significant share in transformer production due to its robust industrial base, skilled workforce, and proximity to major manufacturing centers. States like Ohio, Illinois, and Michigan have a strong legacy in electrical equipment manufacturing. Key drivers for this dominance include established supply chains for raw materials such as copper and steel, availability of specialized engineering talent, and supportive state-level economic policies encouraging manufacturing. The production of power transformers (above 10 MVA) and distribution transformers (below 10 MVA) are the dominant sub-segments, catering to the vast needs of utility grids and industrial applications.
Consumption Analysis:
The Eastern and Southern United States are emerging as dominant consumption markets, driven by a combination of rapid population growth, substantial investments in renewable energy projects (particularly solar and offshore wind), and the expansion of the data center industry. States like Texas, Florida, and California are leading the charge in power consumption and, consequently, transformer demand. Economic policies promoting renewable energy adoption, federal incentives for grid modernization, and the strategic positioning of these regions for energy infrastructure development are key drivers. The consumption of distribution transformers is particularly high due to the widespread need for voltage regulation in urban and suburban areas, while the demand for larger power transformers is escalating with the integration of utility-scale renewable power plants.
Import Market Analysis (Value & Volume):
The import market for transformers in the US is primarily characterized by the influx of specialized transformers and those where domestic production capacity might be strained or less cost-competitive. Key import origins include Asia (particularly China and South Korea) for certain types of distribution transformers and components, and Europe for high-end, large power transformers with specific technological advancements. The volume of imports can fluctuate based on global supply chain dynamics and domestic manufacturing output. Factors influencing import reliance include the availability of specific raw materials, manufacturing cost differentials, and lead times for custom-built transformers. The value of imports is often higher for specialized or large-scale power transformers.
Export Market Analysis (Value & Volume):
The US transformer industry is also a significant exporter, particularly of high-quality, technologically advanced power transformers and specialized components. Key export destinations include Canada, Mexico, and select South American countries, where there is a demand for reliable grid infrastructure and growing industrial sectors. The value of exports is generally higher due to the emphasis on premium products and technology. Drivers for export growth include the reputation of American engineering, the adoption of stringent quality standards, and the need for specialized transformers for infrastructure projects in developing economies. Volume-wise, exports might be lower than imports, but the higher value per unit reflects the sophistication of US-manufactured transformers.
Price Trend Analysis:
Price trends in the US transformer market are significantly influenced by the cost of raw materials, primarily copper and electrical steel (silicon steel). Fluctuations in global commodity prices directly impact manufacturing costs and, consequently, transformer prices. The demand-supply balance also plays a crucial role; periods of high demand, especially driven by large infrastructure projects or a surge in renewable energy installations, tend to push prices upwards. Furthermore, regulatory changes mandating higher efficiency standards or the use of specific materials can also lead to price adjustments, as manufacturers invest in new technologies and processes. The increasing complexity of smart transformers, with integrated digital components, also contributes to a higher price point compared to conventional units. The forecast for price trends indicates a moderate upward trajectory, driven by raw material costs and increasing demand for advanced, high-efficiency units.
US Transformer Industry Product Developments
The US transformer industry is witnessing significant product developments focused on enhancing energy efficiency, improving grid reliability, and accommodating the integration of renewable energy sources. Innovations include the widespread adoption of amorphous core and advanced silicon steel designs to minimize core losses, leading to substantial energy savings. The development of smart transformers with integrated sensors, digital communication, and IoT capabilities allows for real-time monitoring, diagnostics, and predictive maintenance, optimizing grid operations. Furthermore, advancements in insulation materials and cooling technologies are enabling the creation of more compact, lightweight, and environmentally friendly transformers, particularly dry-type variants suitable for sensitive indoor environments. The market is also seeing increased demand for modular and scalable transformer solutions designed to efficiently integrate distributed energy resources (DERs) and support the rapidly expanding EV charging infrastructure. These developments collectively aim to reduce operational costs, enhance grid stability, and contribute to a more sustainable energy future.
Report Scope & Segmentation Analysis
This report provides a comprehensive analysis of the US transformer industry, covering the historical period from 2019 to 2024, with a base year of 2025 and a forecast period extending to 2033. The market is segmented across several key dimensions. Production Analysis examines the manufacturing landscape, identifying key production hubs and capacities. Consumption Analysis delves into the demand side, segmenting by end-use industries and geographical regions. Import Market Analysis and Export Market Analysis detail the value and volume of international trade in transformers, highlighting key trading partners and product categories. Price Trend Analysis forecasts price movements based on raw material costs, demand dynamics, and technological advancements. Each segment's growth projections and competitive dynamics are assessed to provide a holistic view of the market.
Key Drivers of US Transformer Industry Growth
The growth of the US transformer industry is propelled by several interconnected drivers. Infrastructure modernization and grid upgrades are paramount, as aging electrical grids require substantial investment to enhance reliability and capacity. The accelerating integration of renewable energy sources, such as solar and wind power, necessitates new and upgraded transformers to manage intermittent power flows and grid stability. The burgeoning data center industry, with its immense power consumption, is another significant demand driver. Furthermore, government initiatives promoting energy efficiency and clean energy adoption, coupled with the expanding electric vehicle (EV) charging infrastructure, are creating sustained demand for transformers. Technological advancements, particularly in smart grid technologies and efficient transformer designs, are also fostering market expansion by offering enhanced performance and cost savings.
Challenges in the US Transformer Industry Sector
Despite robust growth prospects, the US transformer industry faces several significant challenges. Supply chain disruptions, exacerbated by geopolitical factors and raw material volatility, can lead to increased lead times and higher manufacturing costs, particularly for critical components like specialized alloys and winding materials. Skilled labor shortages in manufacturing and engineering pose a barrier to meeting the escalating demand. The increasing complexity of regulatory frameworks, while driving innovation, also adds to compliance costs and can slow down product development cycles. Intense global competition from manufacturers with lower cost structures presents a constant pressure on pricing and market share. Furthermore, the aging workforce in the utility sector and the need for specialized training to manage advanced transformer technologies represent an ongoing challenge.
Emerging Opportunities in US Transformer Industry
Emerging opportunities within the US transformer industry are diverse and promising. The continued build-out of renewable energy infrastructure, including solar farms, wind turbines, and offshore wind projects, will drive demand for large power transformers and specialized grid connection equipment. The rapid expansion of the data center market, fueled by cloud computing and AI, presents a substantial opportunity for high-capacity and efficient transformers. The ongoing transition to smart grids is creating a significant market for transformers with integrated digital capabilities, enabling advanced monitoring, control, and predictive maintenance. Furthermore, the increasing adoption of electric vehicles will spur demand for transformers supporting charging infrastructure and grid upgrades. Finally, government incentives and policies supporting domestic manufacturing and energy independence present a favorable environment for market growth.
Leading Players in the US Transformer Industry Market
- ABB Ltd
- Toshiba Corp
- Hitachi Ltd
- Emerson Electric Co
- Mitsubishi Electric Corporation
- Siemens AG
- Schneider Electric SE
- Eaton Corporation PLC
- General Electric Company
- Panasonic Corporation
Key Developments in US Transformer Industry Industry
- December 2022: Hitachi Energy announced plans to invest more than USD 37 million in the expansion and modernization of its power transformer manufacturing facility in South Boston, Virginia, to meet rapidly growing demand from utility customers and for applications such as renewable energy generation and data centers.
- December 2022: The United States Department of Energy (DOE) proposed new energy-efficiency criteria for three types of distribution transformers to increase the reliability of America's electrical system, lower utility costs, and considerably reduce domestic carbon dioxide (CO2) emissions. The DOE plan is a strategic step towards the diversification of transformer core technology, which will save energy and lower prices.
Strategic Outlook for US Transformer Industry Market
The strategic outlook for the US transformer industry is exceptionally positive, driven by long-term secular trends. The critical need for grid modernization, coupled with the aggressive push for renewable energy integration and the insatiable demand from the data center sector, forms a robust foundation for sustained growth. Investments in advanced manufacturing capabilities and the development of smart, energy-efficient transformers will be crucial for market leaders to capitalize on these opportunities. Proactive engagement with regulatory bodies to influence and adapt to evolving energy efficiency standards will be key. Furthermore, fostering strategic partnerships and exploring M&A activities to acquire new technologies or expand market reach will be vital for navigating the competitive landscape and securing future market share in this essential and dynamic industry.
US Transformer Industry Segmentation
- 1. Production Analysis
- 2. Consumption Analysis
- 3. Import Market Analysis (Value & Volume)
- 4. Export Market Analysis (Value & Volume)
- 5. Price Trend Analysis
US Transformer Industry Segmentation By Geography
-
1. North America
- 1.1. United States
- 1.2. Canada
- 1.3. Mexico
-
2. South America
- 2.1. Brazil
- 2.2. Argentina
- 2.3. Rest of South America
-
3. Europe
- 3.1. United Kingdom
- 3.2. Germany
- 3.3. France
- 3.4. Italy
- 3.5. Spain
- 3.6. Russia
- 3.7. Benelux
- 3.8. Nordics
- 3.9. Rest of Europe
-
4. Middle East & Africa
- 4.1. Turkey
- 4.2. Israel
- 4.3. GCC
- 4.4. North Africa
- 4.5. South Africa
- 4.6. Rest of Middle East & Africa
-
5. Asia Pacific
- 5.1. China
- 5.2. India
- 5.3. Japan
- 5.4. South Korea
- 5.5. ASEAN
- 5.6. Oceania
- 5.7. Rest of Asia Pacific
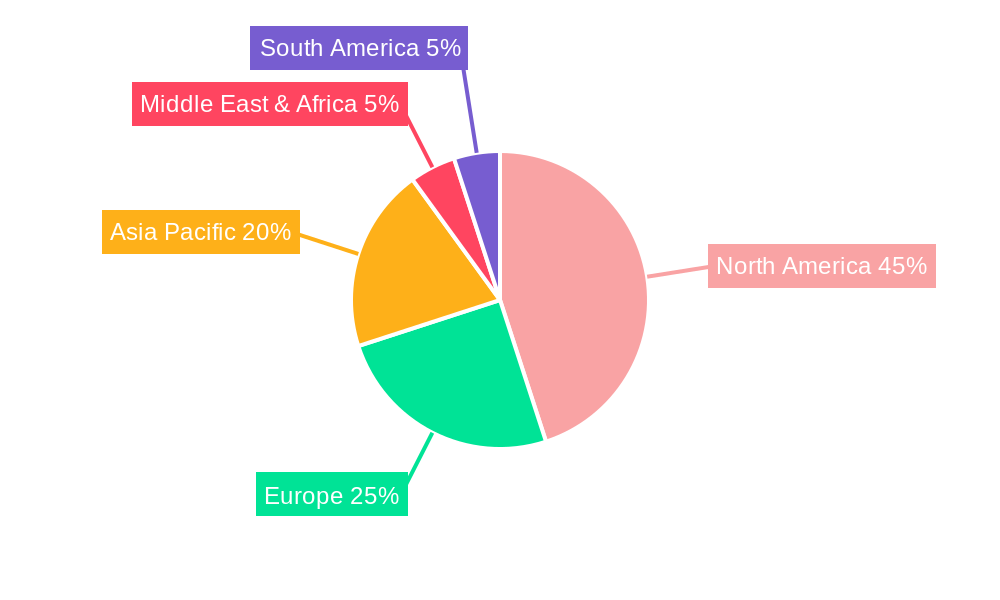
US Transformer Industry Regional Market Share
Geographic Coverage of US Transformer Industry
US Transformer Industry REPORT HIGHLIGHTS
| Aspects | Details |
|---|---|
| Study Period | 2020-2034 |
| Base Year | 2025 |
| Estimated Year | 2026 |
| Forecast Period | 2026-2034 |
| Historical Period | 2020-2025 |
| Growth Rate | CAGR of 9.95% from 2020-2034 |
| Segmentation |
|
Table of Contents
- 1. Introduction
- 1.1. Research Scope
- 1.2. Market Segmentation
- 1.3. Research Objective
- 1.4. Definitions and Assumptions
- 2. Executive Summary
- 2.1. Market Snapshot
- 3. Market Dynamics
- 3.1. Market Drivers
- 3.2. Market Restrains
- 3.3. Market Trends
- 3.4. Market Opportunities
- 4. Market Factor Analysis
- 4.1. Porters Five Forces
- 4.1.1. Bargaining Power of Suppliers
- 4.1.2. Bargaining Power of Buyers
- 4.1.3. Threat of New Entrants
- 4.1.4. Threat of Substitutes
- 4.1.5. Competitive Rivalry
- 4.2. PESTEL analysis
- 4.3. BCG Analysis
- 4.3.1. Stars (High Growth, High Market Share)
- 4.3.2. Cash Cows (Low Growth, High Market Share)
- 4.3.3. Question Mark (High Growth, Low Market Share)
- 4.3.4. Dogs (Low Growth, Low Market Share)
- 4.4. Ansoff Matrix Analysis
- 4.5. Supply Chain Analysis
- 4.6. Regulatory Landscape
- 4.7. Current Market Potential and Opportunity Assessment (TAM–SAM–SOM Framework)
- 4.8. RAX Analyst Note
- 4.1. Porters Five Forces
- 5. Market Analysis, Insights and Forecast 2021-2033
- 5.1. Market Analysis, Insights and Forecast - by Production Analysis
- 5.2. Market Analysis, Insights and Forecast - by Consumption Analysis
- 5.3. Market Analysis, Insights and Forecast - by Import Market Analysis (Value & Volume)
- 5.4. Market Analysis, Insights and Forecast - by Export Market Analysis (Value & Volume)
- 5.5. Market Analysis, Insights and Forecast - by Price Trend Analysis
- 5.6. Market Analysis, Insights and Forecast - by Region
- 5.6.1. North America
- 5.6.2. South America
- 5.6.3. Europe
- 5.6.4. Middle East & Africa
- 5.6.5. Asia Pacific
- 6. Global US Transformer Industry Analysis, Insights and Forecast, 2021-2033
- 6.1. Market Analysis, Insights and Forecast - by Production Analysis
- 6.2. Market Analysis, Insights and Forecast - by Consumption Analysis
- 6.3. Market Analysis, Insights and Forecast - by Import Market Analysis (Value & Volume)
- 6.4. Market Analysis, Insights and Forecast - by Export Market Analysis (Value & Volume)
- 6.5. Market Analysis, Insights and Forecast - by Price Trend Analysis
- 7. North America US Transformer Industry Analysis, Insights and Forecast, 2020-2032
- 7.1. Market Analysis, Insights and Forecast - by Production Analysis
- 7.2. Market Analysis, Insights and Forecast - by Consumption Analysis
- 7.3. Market Analysis, Insights and Forecast - by Import Market Analysis (Value & Volume)
- 7.4. Market Analysis, Insights and Forecast - by Export Market Analysis (Value & Volume)
- 7.5. Market Analysis, Insights and Forecast - by Price Trend Analysis
- 8. South America US Transformer Industry Analysis, Insights and Forecast, 2020-2032
- 8.1. Market Analysis, Insights and Forecast - by Production Analysis
- 8.2. Market Analysis, Insights and Forecast - by Consumption Analysis
- 8.3. Market Analysis, Insights and Forecast - by Import Market Analysis (Value & Volume)
- 8.4. Market Analysis, Insights and Forecast - by Export Market Analysis (Value & Volume)
- 8.5. Market Analysis, Insights and Forecast - by Price Trend Analysis
- 9. Europe US Transformer Industry Analysis, Insights and Forecast, 2020-2032
- 9.1. Market Analysis, Insights and Forecast - by Production Analysis
- 9.2. Market Analysis, Insights and Forecast - by Consumption Analysis
- 9.3. Market Analysis, Insights and Forecast - by Import Market Analysis (Value & Volume)
- 9.4. Market Analysis, Insights and Forecast - by Export Market Analysis (Value & Volume)
- 9.5. Market Analysis, Insights and Forecast - by Price Trend Analysis
- 10. Middle East & Africa US Transformer Industry Analysis, Insights and Forecast, 2020-2032
- 10.1. Market Analysis, Insights and Forecast - by Production Analysis
- 10.2. Market Analysis, Insights and Forecast - by Consumption Analysis
- 10.3. Market Analysis, Insights and Forecast - by Import Market Analysis (Value & Volume)
- 10.4. Market Analysis, Insights and Forecast - by Export Market Analysis (Value & Volume)
- 10.5. Market Analysis, Insights and Forecast - by Price Trend Analysis
- 11. Asia Pacific US Transformer Industry Analysis, Insights and Forecast, 2020-2032
- 11.1. Market Analysis, Insights and Forecast - by Production Analysis
- 11.2. Market Analysis, Insights and Forecast - by Consumption Analysis
- 11.3. Market Analysis, Insights and Forecast - by Import Market Analysis (Value & Volume)
- 11.4. Market Analysis, Insights and Forecast - by Export Market Analysis (Value & Volume)
- 11.5. Market Analysis, Insights and Forecast - by Price Trend Analysis
- 12. Competitive Analysis
- 12.1. Company Profiles
- 12.1.1 ABB Ltd
- 12.1.1.1. Company Overview
- 12.1.1.2. Products
- 12.1.1.3. Company Financials
- 12.1.1.4. SWOT Analysis
- 12.1.2 Toshiba Corp*List Not Exhaustive
- 12.1.2.1. Company Overview
- 12.1.2.2. Products
- 12.1.2.3. Company Financials
- 12.1.2.4. SWOT Analysis
- 12.1.3 Hitachi Ltd
- 12.1.3.1. Company Overview
- 12.1.3.2. Products
- 12.1.3.3. Company Financials
- 12.1.3.4. SWOT Analysis
- 12.1.4 Emerson Electric Co
- 12.1.4.1. Company Overview
- 12.1.4.2. Products
- 12.1.4.3. Company Financials
- 12.1.4.4. SWOT Analysis
- 12.1.5 Mitsubishi Electric Corporation
- 12.1.5.1. Company Overview
- 12.1.5.2. Products
- 12.1.5.3. Company Financials
- 12.1.5.4. SWOT Analysis
- 12.1.6 Siemens AG
- 12.1.6.1. Company Overview
- 12.1.6.2. Products
- 12.1.6.3. Company Financials
- 12.1.6.4. SWOT Analysis
- 12.1.7 Schneider Electric SE
- 12.1.7.1. Company Overview
- 12.1.7.2. Products
- 12.1.7.3. Company Financials
- 12.1.7.4. SWOT Analysis
- 12.1.8 Eaton Corporation PLC
- 12.1.8.1. Company Overview
- 12.1.8.2. Products
- 12.1.8.3. Company Financials
- 12.1.8.4. SWOT Analysis
- 12.1.9 General Electric Company
- 12.1.9.1. Company Overview
- 12.1.9.2. Products
- 12.1.9.3. Company Financials
- 12.1.9.4. SWOT Analysis
- 12.1.10 Panasonic Corporation
- 12.1.10.1. Company Overview
- 12.1.10.2. Products
- 12.1.10.3. Company Financials
- 12.1.10.4. SWOT Analysis
- 12.1.1 ABB Ltd
- 12.2. Market Entropy
- 12.2.1 Company's Key Areas Served
- 12.2.2 Recent Developments
- 12.3. Company Market Share Analysis 2025
- 12.3.1 Top 5 Companies Market Share Analysis
- 12.3.2 Top 3 Companies Market Share Analysis
- 12.4. List of Potential Customers
- 13. Research Methodology
List of Figures
- Figure 1: Global US Transformer Industry Revenue Breakdown (billion, %) by Region 2025 & 2033
- Figure 2: North America US Transformer Industry Revenue (billion), by Production Analysis 2025 & 2033
- Figure 3: North America US Transformer Industry Revenue Share (%), by Production Analysis 2025 & 2033
- Figure 4: North America US Transformer Industry Revenue (billion), by Consumption Analysis 2025 & 2033
- Figure 5: North America US Transformer Industry Revenue Share (%), by Consumption Analysis 2025 & 2033
- Figure 6: North America US Transformer Industry Revenue (billion), by Import Market Analysis (Value & Volume) 2025 & 2033
- Figure 7: North America US Transformer Industry Revenue Share (%), by Import Market Analysis (Value & Volume) 2025 & 2033
- Figure 8: North America US Transformer Industry Revenue (billion), by Export Market Analysis (Value & Volume) 2025 & 2033
- Figure 9: North America US Transformer Industry Revenue Share (%), by Export Market Analysis (Value & Volume) 2025 & 2033
- Figure 10: North America US Transformer Industry Revenue (billion), by Price Trend Analysis 2025 & 2033
- Figure 11: North America US Transformer Industry Revenue Share (%), by Price Trend Analysis 2025 & 2033
- Figure 12: North America US Transformer Industry Revenue (billion), by Country 2025 & 2033
- Figure 13: North America US Transformer Industry Revenue Share (%), by Country 2025 & 2033
- Figure 14: South America US Transformer Industry Revenue (billion), by Production Analysis 2025 & 2033
- Figure 15: South America US Transformer Industry Revenue Share (%), by Production Analysis 2025 & 2033
- Figure 16: South America US Transformer Industry Revenue (billion), by Consumption Analysis 2025 & 2033
- Figure 17: South America US Transformer Industry Revenue Share (%), by Consumption Analysis 2025 & 2033
- Figure 18: South America US Transformer Industry Revenue (billion), by Import Market Analysis (Value & Volume) 2025 & 2033
- Figure 19: South America US Transformer Industry Revenue Share (%), by Import Market Analysis (Value & Volume) 2025 & 2033
- Figure 20: South America US Transformer Industry Revenue (billion), by Export Market Analysis (Value & Volume) 2025 & 2033
- Figure 21: South America US Transformer Industry Revenue Share (%), by Export Market Analysis (Value & Volume) 2025 & 2033
- Figure 22: South America US Transformer Industry Revenue (billion), by Price Trend Analysis 2025 & 2033
- Figure 23: South America US Transformer Industry Revenue Share (%), by Price Trend Analysis 2025 & 2033
- Figure 24: South America US Transformer Industry Revenue (billion), by Country 2025 & 2033
- Figure 25: South America US Transformer Industry Revenue Share (%), by Country 2025 & 2033
- Figure 26: Europe US Transformer Industry Revenue (billion), by Production Analysis 2025 & 2033
- Figure 27: Europe US Transformer Industry Revenue Share (%), by Production Analysis 2025 & 2033
- Figure 28: Europe US Transformer Industry Revenue (billion), by Consumption Analysis 2025 & 2033
- Figure 29: Europe US Transformer Industry Revenue Share (%), by Consumption Analysis 2025 & 2033
- Figure 30: Europe US Transformer Industry Revenue (billion), by Import Market Analysis (Value & Volume) 2025 & 2033
- Figure 31: Europe US Transformer Industry Revenue Share (%), by Import Market Analysis (Value & Volume) 2025 & 2033
- Figure 32: Europe US Transformer Industry Revenue (billion), by Export Market Analysis (Value & Volume) 2025 & 2033
- Figure 33: Europe US Transformer Industry Revenue Share (%), by Export Market Analysis (Value & Volume) 2025 & 2033
- Figure 34: Europe US Transformer Industry Revenue (billion), by Price Trend Analysis 2025 & 2033
- Figure 35: Europe US Transformer Industry Revenue Share (%), by Price Trend Analysis 2025 & 2033
- Figure 36: Europe US Transformer Industry Revenue (billion), by Country 2025 & 2033
- Figure 37: Europe US Transformer Industry Revenue Share (%), by Country 2025 & 2033
- Figure 38: Middle East & Africa US Transformer Industry Revenue (billion), by Production Analysis 2025 & 2033
- Figure 39: Middle East & Africa US Transformer Industry Revenue Share (%), by Production Analysis 2025 & 2033
- Figure 40: Middle East & Africa US Transformer Industry Revenue (billion), by Consumption Analysis 2025 & 2033
- Figure 41: Middle East & Africa US Transformer Industry Revenue Share (%), by Consumption Analysis 2025 & 2033
- Figure 42: Middle East & Africa US Transformer Industry Revenue (billion), by Import Market Analysis (Value & Volume) 2025 & 2033
- Figure 43: Middle East & Africa US Transformer Industry Revenue Share (%), by Import Market Analysis (Value & Volume) 2025 & 2033
- Figure 44: Middle East & Africa US Transformer Industry Revenue (billion), by Export Market Analysis (Value & Volume) 2025 & 2033
- Figure 45: Middle East & Africa US Transformer Industry Revenue Share (%), by Export Market Analysis (Value & Volume) 2025 & 2033
- Figure 46: Middle East & Africa US Transformer Industry Revenue (billion), by Price Trend Analysis 2025 & 2033
- Figure 47: Middle East & Africa US Transformer Industry Revenue Share (%), by Price Trend Analysis 2025 & 2033
- Figure 48: Middle East & Africa US Transformer Industry Revenue (billion), by Country 2025 & 2033
- Figure 49: Middle East & Africa US Transformer Industry Revenue Share (%), by Country 2025 & 2033
- Figure 50: Asia Pacific US Transformer Industry Revenue (billion), by Production Analysis 2025 & 2033
- Figure 51: Asia Pacific US Transformer Industry Revenue Share (%), by Production Analysis 2025 & 2033
- Figure 52: Asia Pacific US Transformer Industry Revenue (billion), by Consumption Analysis 2025 & 2033
- Figure 53: Asia Pacific US Transformer Industry Revenue Share (%), by Consumption Analysis 2025 & 2033
- Figure 54: Asia Pacific US Transformer Industry Revenue (billion), by Import Market Analysis (Value & Volume) 2025 & 2033
- Figure 55: Asia Pacific US Transformer Industry Revenue Share (%), by Import Market Analysis (Value & Volume) 2025 & 2033
- Figure 56: Asia Pacific US Transformer Industry Revenue (billion), by Export Market Analysis (Value & Volume) 2025 & 2033
- Figure 57: Asia Pacific US Transformer Industry Revenue Share (%), by Export Market Analysis (Value & Volume) 2025 & 2033
- Figure 58: Asia Pacific US Transformer Industry Revenue (billion), by Price Trend Analysis 2025 & 2033
- Figure 59: Asia Pacific US Transformer Industry Revenue Share (%), by Price Trend Analysis 2025 & 2033
- Figure 60: Asia Pacific US Transformer Industry Revenue (billion), by Country 2025 & 2033
- Figure 61: Asia Pacific US Transformer Industry Revenue Share (%), by Country 2025 & 2033
List of Tables
- Table 1: Global US Transformer Industry Revenue billion Forecast, by Production Analysis 2020 & 2033
- Table 2: Global US Transformer Industry Revenue billion Forecast, by Consumption Analysis 2020 & 2033
- Table 3: Global US Transformer Industry Revenue billion Forecast, by Import Market Analysis (Value & Volume) 2020 & 2033
- Table 4: Global US Transformer Industry Revenue billion Forecast, by Export Market Analysis (Value & Volume) 2020 & 2033
- Table 5: Global US Transformer Industry Revenue billion Forecast, by Price Trend Analysis 2020 & 2033
- Table 6: Global US Transformer Industry Revenue billion Forecast, by Region 2020 & 2033
- Table 7: Global US Transformer Industry Revenue billion Forecast, by Production Analysis 2020 & 2033
- Table 8: Global US Transformer Industry Revenue billion Forecast, by Consumption Analysis 2020 & 2033
- Table 9: Global US Transformer Industry Revenue billion Forecast, by Import Market Analysis (Value & Volume) 2020 & 2033
- Table 10: Global US Transformer Industry Revenue billion Forecast, by Export Market Analysis (Value & Volume) 2020 & 2033
- Table 11: Global US Transformer Industry Revenue billion Forecast, by Price Trend Analysis 2020 & 2033
- Table 12: Global US Transformer Industry Revenue billion Forecast, by Country 2020 & 2033
- Table 13: United States US Transformer Industry Revenue (billion) Forecast, by Application 2020 & 2033
- Table 14: Canada US Transformer Industry Revenue (billion) Forecast, by Application 2020 & 2033
- Table 15: Mexico US Transformer Industry Revenue (billion) Forecast, by Application 2020 & 2033
- Table 16: Global US Transformer Industry Revenue billion Forecast, by Production Analysis 2020 & 2033
- Table 17: Global US Transformer Industry Revenue billion Forecast, by Consumption Analysis 2020 & 2033
- Table 18: Global US Transformer Industry Revenue billion Forecast, by Import Market Analysis (Value & Volume) 2020 & 2033
- Table 19: Global US Transformer Industry Revenue billion Forecast, by Export Market Analysis (Value & Volume) 2020 & 2033
- Table 20: Global US Transformer Industry Revenue billion Forecast, by Price Trend Analysis 2020 & 2033
- Table 21: Global US Transformer Industry Revenue billion Forecast, by Country 2020 & 2033
- Table 22: Brazil US Transformer Industry Revenue (billion) Forecast, by Application 2020 & 2033
- Table 23: Argentina US Transformer Industry Revenue (billion) Forecast, by Application 2020 & 2033
- Table 24: Rest of South America US Transformer Industry Revenue (billion) Forecast, by Application 2020 & 2033
- Table 25: Global US Transformer Industry Revenue billion Forecast, by Production Analysis 2020 & 2033
- Table 26: Global US Transformer Industry Revenue billion Forecast, by Consumption Analysis 2020 & 2033
- Table 27: Global US Transformer Industry Revenue billion Forecast, by Import Market Analysis (Value & Volume) 2020 & 2033
- Table 28: Global US Transformer Industry Revenue billion Forecast, by Export Market Analysis (Value & Volume) 2020 & 2033
- Table 29: Global US Transformer Industry Revenue billion Forecast, by Price Trend Analysis 2020 & 2033
- Table 30: Global US Transformer Industry Revenue billion Forecast, by Country 2020 & 2033
- Table 31: United Kingdom US Transformer Industry Revenue (billion) Forecast, by Application 2020 & 2033
- Table 32: Germany US Transformer Industry Revenue (billion) Forecast, by Application 2020 & 2033
- Table 33: France US Transformer Industry Revenue (billion) Forecast, by Application 2020 & 2033
- Table 34: Italy US Transformer Industry Revenue (billion) Forecast, by Application 2020 & 2033
- Table 35: Spain US Transformer Industry Revenue (billion) Forecast, by Application 2020 & 2033
- Table 36: Russia US Transformer Industry Revenue (billion) Forecast, by Application 2020 & 2033
- Table 37: Benelux US Transformer Industry Revenue (billion) Forecast, by Application 2020 & 2033
- Table 38: Nordics US Transformer Industry Revenue (billion) Forecast, by Application 2020 & 2033
- Table 39: Rest of Europe US Transformer Industry Revenue (billion) Forecast, by Application 2020 & 2033
- Table 40: Global US Transformer Industry Revenue billion Forecast, by Production Analysis 2020 & 2033
- Table 41: Global US Transformer Industry Revenue billion Forecast, by Consumption Analysis 2020 & 2033
- Table 42: Global US Transformer Industry Revenue billion Forecast, by Import Market Analysis (Value & Volume) 2020 & 2033
- Table 43: Global US Transformer Industry Revenue billion Forecast, by Export Market Analysis (Value & Volume) 2020 & 2033
- Table 44: Global US Transformer Industry Revenue billion Forecast, by Price Trend Analysis 2020 & 2033
- Table 45: Global US Transformer Industry Revenue billion Forecast, by Country 2020 & 2033
- Table 46: Turkey US Transformer Industry Revenue (billion) Forecast, by Application 2020 & 2033
- Table 47: Israel US Transformer Industry Revenue (billion) Forecast, by Application 2020 & 2033
- Table 48: GCC US Transformer Industry Revenue (billion) Forecast, by Application 2020 & 2033
- Table 49: North Africa US Transformer Industry Revenue (billion) Forecast, by Application 2020 & 2033
- Table 50: South Africa US Transformer Industry Revenue (billion) Forecast, by Application 2020 & 2033
- Table 51: Rest of Middle East & Africa US Transformer Industry Revenue (billion) Forecast, by Application 2020 & 2033
- Table 52: Global US Transformer Industry Revenue billion Forecast, by Production Analysis 2020 & 2033
- Table 53: Global US Transformer Industry Revenue billion Forecast, by Consumption Analysis 2020 & 2033
- Table 54: Global US Transformer Industry Revenue billion Forecast, by Import Market Analysis (Value & Volume) 2020 & 2033
- Table 55: Global US Transformer Industry Revenue billion Forecast, by Export Market Analysis (Value & Volume) 2020 & 2033
- Table 56: Global US Transformer Industry Revenue billion Forecast, by Price Trend Analysis 2020 & 2033
- Table 57: Global US Transformer Industry Revenue billion Forecast, by Country 2020 & 2033
- Table 58: China US Transformer Industry Revenue (billion) Forecast, by Application 2020 & 2033
- Table 59: India US Transformer Industry Revenue (billion) Forecast, by Application 2020 & 2033
- Table 60: Japan US Transformer Industry Revenue (billion) Forecast, by Application 2020 & 2033
- Table 61: South Korea US Transformer Industry Revenue (billion) Forecast, by Application 2020 & 2033
- Table 62: ASEAN US Transformer Industry Revenue (billion) Forecast, by Application 2020 & 2033
- Table 63: Oceania US Transformer Industry Revenue (billion) Forecast, by Application 2020 & 2033
- Table 64: Rest of Asia Pacific US Transformer Industry Revenue (billion) Forecast, by Application 2020 & 2033
Frequently Asked Questions
1. What is the projected Compound Annual Growth Rate (CAGR) of the US Transformer Industry?
The projected CAGR is approximately 9.95%.
2. Which companies are prominent players in the US Transformer Industry?
Key companies in the market include ABB Ltd, Toshiba Corp*List Not Exhaustive, Hitachi Ltd, Emerson Electric Co, Mitsubishi Electric Corporation, Siemens AG, Schneider Electric SE, Eaton Corporation PLC, General Electric Company, Panasonic Corporation.
3. What are the main segments of the US Transformer Industry?
The market segments include Production Analysis, Consumption Analysis, Import Market Analysis (Value & Volume), Export Market Analysis (Value & Volume), Price Trend Analysis.
4. Can you provide details about the market size?
The market size is estimated to be USD 70.9 billion as of 2022.
5. What are some drivers contributing to market growth?
4.; Increasing Natural Gas Demand4.; Rising Pipeline Network and Associated Infrastructure Development.
6. What are the notable trends driving market growth?
Distribution Transformer Expected to Dominate the Market.
7. Are there any restraints impacting market growth?
4.; Rising Shift toward Renewable Energy.
8. Can you provide examples of recent developments in the market?
December 2022: Hitachi Energy announced plans to invest more than USD 37 million in the expansion and modernization of its power transformer manufacturing facility in South Boston, Virginia, to meet rapidly growing demand from utility customers and for applications such as renewable energy generation and data centers.
9. What pricing options are available for accessing the report?
Pricing options include single-user, multi-user, and enterprise licenses priced at USD 3800, USD 4500, and USD 5800 respectively.
10. Is the market size provided in terms of value or volume?
The market size is provided in terms of value, measured in billion.
11. Are there any specific market keywords associated with the report?
Yes, the market keyword associated with the report is "US Transformer Industry," which aids in identifying and referencing the specific market segment covered.
12. How do I determine which pricing option suits my needs best?
The pricing options vary based on user requirements and access needs. Individual users may opt for single-user licenses, while businesses requiring broader access may choose multi-user or enterprise licenses for cost-effective access to the report.
13. Are there any additional resources or data provided in the US Transformer Industry report?
While the report offers comprehensive insights, it's advisable to review the specific contents or supplementary materials provided to ascertain if additional resources or data are available.
14. How can I stay updated on further developments or reports in the US Transformer Industry?
To stay informed about further developments, trends, and reports in the US Transformer Industry, consider subscribing to industry newsletters, following relevant companies and organizations, or regularly checking reputable industry news sources and publications.
Methodology
Step 1 - Identification of Relevant Samples Size from Population Database


Step 2 - Approaches for Defining Global Market Size (Value, Volume* & Price*)

Note*: In applicable scenarios
Step 3 - Data Sources
Primary Research
- Web Analytics
- Survey Reports
- Research Institute
- Latest Research Reports
- Opinion Leaders
Secondary Research
- Annual Reports
- White Paper
- Latest Press Release
- Industry Association
- Paid Database
- Investor Presentations

Step 4 - Data Triangulation
Involves using different sources of information in order to increase the validity of a study
These sources are likely to be stakeholders in a program - participants, other researchers, program staff, other community members, and so on.
Then we put all data in single framework & apply various statistical tools to find out the dynamic on the market.
During the analysis stage, feedback from the stakeholder groups would be compared to determine areas of agreement as well as areas of divergence