US Turf and Ornamental Protection Market Future-Proof Strategies: Market Trends 2025-2033

US Turf and Ornamental Protection Market by Production Analysis, by Consumption Analysis, by Import Market Analysis (Value & Volume), by Export Market Analysis (Value & Volume), by Price Trend Analysis, by North America (United States, Canada, Mexico), by South America (Brazil, Argentina, Rest of South America), by Europe (United Kingdom, Germany, France, Italy, Spain, Russia, Benelux, Nordics, Rest of Europe), by Middle East & Africa (Turkey, Israel, GCC, North Africa, South Africa, Rest of Middle East & Africa), by Asia Pacific (China, India, Japan, South Korea, ASEAN, Oceania, Rest of Asia Pacific) Forecast 2025-2033

Jun 28 2025
Base Year: 2024

197 Pages
Main Logo

US Turf and Ornamental Protection Market Future-Proof Strategies: Market Trends 2025-2033


Home
Industries
Agriculture
sponsor image

Tailored for you

  • In-depth Analysis Tailored to Specified Regions or Segments
  • Company Profiles Customized to User Preferences
  • Comprehensive Insights Focused on Specific Segments or Regions
  • Customized Evaluation of Competitive Landscape to Meet Your Needs
  • Tailored Customization to Address Other Specific Requirements
Ask for customization


Key Insights

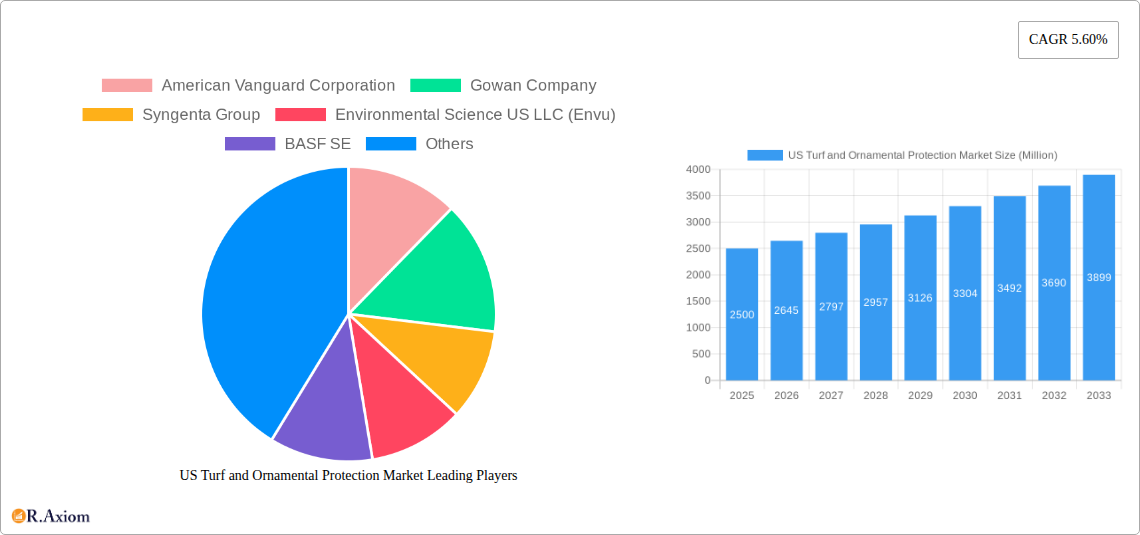
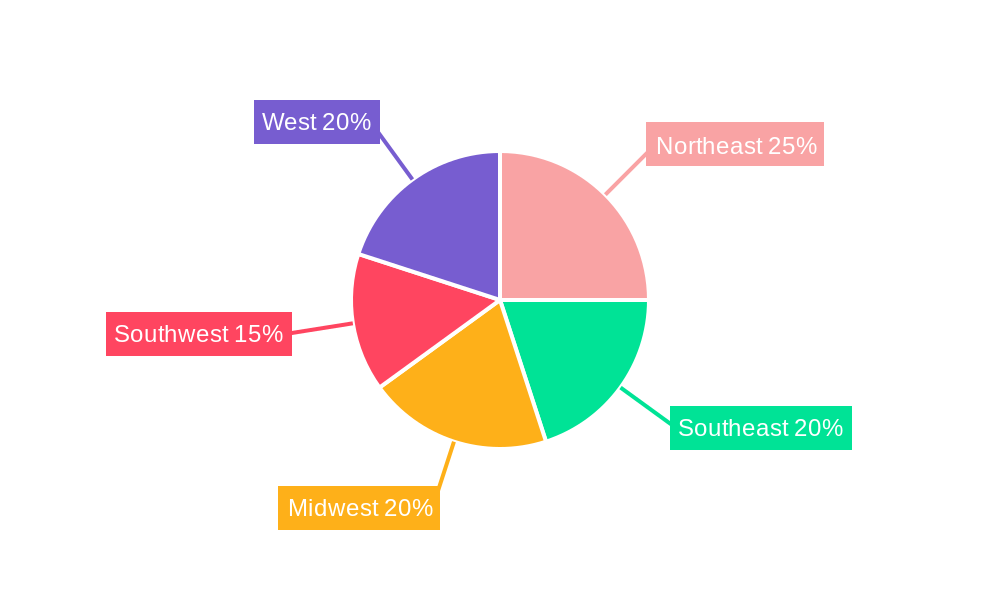
The US turf and ornamental protection market, valued at approximately $2.5 billion in 2025, is poised for robust growth, exhibiting a Compound Annual Growth Rate (CAGR) of 5.60% from 2025 to 2033. This expansion is driven by several key factors. Increasing awareness of pest and disease control in landscaping, golf courses, and parks fuels demand for effective protection solutions. The rising adoption of professional landscaping services, particularly in urban areas, further boosts market growth. Moreover, advancements in product formulations, such as the development of more environmentally friendly and targeted pesticides, are contributing to market expansion. The market is segmented by function (fungicides, herbicides, insecticides, molluscicides, nematicides) and application mode (chemigation, foliar, fumigation, seed treatment, soil treatment), offering diverse solutions tailored to specific needs. The leading companies in this sector—American Vanguard Corporation, Gowan Company, Syngenta Group, Envu, BASF SE, FMC Corporation, UPL Limited, Certis Belchim, Corteva Agriscience, and Nufarm Ltd—contribute significantly to market innovation and product availability. Regional variations exist within the US market, with regions like the Northeast and West potentially showing higher growth due to factors such as denser population and higher per-capita spending on landscaping. However, regulatory changes regarding pesticide usage and concerns about environmental impact remain key restraints.

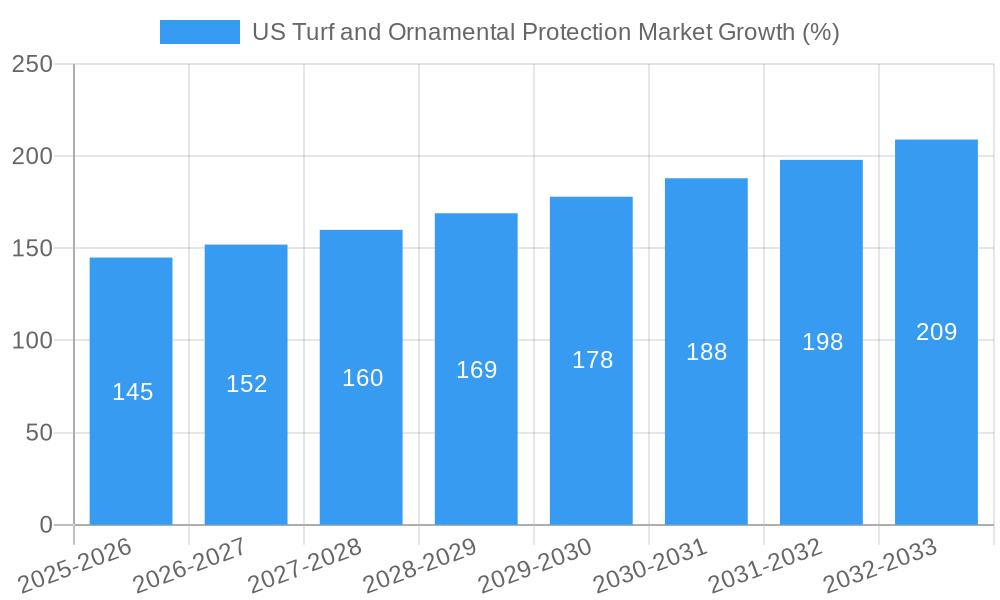
The forecast period from 2025 to 2033 anticipates a steady upward trajectory, primarily driven by continued investment in landscape maintenance and the ongoing demand for aesthetically pleasing and healthy turf. The increasing prevalence of invasive species and changing climatic conditions, leading to greater pest and disease pressures, will further stimulate market demand. However, companies will need to adapt to evolving regulations and consumer preferences for sustainable solutions. This necessitates continuous innovation in product development, with a focus on biopesticides and integrated pest management strategies to maintain market share and ensure long-term growth. The competition amongst established players and the potential entry of new players with innovative technologies will further shape the market landscape during the forecast period.

US Turf and Ornamental Protection Market Research Report - Market Size, Growth & Forecast

US Turf and Ornamental Protection Market: A Comprehensive Report (2019-2033)

This comprehensive report provides an in-depth analysis of the US Turf and Ornamental Protection market, covering the period from 2019 to 2033. It offers actionable insights for industry stakeholders, including manufacturers, distributors, and investors, by examining market dynamics, competitive landscapes, and future growth potential. The report leverages rigorous research methodologies and incorporates key market indicators to provide a holistic view of this dynamic sector. With a base year of 2025 and an estimated year of 2025, this report projects market trends and growth opportunities until 2033, encompassing the historical period (2019-2024), the study period (2019-2033), and the forecast period (2025-2033). The total market size in 2025 is estimated at xx Million.

US Turf and Ornamental Protection Market Market Concentration & Innovation

The US Turf and Ornamental Protection market exhibits a moderately concentrated structure, with a few key players holding significant market share. American Vanguard Corporation, Syngenta Group, BASF SE, FMC Corporation, and Corteva Agriscience are among the dominant players, collectively accounting for an estimated xx% of the market in 2025. However, several smaller companies and regional players also contribute significantly, fostering competition and innovation. Market share dynamics are influenced by factors such as product innovation, pricing strategies, distribution networks, and regulatory compliance.

Innovation Drivers:

  • Technological advancements: Development of novel formulations (e.g., Nufarm's Tourney EZ), targeted delivery systems, and biopesticides are driving innovation.
  • Sustainability concerns: Growing demand for environmentally friendly products is pushing the adoption of bio-based pesticides and integrated pest management (IPM) strategies.
  • Regulatory pressures: Stringent environmental regulations are compelling companies to develop and adopt safer and more sustainable products.

Regulatory Framework & Substitutes: The Environmental Protection Agency (EPA) plays a crucial role in regulating pesticide use in the US. Stringent regulations impact market entry and product development. Competition from biological controls and integrated pest management (IPM) strategies are significant challenges.

M&A Activity: The market has witnessed moderate M&A activity in recent years, driven by companies seeking to expand their product portfolios and market reach. Significant deals (values not publicly available) have involved partnerships and acquisitions to broaden geographic reach and product diversity. For example, the partnership between Lier Chemical Company Ltd and Nufarm highlights this trend.

End-User Trends: Increasing awareness of environmental sustainability and preference for low-impact pesticides have influenced end-user purchasing behavior. Landscape professionals and golf course managers are increasingly adopting IPM methods alongside targeted chemical controls.

US Turf and Ornamental Protection Market Industry Trends & Insights

The US Turf and Ornamental Protection market is expected to experience steady growth during the forecast period (2025-2033), driven by several key factors. The projected Compound Annual Growth Rate (CAGR) is estimated at xx% during this period.

Market growth is fueled by increasing demand for turf and ornamental products, rising disposable incomes, and growing landscaping and gardening activities. Technological advancements, including the development of more effective and targeted pesticides, are further driving market growth. Consumer preferences are shifting towards eco-friendly and sustainable solutions, presenting opportunities for manufacturers of biopesticides and IPM strategies. Competitive dynamics are characterized by intense competition among established players and emerging companies offering innovative products and solutions. Market penetration of new and sustainable products is continuously improving, particularly among environmentally conscious consumers and professionals.

US Turf and Ornamental Protection Market Growth

Dominant Markets & Segments in US Turf and Ornamental Protection Market

The US Turf and Ornamental Protection market is geographically diverse, with significant regional variations in market size and growth rates. The eastern and western coastal regions, with higher population densities and a significant concentration of golf courses and landscaping businesses, represent the largest markets. Specific states such as California, Florida, and Texas hold notable market share.

Function Segment Dominance:

  • Fungicides: This segment holds the largest market share due to the prevalence of fungal diseases in turf and ornamental plants.
  • Herbicides: This segment displays strong growth, fueled by the need to manage weeds and maintain aesthetically pleasing landscapes.
  • Insecticides: Insecticides are important for pest control and disease prevention and comprise a significant market segment.

Application Mode Segment Dominance:

  • Foliar Application: This method is widely used due to its effectiveness and ease of application.
  • Soil Treatment: Soil treatment is commonly applied for preventative measures and long-term disease control.

Key Drivers:

  • Favorable economic conditions and increased disposable income contribute to higher spending on landscaping and gardening.
  • Government policies promoting the use of environmentally friendly products drive the adoption of eco-friendly pesticides.
  • The well-developed infrastructure in the US supports the efficient distribution of products.

US Turf and Ornamental Protection Market Product Developments

Recent product innovations have focused on developing more targeted and environmentally sustainable solutions. This includes the introduction of new formulations with improved efficacy, reduced environmental impact, and ease of application. For example, Nufarm’s launch of Tourney EZ showcases the drive toward user-friendly, highly effective fungicides. Companies are also investing in the development of biopesticides and integrated pest management (IPM) strategies to meet growing consumer demand for sustainable alternatives. These developments offer enhanced control and minimize environmental impact, catering to market needs for both effectiveness and sustainability.

Report Scope & Segmentation Analysis

This report provides a comprehensive segmentation analysis of the US Turf and Ornamental Protection market based on function (Fungicide, Herbicide, Insecticide, Molluscicide, Nematicide) and application mode (Chemigation, Foliar, Fumigation, Seed Treatment, Soil Treatment). Each segment's market size, growth projections, and competitive dynamics are analyzed in detail. The report assesses growth projections for each segment considering evolving trends and competitive landscapes. The competitive landscape varies across segments, with some segments exhibiting greater concentration than others.

Key Drivers of US Turf and Ornamental Protection Market Growth

The US Turf and Ornamental Protection market is driven by a confluence of factors. Rising disposable incomes are increasing consumer spending on landscaping and gardening. Technological advancements resulting in more effective and eco-friendly solutions are also catalysts. Furthermore, supportive government policies promoting sustainable practices encourage the use of environmentally benign products. Finally, the growing awareness of environmentally sound landscaping practices fuels market demand for sustainable solutions.

Challenges in the US Turf and Ornamental Protection Market Sector

The market faces challenges, including stringent EPA regulations requiring extensive testing and approval processes, leading to increased costs and time-to-market. Supply chain disruptions, particularly concerning raw materials and active ingredients, can impact product availability and prices. Finally, intense competition among established players and new entrants exerts pricing pressures and necessitates continuous innovation.

Emerging Opportunities in US Turf and Ornamental Protection Market

Several opportunities exist for growth. The increasing demand for organic and sustainable products presents an opportunity for companies offering biopesticides and IPM solutions. The development of novel formulations with improved efficacy and reduced environmental impact also presents growth opportunities. Finally, exploring new application technologies, such as drones and precision application systems, could improve efficiency and reduce pesticide use.

Leading Players in the US Turf and Ornamental Protection Market Market

  • American Vanguard Corporation
  • Gowan Company
  • Syngenta Group
  • Environmental Science US LLC (Envu)
  • BASF SE
  • FMC Corporation
  • UPL Limited
  • Mitsui & Co Ltd (Certis Belchim)
  • Corteva Agriscience
  • Nufarm Ltd

Key Developments in US Turf and Ornamental Protection Market Industry

  • April 2023: Nufarm launched Tourney EZ, a new liquid formulation fungicide for turf and ornamental crops, strengthening its market position.
  • November 2022: Lier Chemical Company Ltd and Nufarm Ltd Americas Inc. partnered to deliver glufosinate to the T&O industry, expanding market access.
  • March 2022: UPL Environmental Solutions expanded its fumigation product line with the QuickPHlo-R (QPR) phosphine generator.

Strategic Outlook for US Turf and Ornamental Protection Market Market

The US Turf and Ornamental Protection market presents significant growth opportunities driven by rising consumer demand, technological innovation, and the increasing focus on sustainability. Companies focusing on developing eco-friendly solutions and enhancing product efficacy will gain a competitive advantage. Continued investments in research and development, coupled with strategic partnerships and acquisitions, will play a crucial role in shaping the market's future. The market is poised for expansion, presenting substantial opportunities for both established and emerging players.

US Turf and Ornamental Protection Market Segmentation

  • 1. Production Analysis
  • 2. Consumption Analysis
  • 3. Import Market Analysis (Value & Volume)
  • 4. Export Market Analysis (Value & Volume)
  • 5. Price Trend Analysis

US Turf and Ornamental Protection Market Segmentation By Geography

  • 1. North America
    • 1.1. United States
    • 1.2. Canada
    • 1.3. Mexico
  • 2. South America
    • 2.1. Brazil
    • 2.2. Argentina
    • 2.3. Rest of South America
  • 3. Europe
    • 3.1. United Kingdom
    • 3.2. Germany
    • 3.3. France
    • 3.4. Italy
    • 3.5. Spain
    • 3.6. Russia
    • 3.7. Benelux
    • 3.8. Nordics
    • 3.9. Rest of Europe
  • 4. Middle East & Africa
    • 4.1. Turkey
    • 4.2. Israel
    • 4.3. GCC
    • 4.4. North Africa
    • 4.5. South Africa
    • 4.6. Rest of Middle East & Africa
  • 5. Asia Pacific
    • 5.1. China
    • 5.2. India
    • 5.3. Japan
    • 5.4. South Korea
    • 5.5. ASEAN
    • 5.6. Oceania
    • 5.7. Rest of Asia Pacific
US Turf and Ornamental Protection Market Regional Share


US Turf and Ornamental Protection Market REPORT HIGHLIGHTS

AspectsDetails
Study Period 2019-2033
Base Year 2024
Estimated Year 2025
Forecast Period2025-2033
Historical Period2019-2024
Growth RateCAGR of 5.60% from 2019-2033
Segmentation
    • By Production Analysis
    • By Consumption Analysis
    • By Import Market Analysis (Value & Volume)
    • By Export Market Analysis (Value & Volume)
    • By Price Trend Analysis
  • By Geography
    • North America
      • United States
      • Canada
      • Mexico
    • South America
      • Brazil
      • Argentina
      • Rest of South America
    • Europe
      • United Kingdom
      • Germany
      • France
      • Italy
      • Spain
      • Russia
      • Benelux
      • Nordics
      • Rest of Europe
    • Middle East & Africa
      • Turkey
      • Israel
      • GCC
      • North Africa
      • South Africa
      • Rest of Middle East & Africa
    • Asia Pacific
      • China
      • India
      • Japan
      • South Korea
      • ASEAN
      • Oceania
      • Rest of Asia Pacific


Table of Contents

  1. 1. Introduction
    • 1.1. Research Scope
    • 1.2. Market Segmentation
    • 1.3. Research Methodology
    • 1.4. Definitions and Assumptions
  2. 2. Executive Summary
    • 2.1. Introduction
  3. 3. Market Dynamics
    • 3.1. Introduction
      • 3.2. Market Drivers
        • 3.2.1. Seed Treatment As A Solution To Enhance Yield; Growing Awareness For Seed Treatment Among The Farmers; Rising Trend Of Organic Farming
      • 3.3. Market Restrains
        • 3.3.1. Limitations Across Farm-Level Seed Treatment; Rising Environmental Concerns
      • 3.4. Market Trends
        • 3.4.1. An increase in the number of floriculture producers drives the usage of crop protection chemicals
  4. 4. Market Factor Analysis
    • 4.1. Porters Five Forces
    • 4.2. Supply/Value Chain
    • 4.3. PESTEL analysis
    • 4.4. Market Entropy
    • 4.5. Patent/Trademark Analysis
  5. 5. Global US Turf and Ornamental Protection Market Analysis, Insights and Forecast, 2019-2031
    • 5.1. Market Analysis, Insights and Forecast - by Production Analysis
      • 5.2. Market Analysis, Insights and Forecast - by Consumption Analysis
        • 5.3. Market Analysis, Insights and Forecast - by Import Market Analysis (Value & Volume)
          • 5.4. Market Analysis, Insights and Forecast - by Export Market Analysis (Value & Volume)
            • 5.5. Market Analysis, Insights and Forecast - by Price Trend Analysis
              • 5.6. Market Analysis, Insights and Forecast - by Region
                • 5.6.1. North America
                • 5.6.2. South America
                • 5.6.3. Europe
                • 5.6.4. Middle East & Africa
                • 5.6.5. Asia Pacific
            • 6. North America US Turf and Ornamental Protection Market Analysis, Insights and Forecast, 2019-2031
              • 6.1. Market Analysis, Insights and Forecast - by Production Analysis
                • 6.2. Market Analysis, Insights and Forecast - by Consumption Analysis
                  • 6.3. Market Analysis, Insights and Forecast - by Import Market Analysis (Value & Volume)
                    • 6.4. Market Analysis, Insights and Forecast - by Export Market Analysis (Value & Volume)
                      • 6.5. Market Analysis, Insights and Forecast - by Price Trend Analysis
                      • 7. South America US Turf and Ornamental Protection Market Analysis, Insights and Forecast, 2019-2031
                        • 7.1. Market Analysis, Insights and Forecast - by Production Analysis
                          • 7.2. Market Analysis, Insights and Forecast - by Consumption Analysis
                            • 7.3. Market Analysis, Insights and Forecast - by Import Market Analysis (Value & Volume)
                              • 7.4. Market Analysis, Insights and Forecast - by Export Market Analysis (Value & Volume)
                                • 7.5. Market Analysis, Insights and Forecast - by Price Trend Analysis
                                • 8. Europe US Turf and Ornamental Protection Market Analysis, Insights and Forecast, 2019-2031
                                  • 8.1. Market Analysis, Insights and Forecast - by Production Analysis
                                    • 8.2. Market Analysis, Insights and Forecast - by Consumption Analysis
                                      • 8.3. Market Analysis, Insights and Forecast - by Import Market Analysis (Value & Volume)
                                        • 8.4. Market Analysis, Insights and Forecast - by Export Market Analysis (Value & Volume)
                                          • 8.5. Market Analysis, Insights and Forecast - by Price Trend Analysis
                                          • 9. Middle East & Africa US Turf and Ornamental Protection Market Analysis, Insights and Forecast, 2019-2031
                                            • 9.1. Market Analysis, Insights and Forecast - by Production Analysis
                                              • 9.2. Market Analysis, Insights and Forecast - by Consumption Analysis
                                                • 9.3. Market Analysis, Insights and Forecast - by Import Market Analysis (Value & Volume)
                                                  • 9.4. Market Analysis, Insights and Forecast - by Export Market Analysis (Value & Volume)
                                                    • 9.5. Market Analysis, Insights and Forecast - by Price Trend Analysis
                                                    • 10. Asia Pacific US Turf and Ornamental Protection Market Analysis, Insights and Forecast, 2019-2031
                                                      • 10.1. Market Analysis, Insights and Forecast - by Production Analysis
                                                        • 10.2. Market Analysis, Insights and Forecast - by Consumption Analysis
                                                          • 10.3. Market Analysis, Insights and Forecast - by Import Market Analysis (Value & Volume)
                                                            • 10.4. Market Analysis, Insights and Forecast - by Export Market Analysis (Value & Volume)
                                                              • 10.5. Market Analysis, Insights and Forecast - by Price Trend Analysis
                                                              • 11. Northeast US Turf and Ornamental Protection Market Analysis, Insights and Forecast, 2019-2031
                                                                • 12. Southeast US Turf and Ornamental Protection Market Analysis, Insights and Forecast, 2019-2031
                                                                  • 13. Midwest US Turf and Ornamental Protection Market Analysis, Insights and Forecast, 2019-2031
                                                                    • 14. Southwest US Turf and Ornamental Protection Market Analysis, Insights and Forecast, 2019-2031
                                                                      • 15. West US Turf and Ornamental Protection Market Analysis, Insights and Forecast, 2019-2031
                                                                        • 16. Competitive Analysis
                                                                          • 16.1. Global Market Share Analysis 2024
                                                                            • 16.2. Company Profiles
                                                                              • 16.2.1 American Vanguard Corporation
                                                                                • 16.2.1.1. Overview
                                                                                • 16.2.1.2. Products
                                                                                • 16.2.1.3. SWOT Analysis
                                                                                • 16.2.1.4. Recent Developments
                                                                                • 16.2.1.5. Financials (Based on Availability)
                                                                              • 16.2.2 Gowan Company
                                                                                • 16.2.2.1. Overview
                                                                                • 16.2.2.2. Products
                                                                                • 16.2.2.3. SWOT Analysis
                                                                                • 16.2.2.4. Recent Developments
                                                                                • 16.2.2.5. Financials (Based on Availability)
                                                                              • 16.2.3 Syngenta Group
                                                                                • 16.2.3.1. Overview
                                                                                • 16.2.3.2. Products
                                                                                • 16.2.3.3. SWOT Analysis
                                                                                • 16.2.3.4. Recent Developments
                                                                                • 16.2.3.5. Financials (Based on Availability)
                                                                              • 16.2.4 Environmental Science US LLC (Envu)
                                                                                • 16.2.4.1. Overview
                                                                                • 16.2.4.2. Products
                                                                                • 16.2.4.3. SWOT Analysis
                                                                                • 16.2.4.4. Recent Developments
                                                                                • 16.2.4.5. Financials (Based on Availability)
                                                                              • 16.2.5 BASF SE
                                                                                • 16.2.5.1. Overview
                                                                                • 16.2.5.2. Products
                                                                                • 16.2.5.3. SWOT Analysis
                                                                                • 16.2.5.4. Recent Developments
                                                                                • 16.2.5.5. Financials (Based on Availability)
                                                                              • 16.2.6 FMC Corporation
                                                                                • 16.2.6.1. Overview
                                                                                • 16.2.6.2. Products
                                                                                • 16.2.6.3. SWOT Analysis
                                                                                • 16.2.6.4. Recent Developments
                                                                                • 16.2.6.5. Financials (Based on Availability)
                                                                              • 16.2.7 UPL Limite
                                                                                • 16.2.7.1. Overview
                                                                                • 16.2.7.2. Products
                                                                                • 16.2.7.3. SWOT Analysis
                                                                                • 16.2.7.4. Recent Developments
                                                                                • 16.2.7.5. Financials (Based on Availability)
                                                                              • 16.2.8 Mitsui & Co Ltd (Certis Belchim)
                                                                                • 16.2.8.1. Overview
                                                                                • 16.2.8.2. Products
                                                                                • 16.2.8.3. SWOT Analysis
                                                                                • 16.2.8.4. Recent Developments
                                                                                • 16.2.8.5. Financials (Based on Availability)
                                                                              • 16.2.9 Corteva Agriscience
                                                                                • 16.2.9.1. Overview
                                                                                • 16.2.9.2. Products
                                                                                • 16.2.9.3. SWOT Analysis
                                                                                • 16.2.9.4. Recent Developments
                                                                                • 16.2.9.5. Financials (Based on Availability)
                                                                              • 16.2.10 Nufarm Ltd
                                                                                • 16.2.10.1. Overview
                                                                                • 16.2.10.2. Products
                                                                                • 16.2.10.3. SWOT Analysis
                                                                                • 16.2.10.4. Recent Developments
                                                                                • 16.2.10.5. Financials (Based on Availability)

                                                                        List of Figures

                                                                        1. Figure 1: Global US Turf and Ornamental Protection Market Revenue Breakdown (Million, %) by Region 2024 & 2032
                                                                        2. Figure 2: United states US Turf and Ornamental Protection Market Revenue (Million), by Country 2024 & 2032
                                                                        3. Figure 3: United states US Turf and Ornamental Protection Market Revenue Share (%), by Country 2024 & 2032
                                                                        4. Figure 4: North America US Turf and Ornamental Protection Market Revenue (Million), by Production Analysis 2024 & 2032
                                                                        5. Figure 5: North America US Turf and Ornamental Protection Market Revenue Share (%), by Production Analysis 2024 & 2032
                                                                        6. Figure 6: North America US Turf and Ornamental Protection Market Revenue (Million), by Consumption Analysis 2024 & 2032
                                                                        7. Figure 7: North America US Turf and Ornamental Protection Market Revenue Share (%), by Consumption Analysis 2024 & 2032
                                                                        8. Figure 8: North America US Turf and Ornamental Protection Market Revenue (Million), by Import Market Analysis (Value & Volume) 2024 & 2032
                                                                        9. Figure 9: North America US Turf and Ornamental Protection Market Revenue Share (%), by Import Market Analysis (Value & Volume) 2024 & 2032
                                                                        10. Figure 10: North America US Turf and Ornamental Protection Market Revenue (Million), by Export Market Analysis (Value & Volume) 2024 & 2032
                                                                        11. Figure 11: North America US Turf and Ornamental Protection Market Revenue Share (%), by Export Market Analysis (Value & Volume) 2024 & 2032
                                                                        12. Figure 12: North America US Turf and Ornamental Protection Market Revenue (Million), by Price Trend Analysis 2024 & 2032
                                                                        13. Figure 13: North America US Turf and Ornamental Protection Market Revenue Share (%), by Price Trend Analysis 2024 & 2032
                                                                        14. Figure 14: North America US Turf and Ornamental Protection Market Revenue (Million), by Country 2024 & 2032
                                                                        15. Figure 15: North America US Turf and Ornamental Protection Market Revenue Share (%), by Country 2024 & 2032
                                                                        16. Figure 16: South America US Turf and Ornamental Protection Market Revenue (Million), by Production Analysis 2024 & 2032
                                                                        17. Figure 17: South America US Turf and Ornamental Protection Market Revenue Share (%), by Production Analysis 2024 & 2032
                                                                        18. Figure 18: South America US Turf and Ornamental Protection Market Revenue (Million), by Consumption Analysis 2024 & 2032
                                                                        19. Figure 19: South America US Turf and Ornamental Protection Market Revenue Share (%), by Consumption Analysis 2024 & 2032
                                                                        20. Figure 20: South America US Turf and Ornamental Protection Market Revenue (Million), by Import Market Analysis (Value & Volume) 2024 & 2032
                                                                        21. Figure 21: South America US Turf and Ornamental Protection Market Revenue Share (%), by Import Market Analysis (Value & Volume) 2024 & 2032
                                                                        22. Figure 22: South America US Turf and Ornamental Protection Market Revenue (Million), by Export Market Analysis (Value & Volume) 2024 & 2032
                                                                        23. Figure 23: South America US Turf and Ornamental Protection Market Revenue Share (%), by Export Market Analysis (Value & Volume) 2024 & 2032
                                                                        24. Figure 24: South America US Turf and Ornamental Protection Market Revenue (Million), by Price Trend Analysis 2024 & 2032
                                                                        25. Figure 25: South America US Turf and Ornamental Protection Market Revenue Share (%), by Price Trend Analysis 2024 & 2032
                                                                        26. Figure 26: South America US Turf and Ornamental Protection Market Revenue (Million), by Country 2024 & 2032
                                                                        27. Figure 27: South America US Turf and Ornamental Protection Market Revenue Share (%), by Country 2024 & 2032
                                                                        28. Figure 28: Europe US Turf and Ornamental Protection Market Revenue (Million), by Production Analysis 2024 & 2032
                                                                        29. Figure 29: Europe US Turf and Ornamental Protection Market Revenue Share (%), by Production Analysis 2024 & 2032
                                                                        30. Figure 30: Europe US Turf and Ornamental Protection Market Revenue (Million), by Consumption Analysis 2024 & 2032
                                                                        31. Figure 31: Europe US Turf and Ornamental Protection Market Revenue Share (%), by Consumption Analysis 2024 & 2032
                                                                        32. Figure 32: Europe US Turf and Ornamental Protection Market Revenue (Million), by Import Market Analysis (Value & Volume) 2024 & 2032
                                                                        33. Figure 33: Europe US Turf and Ornamental Protection Market Revenue Share (%), by Import Market Analysis (Value & Volume) 2024 & 2032
                                                                        34. Figure 34: Europe US Turf and Ornamental Protection Market Revenue (Million), by Export Market Analysis (Value & Volume) 2024 & 2032
                                                                        35. Figure 35: Europe US Turf and Ornamental Protection Market Revenue Share (%), by Export Market Analysis (Value & Volume) 2024 & 2032
                                                                        36. Figure 36: Europe US Turf and Ornamental Protection Market Revenue (Million), by Price Trend Analysis 2024 & 2032
                                                                        37. Figure 37: Europe US Turf and Ornamental Protection Market Revenue Share (%), by Price Trend Analysis 2024 & 2032
                                                                        38. Figure 38: Europe US Turf and Ornamental Protection Market Revenue (Million), by Country 2024 & 2032
                                                                        39. Figure 39: Europe US Turf and Ornamental Protection Market Revenue Share (%), by Country 2024 & 2032
                                                                        40. Figure 40: Middle East & Africa US Turf and Ornamental Protection Market Revenue (Million), by Production Analysis 2024 & 2032
                                                                        41. Figure 41: Middle East & Africa US Turf and Ornamental Protection Market Revenue Share (%), by Production Analysis 2024 & 2032
                                                                        42. Figure 42: Middle East & Africa US Turf and Ornamental Protection Market Revenue (Million), by Consumption Analysis 2024 & 2032
                                                                        43. Figure 43: Middle East & Africa US Turf and Ornamental Protection Market Revenue Share (%), by Consumption Analysis 2024 & 2032
                                                                        44. Figure 44: Middle East & Africa US Turf and Ornamental Protection Market Revenue (Million), by Import Market Analysis (Value & Volume) 2024 & 2032
                                                                        45. Figure 45: Middle East & Africa US Turf and Ornamental Protection Market Revenue Share (%), by Import Market Analysis (Value & Volume) 2024 & 2032
                                                                        46. Figure 46: Middle East & Africa US Turf and Ornamental Protection Market Revenue (Million), by Export Market Analysis (Value & Volume) 2024 & 2032
                                                                        47. Figure 47: Middle East & Africa US Turf and Ornamental Protection Market Revenue Share (%), by Export Market Analysis (Value & Volume) 2024 & 2032
                                                                        48. Figure 48: Middle East & Africa US Turf and Ornamental Protection Market Revenue (Million), by Price Trend Analysis 2024 & 2032
                                                                        49. Figure 49: Middle East & Africa US Turf and Ornamental Protection Market Revenue Share (%), by Price Trend Analysis 2024 & 2032
                                                                        50. Figure 50: Middle East & Africa US Turf and Ornamental Protection Market Revenue (Million), by Country 2024 & 2032
                                                                        51. Figure 51: Middle East & Africa US Turf and Ornamental Protection Market Revenue Share (%), by Country 2024 & 2032
                                                                        52. Figure 52: Asia Pacific US Turf and Ornamental Protection Market Revenue (Million), by Production Analysis 2024 & 2032
                                                                        53. Figure 53: Asia Pacific US Turf and Ornamental Protection Market Revenue Share (%), by Production Analysis 2024 & 2032
                                                                        54. Figure 54: Asia Pacific US Turf and Ornamental Protection Market Revenue (Million), by Consumption Analysis 2024 & 2032
                                                                        55. Figure 55: Asia Pacific US Turf and Ornamental Protection Market Revenue Share (%), by Consumption Analysis 2024 & 2032
                                                                        56. Figure 56: Asia Pacific US Turf and Ornamental Protection Market Revenue (Million), by Import Market Analysis (Value & Volume) 2024 & 2032
                                                                        57. Figure 57: Asia Pacific US Turf and Ornamental Protection Market Revenue Share (%), by Import Market Analysis (Value & Volume) 2024 & 2032
                                                                        58. Figure 58: Asia Pacific US Turf and Ornamental Protection Market Revenue (Million), by Export Market Analysis (Value & Volume) 2024 & 2032
                                                                        59. Figure 59: Asia Pacific US Turf and Ornamental Protection Market Revenue Share (%), by Export Market Analysis (Value & Volume) 2024 & 2032
                                                                        60. Figure 60: Asia Pacific US Turf and Ornamental Protection Market Revenue (Million), by Price Trend Analysis 2024 & 2032
                                                                        61. Figure 61: Asia Pacific US Turf and Ornamental Protection Market Revenue Share (%), by Price Trend Analysis 2024 & 2032
                                                                        62. Figure 62: Asia Pacific US Turf and Ornamental Protection Market Revenue (Million), by Country 2024 & 2032
                                                                        63. Figure 63: Asia Pacific US Turf and Ornamental Protection Market Revenue Share (%), by Country 2024 & 2032

                                                                        List of Tables

                                                                        1. Table 1: Global US Turf and Ornamental Protection Market Revenue Million Forecast, by Region 2019 & 2032
                                                                        2. Table 2: Global US Turf and Ornamental Protection Market Revenue Million Forecast, by Production Analysis 2019 & 2032
                                                                        3. Table 3: Global US Turf and Ornamental Protection Market Revenue Million Forecast, by Consumption Analysis 2019 & 2032
                                                                        4. Table 4: Global US Turf and Ornamental Protection Market Revenue Million Forecast, by Import Market Analysis (Value & Volume) 2019 & 2032
                                                                        5. Table 5: Global US Turf and Ornamental Protection Market Revenue Million Forecast, by Export Market Analysis (Value & Volume) 2019 & 2032
                                                                        6. Table 6: Global US Turf and Ornamental Protection Market Revenue Million Forecast, by Price Trend Analysis 2019 & 2032
                                                                        7. Table 7: Global US Turf and Ornamental Protection Market Revenue Million Forecast, by Region 2019 & 2032
                                                                        8. Table 8: Global US Turf and Ornamental Protection Market Revenue Million Forecast, by Country 2019 & 2032
                                                                        9. Table 9: Northeast US Turf and Ornamental Protection Market Revenue (Million) Forecast, by Application 2019 & 2032
                                                                        10. Table 10: Southeast US Turf and Ornamental Protection Market Revenue (Million) Forecast, by Application 2019 & 2032
                                                                        11. Table 11: Midwest US Turf and Ornamental Protection Market Revenue (Million) Forecast, by Application 2019 & 2032
                                                                        12. Table 12: Southwest US Turf and Ornamental Protection Market Revenue (Million) Forecast, by Application 2019 & 2032
                                                                        13. Table 13: West US Turf and Ornamental Protection Market Revenue (Million) Forecast, by Application 2019 & 2032
                                                                        14. Table 14: Global US Turf and Ornamental Protection Market Revenue Million Forecast, by Production Analysis 2019 & 2032
                                                                        15. Table 15: Global US Turf and Ornamental Protection Market Revenue Million Forecast, by Consumption Analysis 2019 & 2032
                                                                        16. Table 16: Global US Turf and Ornamental Protection Market Revenue Million Forecast, by Import Market Analysis (Value & Volume) 2019 & 2032
                                                                        17. Table 17: Global US Turf and Ornamental Protection Market Revenue Million Forecast, by Export Market Analysis (Value & Volume) 2019 & 2032
                                                                        18. Table 18: Global US Turf and Ornamental Protection Market Revenue Million Forecast, by Price Trend Analysis 2019 & 2032
                                                                        19. Table 19: Global US Turf and Ornamental Protection Market Revenue Million Forecast, by Country 2019 & 2032
                                                                        20. Table 20: United States US Turf and Ornamental Protection Market Revenue (Million) Forecast, by Application 2019 & 2032
                                                                        21. Table 21: Canada US Turf and Ornamental Protection Market Revenue (Million) Forecast, by Application 2019 & 2032
                                                                        22. Table 22: Mexico US Turf and Ornamental Protection Market Revenue (Million) Forecast, by Application 2019 & 2032
                                                                        23. Table 23: Global US Turf and Ornamental Protection Market Revenue Million Forecast, by Production Analysis 2019 & 2032
                                                                        24. Table 24: Global US Turf and Ornamental Protection Market Revenue Million Forecast, by Consumption Analysis 2019 & 2032
                                                                        25. Table 25: Global US Turf and Ornamental Protection Market Revenue Million Forecast, by Import Market Analysis (Value & Volume) 2019 & 2032
                                                                        26. Table 26: Global US Turf and Ornamental Protection Market Revenue Million Forecast, by Export Market Analysis (Value & Volume) 2019 & 2032
                                                                        27. Table 27: Global US Turf and Ornamental Protection Market Revenue Million Forecast, by Price Trend Analysis 2019 & 2032
                                                                        28. Table 28: Global US Turf and Ornamental Protection Market Revenue Million Forecast, by Country 2019 & 2032
                                                                        29. Table 29: Brazil US Turf and Ornamental Protection Market Revenue (Million) Forecast, by Application 2019 & 2032
                                                                        30. Table 30: Argentina US Turf and Ornamental Protection Market Revenue (Million) Forecast, by Application 2019 & 2032
                                                                        31. Table 31: Rest of South America US Turf and Ornamental Protection Market Revenue (Million) Forecast, by Application 2019 & 2032
                                                                        32. Table 32: Global US Turf and Ornamental Protection Market Revenue Million Forecast, by Production Analysis 2019 & 2032
                                                                        33. Table 33: Global US Turf and Ornamental Protection Market Revenue Million Forecast, by Consumption Analysis 2019 & 2032
                                                                        34. Table 34: Global US Turf and Ornamental Protection Market Revenue Million Forecast, by Import Market Analysis (Value & Volume) 2019 & 2032
                                                                        35. Table 35: Global US Turf and Ornamental Protection Market Revenue Million Forecast, by Export Market Analysis (Value & Volume) 2019 & 2032
                                                                        36. Table 36: Global US Turf and Ornamental Protection Market Revenue Million Forecast, by Price Trend Analysis 2019 & 2032
                                                                        37. Table 37: Global US Turf and Ornamental Protection Market Revenue Million Forecast, by Country 2019 & 2032
                                                                        38. Table 38: United Kingdom US Turf and Ornamental Protection Market Revenue (Million) Forecast, by Application 2019 & 2032
                                                                        39. Table 39: Germany US Turf and Ornamental Protection Market Revenue (Million) Forecast, by Application 2019 & 2032
                                                                        40. Table 40: France US Turf and Ornamental Protection Market Revenue (Million) Forecast, by Application 2019 & 2032
                                                                        41. Table 41: Italy US Turf and Ornamental Protection Market Revenue (Million) Forecast, by Application 2019 & 2032
                                                                        42. Table 42: Spain US Turf and Ornamental Protection Market Revenue (Million) Forecast, by Application 2019 & 2032
                                                                        43. Table 43: Russia US Turf and Ornamental Protection Market Revenue (Million) Forecast, by Application 2019 & 2032
                                                                        44. Table 44: Benelux US Turf and Ornamental Protection Market Revenue (Million) Forecast, by Application 2019 & 2032
                                                                        45. Table 45: Nordics US Turf and Ornamental Protection Market Revenue (Million) Forecast, by Application 2019 & 2032
                                                                        46. Table 46: Rest of Europe US Turf and Ornamental Protection Market Revenue (Million) Forecast, by Application 2019 & 2032
                                                                        47. Table 47: Global US Turf and Ornamental Protection Market Revenue Million Forecast, by Production Analysis 2019 & 2032
                                                                        48. Table 48: Global US Turf and Ornamental Protection Market Revenue Million Forecast, by Consumption Analysis 2019 & 2032
                                                                        49. Table 49: Global US Turf and Ornamental Protection Market Revenue Million Forecast, by Import Market Analysis (Value & Volume) 2019 & 2032
                                                                        50. Table 50: Global US Turf and Ornamental Protection Market Revenue Million Forecast, by Export Market Analysis (Value & Volume) 2019 & 2032
                                                                        51. Table 51: Global US Turf and Ornamental Protection Market Revenue Million Forecast, by Price Trend Analysis 2019 & 2032
                                                                        52. Table 52: Global US Turf and Ornamental Protection Market Revenue Million Forecast, by Country 2019 & 2032
                                                                        53. Table 53: Turkey US Turf and Ornamental Protection Market Revenue (Million) Forecast, by Application 2019 & 2032
                                                                        54. Table 54: Israel US Turf and Ornamental Protection Market Revenue (Million) Forecast, by Application 2019 & 2032
                                                                        55. Table 55: GCC US Turf and Ornamental Protection Market Revenue (Million) Forecast, by Application 2019 & 2032
                                                                        56. Table 56: North Africa US Turf and Ornamental Protection Market Revenue (Million) Forecast, by Application 2019 & 2032
                                                                        57. Table 57: South Africa US Turf and Ornamental Protection Market Revenue (Million) Forecast, by Application 2019 & 2032
                                                                        58. Table 58: Rest of Middle East & Africa US Turf and Ornamental Protection Market Revenue (Million) Forecast, by Application 2019 & 2032
                                                                        59. Table 59: Global US Turf and Ornamental Protection Market Revenue Million Forecast, by Production Analysis 2019 & 2032
                                                                        60. Table 60: Global US Turf and Ornamental Protection Market Revenue Million Forecast, by Consumption Analysis 2019 & 2032
                                                                        61. Table 61: Global US Turf and Ornamental Protection Market Revenue Million Forecast, by Import Market Analysis (Value & Volume) 2019 & 2032
                                                                        62. Table 62: Global US Turf and Ornamental Protection Market Revenue Million Forecast, by Export Market Analysis (Value & Volume) 2019 & 2032
                                                                        63. Table 63: Global US Turf and Ornamental Protection Market Revenue Million Forecast, by Price Trend Analysis 2019 & 2032
                                                                        64. Table 64: Global US Turf and Ornamental Protection Market Revenue Million Forecast, by Country 2019 & 2032
                                                                        65. Table 65: China US Turf and Ornamental Protection Market Revenue (Million) Forecast, by Application 2019 & 2032
                                                                        66. Table 66: India US Turf and Ornamental Protection Market Revenue (Million) Forecast, by Application 2019 & 2032
                                                                        67. Table 67: Japan US Turf and Ornamental Protection Market Revenue (Million) Forecast, by Application 2019 & 2032
                                                                        68. Table 68: South Korea US Turf and Ornamental Protection Market Revenue (Million) Forecast, by Application 2019 & 2032
                                                                        69. Table 69: ASEAN US Turf and Ornamental Protection Market Revenue (Million) Forecast, by Application 2019 & 2032
                                                                        70. Table 70: Oceania US Turf and Ornamental Protection Market Revenue (Million) Forecast, by Application 2019 & 2032
                                                                        71. Table 71: Rest of Asia Pacific US Turf and Ornamental Protection Market Revenue (Million) Forecast, by Application 2019 & 2032


                                                                        Frequently Asked Questions

                                                                        1. What is the projected Compound Annual Growth Rate (CAGR) of the US Turf and Ornamental Protection Market?

                                                                        The projected CAGR is approximately 5.60%.

                                                                        2. Which companies are prominent players in the US Turf and Ornamental Protection Market?

                                                                        Key companies in the market include American Vanguard Corporation, Gowan Company, Syngenta Group, Environmental Science US LLC (Envu), BASF SE, FMC Corporation, UPL Limite, Mitsui & Co Ltd (Certis Belchim), Corteva Agriscience, Nufarm Ltd.

                                                                        3. What are the main segments of the US Turf and Ornamental Protection Market?

                                                                        The market segments include Production Analysis, Consumption Analysis, Import Market Analysis (Value & Volume), Export Market Analysis (Value & Volume), Price Trend Analysis.

                                                                        4. Can you provide details about the market size?

                                                                        The market size is estimated to be USD XX Million as of 2022.

                                                                        5. What are some drivers contributing to market growth?

                                                                        Seed Treatment As A Solution To Enhance Yield; Growing Awareness For Seed Treatment Among The Farmers; Rising Trend Of Organic Farming.

                                                                        6. What are the notable trends driving market growth?

                                                                        An increase in the number of floriculture producers drives the usage of crop protection chemicals.

                                                                        7. Are there any restraints impacting market growth?

                                                                        Limitations Across Farm-Level Seed Treatment; Rising Environmental Concerns.

                                                                        8. Can you provide examples of recent developments in the market?

                                                                        April 2023: Nufarm launched a new liquid formulation fungicide, Tourney EZ, exclusively for turf and ornamental crops based on customer demand, which further strengthens the company's role in turf and ornamental crop protection.November 2022: Lier Chemical Company Ltd and Nufarm Ltd Americas Inc. established a partnership to deliver glufosinate to the turf and ornamental (T&O) industry.March 2022: With the QuickPHlo-R (QPR) phosphine generator, which uses a special granular formulation in an enclosed application system, UPL Environmental Solutions expanded its fumigation product line.

                                                                        9. What pricing options are available for accessing the report?

                                                                        Pricing options include single-user, multi-user, and enterprise licenses priced at USD 3800, USD 4500, and USD 5800 respectively.

                                                                        10. Is the market size provided in terms of value or volume?

                                                                        The market size is provided in terms of value, measured in Million.

                                                                        11. Are there any specific market keywords associated with the report?

                                                                        Yes, the market keyword associated with the report is "US Turf and Ornamental Protection Market," which aids in identifying and referencing the specific market segment covered.

                                                                        12. How do I determine which pricing option suits my needs best?

                                                                        The pricing options vary based on user requirements and access needs. Individual users may opt for single-user licenses, while businesses requiring broader access may choose multi-user or enterprise licenses for cost-effective access to the report.

                                                                        13. Are there any additional resources or data provided in the US Turf and Ornamental Protection Market report?

                                                                        While the report offers comprehensive insights, it's advisable to review the specific contents or supplementary materials provided to ascertain if additional resources or data are available.

                                                                        14. How can I stay updated on further developments or reports in the US Turf and Ornamental Protection Market?

                                                                        To stay informed about further developments, trends, and reports in the US Turf and Ornamental Protection Market, consider subscribing to industry newsletters, following relevant companies and organizations, or regularly checking reputable industry news sources and publications.


                                                                        Methodology

                                                                        Step 1 - Identification of Relevant Samples Size from Population Database

                                                                        Step Chart
                                                                        Bar Chart
                                                                        Method Chart

                                                                        Step 2 - Approaches for Defining Global Market Size (Value, Volume* & Price*)

                                                                        Approach Chart
                                                                        Top-down and bottom-up approaches are used to validate the global market size and estimate the market size for manufactures, regional segments, product, and application.

                                                                        Note*: In applicable scenarios

                                                                        Step 3 - Data Sources

                                                                        Primary Research

                                                                        • Web Analytics
                                                                        • Survey Reports
                                                                        • Research Institute
                                                                        • Latest Research Reports
                                                                        • Opinion Leaders

                                                                        Secondary Research

                                                                        • Annual Reports
                                                                        • White Paper
                                                                        • Latest Press Release
                                                                        • Industry Association
                                                                        • Paid Database
                                                                        • Investor Presentations
                                                                        Analyst Chart

                                                                        Step 4 - Data Triangulation

                                                                        Involves using different sources of information in order to increase the validity of a study

                                                                        These sources are likely to be stakeholders in a program - participants, other researchers, program staff, other community members, and so on.

                                                                        Then we put all data in single framework & apply various statistical tools to find out the dynamic on the market.

                                                                        During the analysis stage, feedback from the stakeholder groups would be compared to determine areas of agreement as well as areas of divergence

                                                                        Additionally, after gathering mixed and scattered data from a wide range of sources, data is triangulated and correlated to come up with estimated figures which are further validated through primary mediums or industry experts, opinion leaders.

                                                                        About Research Axiom

                                                                        Research Axiom delivers in-depth market research, industry analysis, and consulting for pharmaceuticals, automotive, IT, and consumer goods. Our reports provide the clarity you need to make informed decisions and drive innovation.

                                                                        Our team combines primary research, advanced analytics, and sector expertise to deliver actionable intelligence. We offer syndicated reports, custom research, and consulting services tailored to your business needs.

                                                                        At Research Axiom, we are committed to quality, transparency, and client satisfaction. Every report is rigorously validated to ensure accuracy and relevance. Our global perspective and local expertise help you understand both the big picture and the finer details of your market.

                                                                        Stay informed with Research Axiom. Subscribe to our newsletter for the latest updates and research highlights, and follow us on social media for real-time insights. Research Axiom – Turning Data into Business Advantage.

                                                                        artwork spiralartwork spiralRelated Reports
                                                                        artwork underline

                                                                        Strategic Planning for North America Agricultural Irrigation Machinery Market Industry Expansion

                                                                        Discover the booming North American agricultural irrigation machinery market. This in-depth analysis reveals a 5.10% CAGR, driven by water scarcity, precision agriculture, and smart irrigation technology. Learn about key players, market trends, and future projections for 2025-2033.

                                                                        July 2025
                                                                        Base Year: 2024
                                                                        No Of Pages: 234
                                                                        Price: $4750

                                                                        Qatar Aquaculture and Fisheries Market Analysis Uncovered: Market Drivers and Forecasts 2025-2033

                                                                        Discover the booming Qatar aquaculture and fisheries market, projected to reach \$252.74 million by 2033 with a 5% CAGR. This in-depth analysis covers market size, key players (Al-Khaleej Seafoods, Al Rayan Shrimp Trading), segments (pelagic fish, shrimp, caviar), and future growth drivers.

                                                                        July 2025
                                                                        Base Year: 2024
                                                                        No Of Pages: 150
                                                                        Price: $3800

                                                                        U.S. Maize Industry Market Trends and Strategic Roadmap

                                                                        Discover the dynamic U.S. maize industry outlook with our comprehensive market analysis. Explore key trends, regional breakdowns, and leading companies shaping this multi-billion dollar sector. Projecting steady growth through 2033, understand the factors driving expansion and the challenges ahead for maize producers and stakeholders.

                                                                        July 2025
                                                                        Base Year: 2024
                                                                        No Of Pages: 180
                                                                        Price: $3800

                                                                        Alfalfa Hay Market in Italy Future-proof Strategies: Trends, Competitor Dynamics, and Opportunities 2025-2033

                                                                        Discover the latest insights into Italy's thriving alfalfa hay market. Explore market size, CAGR, key drivers, trends, and competitive landscape analysis for 2025-2033. Learn about segment growth in bales, pellets, and cubes across animal feed applications.

                                                                        July 2025
                                                                        Base Year: 2024
                                                                        No Of Pages: 150
                                                                        Price: $3800

                                                                        India Biopesticides Industry Market Disruption: Competitor Insights and Trends 2025-2033

                                                                        The India biopesticides market is booming, projected to reach ₹237.3 Billion (USD 2847.6 million) by 2033, driven by growing demand for sustainable agriculture and stricter regulations. Learn about key market trends, leading companies, and regional growth forecasts in this comprehensive analysis.

                                                                        July 2025
                                                                        Base Year: 2024
                                                                        No Of Pages: 197
                                                                        Price: $3800

                                                                        Decoding Almond Market Consumer Preferences 2025-2033

                                                                        Discover the booming almond market! Explore its $10.12B valuation (2025), 5.55% CAGR, key drivers, trends, and regional insights. Learn about leading companies and diverse product types including almond butter, flour, and oil. Uncover future growth projections for the almond industry until 2033.

                                                                        July 2025
                                                                        Base Year: 2024
                                                                        No Of Pages: 234
                                                                        Price: $4750

                                                                        Bio Organic Fertilizer Market Insightful Market Analysis: Trends and Opportunities 2025-2033

                                                                        The global bio organic fertilizer market is booming, projected to reach [estimated 2033 value] by 2033 with a CAGR of 5.90%. Discover key market trends, drivers, restraints, and leading companies shaping this sustainable agriculture sector. Learn more about organic fertilizer types, applications, and regional market analysis.

                                                                        July 2025
                                                                        Base Year: 2024
                                                                        No Of Pages: 150
                                                                        Price: $4750

                                                                        Exploring Saudi Arabia Agriculture Market’s Market Size Dynamics 2025-2033

                                                                        Discover the booming Saudi Arabia agriculture market! Projected to reach \$28.3 billion by 2033 with a 5.2% CAGR, this report analyzes market size, key players (Carrefour, Lulu Group), regional trends, and growth drivers. Learn about opportunities and challenges in this dynamic sector.

                                                                        July 2025
                                                                        Base Year: 2024
                                                                        No Of Pages: 197
                                                                        Price: $3800

                                                                        Lentil Industry Charting Growth Trajectories 2025-2033: Strategic Insights and Forecasts

                                                                        Discover the booming lentil market! Explore key trends, regional insights, and leading companies driving growth in this $X billion industry (2025 estimate) projected to reach $X billion by 2033. Learn about the rising demand for whole, split, and dehulled lentils in dry, canned, and frozen forms. Get the complete market analysis now!

                                                                        July 2025
                                                                        Base Year: 2024
                                                                        No Of Pages: 234
                                                                        Price: $4750

                                                                        USA Agricultural Irrigation Machinery Market Soars to XXX Million, witnessing a CAGR of XX during the forecast period 2025-2033

                                                                        Discover the booming US agricultural irrigation machinery market! This in-depth analysis reveals key trends, growth drivers, and leading companies from 2025-2033. Learn about the impact of precision agriculture, water scarcity, and government initiatives on the market's future. Explore segments like drip, sprinkler, and pivot irrigation systems.

                                                                        July 2025
                                                                        Base Year: 2024
                                                                        No Of Pages: 150
                                                                        Price: $3800

                                                                        South America Biological Organic Fertilizers Industry 2025 to Grow at XX CAGR with XXX Million Market Size: Analysis and Forecasts 2033

                                                                        Discover the booming South American biological organic fertilizer market! Projected to reach [estimated 2033 value based on CAGR] by 2033, this market is driven by sustainable agriculture trends and growing demand for eco-friendly farming. Learn about key players, market segments (cereals, legumes, fruits & vegetables), and growth opportunities in Brazil, Argentina, and beyond.

                                                                        July 2025
                                                                        Base Year: 2024
                                                                        No Of Pages: 150
                                                                        Price: $4750

                                                                        Exploring Barriers in North American Olives Market Market: Trends and Analysis 2025-2033

                                                                        Discover the booming North American olives market! This comprehensive analysis reveals a $6.9B market with a 5.74% CAGR (2025-2033), driven by health trends & Mediterranean diet popularity. Explore market segmentation, key players (Napa Valley Olive Oil, Musco Family Olive Co., etc.), and future growth projections for olive oil, table olives, and more.

                                                                        July 2025
                                                                        Base Year: 2024
                                                                        No Of Pages: 180
                                                                        Price: $4750

                                                                        Analyzing Competitor Moves: Iran Agricultural Sector Analysis Growth Outlook 2025-2033

                                                                        Discover the growth opportunities and challenges within Iran's agricultural sector. This comprehensive analysis covers market size, CAGR, key drivers, trends, and regional variations across food crops, cash crops, fruits, vegetables, dairy, and fishery from 2019-2033. Gain valuable insights into this dynamic market.

                                                                        July 2025
                                                                        Base Year: 2024
                                                                        No Of Pages: 150
                                                                        Price: $3800

                                                                        South America Agricultual Films Market Market’s Drivers and Challenges: Strategic Overview 2025-2033

                                                                        Discover the booming South American agricultural films market! This in-depth analysis reveals a CAGR of 6.10% to 2033, driven by growing demand for modern farming techniques and food security. Explore key trends, leading companies (Dow, Agroflex, etc.), and regional insights for Brazil, Argentina, and beyond. Learn how this expanding market presents lucrative opportunities.

                                                                        July 2025
                                                                        Base Year: 2024
                                                                        No Of Pages: 150
                                                                        Price: $4750

                                                                        Analyzing Coffee Trade Analysis Industry: Opportunities and Growth Patterns 2025-2033

                                                                        Discover the latest insights into the booming global coffee trade market. This comprehensive analysis reveals key trends, growth drivers, and market segmentation for Arabica, Robusta, and various coffee processing methods. Explore regional market shares and leading companies like Starbucks & Nestlé. Project your business strategy with our 2025-2033 forecast.

                                                                        July 2025
                                                                        Base Year: 2024
                                                                        No Of Pages: 150
                                                                        Price: $4750

                                                                        Kiwi Fruit Market Insightful Market Analysis: Trends and Opportunities 2025-2033

                                                                        Discover the booming kiwi fruit market! This comprehensive analysis reveals a $1.89B market in 2025, projected to reach significant heights by 2033 with a 5.02% CAGR. Explore key drivers, regional trends, and leading companies shaping this dynamic industry.

                                                                        July 2025
                                                                        Base Year: 2024
                                                                        No Of Pages: 180
                                                                        Price: $4750

                                                                        Africa Chia Seeds Industry: Growth Opportunities and Competitive Landscape Overview 2025-2033

                                                                        Discover the booming Africa chia seeds market! Explore its $13.87M valuation (2025), 2.10% CAGR, key segments (organic, food & beverage, supplements), and leading companies. Learn about growth drivers, trends, and regional insights (South Africa, UAE) in this comprehensive market analysis.

                                                                        July 2025
                                                                        Base Year: 2024
                                                                        No Of Pages: 180
                                                                        Price: $4750

                                                                        China Pesticide Industry Market Report: Strategic Insights

                                                                        Discover the booming China pesticide market, projected to reach $XX million by 2025 and grow at a CAGR of 6.60% until 2033. Analyze key trends, leading companies (Bayer, Syngenta, UPL), and market segmentation (fungicides, herbicides, insecticides, etc.) impacting this dynamic sector.

                                                                        July 2025
                                                                        Base Year: 2024
                                                                        No Of Pages: 197
                                                                        Price: $3800

                                                                        Global Metal Chelates Market Future-proof Strategies: Trends, Competitor Dynamics, and Opportunities 2025-2033

                                                                        Discover the booming global metal chelates market! This comprehensive analysis reveals a CAGR of 10.20%, driven by surging demand for efficient micronutrient delivery in agriculture. Explore market size, segmentation (crop type, product type, application), key players, and regional trends for 2025-2033.

                                                                        July 2025
                                                                        Base Year: 2024
                                                                        No Of Pages: 197
                                                                        Price: $3800

                                                                        Fresh Cherries Industry CAGR Trends: Growth Outlook 2025-2033

                                                                        Discover the booming fresh cherries market! This in-depth analysis reveals key trends, drivers, and restraints, along with regional market share data and projections to 2033. Learn about leading companies and explore growth opportunities in this lucrative sector.

                                                                        July 2025
                                                                        Base Year: 2024
                                                                        No Of Pages: 180
                                                                        Price: $4750
                                                                        • Home
                                                                        • About Us
                                                                        • Industries
                                                                          • Aerospace & Defense
                                                                          • Agriculture
                                                                          • Animal Nutrition & Wellness
                                                                          • Automotive
                                                                          • Chemicals & Materials
                                                                          • Consumer Goods and Services
                                                                          • Energy & Power
                                                                          • Financial Services and Investment Intelligence
                                                                          • Food & Beverage
                                                                          • Home and Property Improvement
                                                                          • Hospitality and Tourism
                                                                          • Logistics
                                                                          • Manufacturing Products and Services
                                                                          • Packaging
                                                                          • Professional and Commercial Services
                                                                          • Real Estate and Construction
                                                                          • Retail
                                                                          • Technology, Media and Telecom
                                                                          • Healthcare
                                                                        • Services
                                                                        • Contact
                                                                        Main Logo
                                                                        • Home
                                                                        • About Us
                                                                        • Industries
                                                                          • Aerospace & Defense
                                                                          • Agriculture
                                                                          • Animal Nutrition & Wellness
                                                                          • Automotive
                                                                          • Chemicals & Materials
                                                                          • Consumer Goods and Services
                                                                          • Energy & Power
                                                                          • Financial Services and Investment Intelligence
                                                                          • Food & Beverage
                                                                          • Home and Property Improvement
                                                                          • Hospitality and Tourism
                                                                          • Logistics
                                                                          • Manufacturing Products and Services
                                                                          • Packaging
                                                                          • Professional and Commercial Services
                                                                          • Real Estate and Construction
                                                                          • Retail
                                                                          • Technology, Media and Telecom
                                                                          • Healthcare
                                                                        • Services
                                                                        • Contact
                                                                        +17162654855
                                                                        [email protected]

                                                                        +17162654855

                                                                        [email protected]

                                                                        Business Address

                                                                        Head Office

                                                                        Office no. A 5010, fifth floor, Solitaire Business Hub, Near Phoenix mall, Pune, Maharashtra 411014

                                                                        Contact Information

                                                                        Craig Francis

                                                                        Business Development Head

                                                                        +17162654855

                                                                        [email protected]

                                                                        Connect With Us

                                                                        Secure Payment Partners

                                                                        payment image
                                                                        RetailLogisticsPackagingAutomotiveHealthcareAgricultureEnergy & PowerFood & BeverageAerospace & DefenseChemicals & MaterialsHospitality and TourismAnimal Nutrition & WellnessConsumer Goods and ServicesReal Estate and ConstructionHome and Property ImprovementTechnology, Media and TelecomManufacturing Products and ServicesFinancial Services and Investment Intelligence

                                                                        © 2025 All rights reserved


                                                                        Privacy Policy
                                                                        Terms and Conditions
                                                                        FAQ