


Key Insights
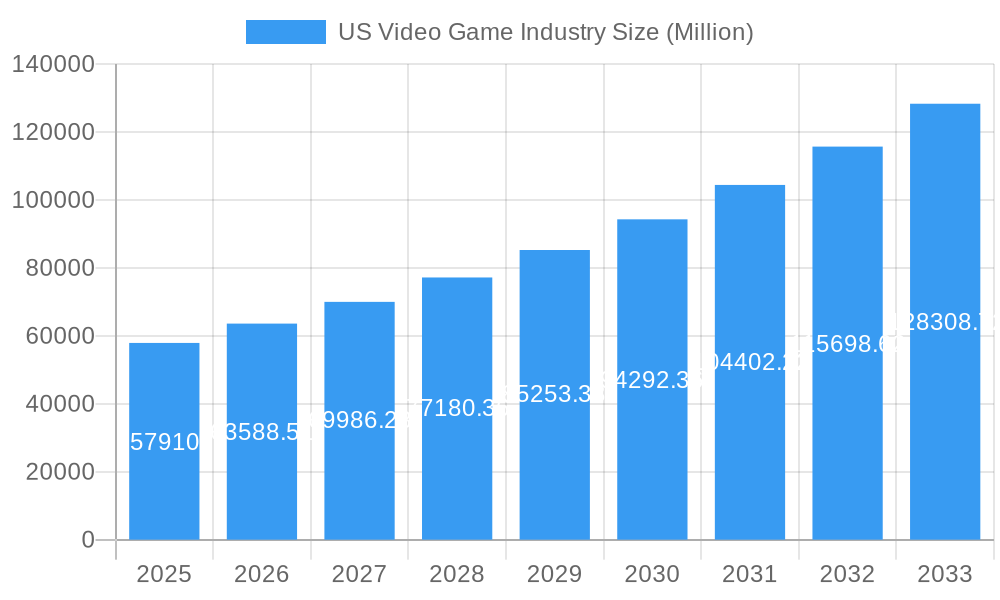
The US video game industry, a robust and dynamic sector, is projected to experience significant growth throughout the forecast period (2025-2033). With a 2025 market size of $57.91 billion, fueled by a compound annual growth rate (CAGR) of 9.41%, the industry's trajectory points towards substantial expansion. Key drivers include the increasing popularity of esports, the continuous advancement of gaming technology (VR/AR integration, enhanced graphics), and the broadening appeal across diverse demographics. Mobile gaming, a dominant segment, benefits from accessibility and consistent innovation, while console and PC gaming maintain strong positions, driven by dedicated player bases and the release of high-profile titles. The industry's growth isn't uniform across all segments. While mobile gaming is likely to experience a faster growth rate due to ease of access, the console and PC segments will likely maintain robust revenue streams driven by premium releases and engagement with dedicated communities. Competition is fierce, with major players like Activision Blizzard, Electronic Arts, Nintendo, Sony, and Microsoft constantly innovating to attract and retain players. Geographic variations exist within the US market, with regions such as the West Coast potentially showing higher growth due to existing technological hubs and a concentration of gaming studios and developers. Restraints to growth may include potential economic downturns impacting consumer spending and the challenge of maintaining consistent innovation to stay ahead of evolving consumer preferences. The industry’s successful navigation of these challenges will be crucial in sustaining its predicted growth trajectory.

US Video Game Industry Market Size (In Billion)

The segmentation of the market into mobile, console, and PC gaming reflects distinct consumer preferences and technological platforms. Mobile gaming, characterized by its accessibility and freemium models, is expected to be a key growth driver. The console and PC segments will continue to attract dedicated gamers drawn to high-fidelity graphics, immersive experiences, and extensive game libraries. The regional breakdown of the US market (Northeast, Southeast, Midwest, Southwest, West) showcases diverse market dynamics within the country, reflecting varying levels of technological adoption, income levels, and gaming culture. To maintain competitiveness, companies are focusing on enhancing user experiences, developing innovative monetization strategies (in-app purchases, subscriptions), and leveraging data analytics to understand player behavior. The successful integration of these strategies, coupled with continued technological advancements, will be pivotal in shaping the future growth of the US video game market.
US Video Game Industry Company Market Share
This comprehensive report provides an in-depth analysis of the US video game industry, covering market size, segmentation, key players, and future growth prospects. The study period spans from 2019 to 2033, with 2025 as the base and estimated year. The report leverages extensive data analysis and industry expertise to offer actionable insights for stakeholders across the value chain.
US Video Game Industry Market Concentration & Innovation
The US video game market exhibits a high degree of concentration, with a few dominant players controlling a significant share. Market share data for 2024 reveals that the top 5 companies hold approximately xx% of the market. This concentration is driven by substantial investments in game development, marketing, and distribution. Innovation is a key driver, with companies continuously pushing the boundaries of technology and game design. The regulatory landscape, while evolving, generally fosters innovation. The industry experiences substantial M&A activity, reflecting the drive for growth and consolidation. For example, Microsoft's acquisition of Activision Blizzard (announced April 2022) for $95 billion significantly altered the market landscape. Other key deals included [insert details of other M&A activities with values if available, otherwise use xx Million]. End-user trends, such as the increasing popularity of mobile gaming and esports, are shaping innovation and market dynamics. Product substitutes are limited, although alternative entertainment forms pose some indirect competitive pressure.
- Market Concentration: Top 5 companies hold approximately xx% of the market (2024).
- M&A Activity: Microsoft's acquisition of Activision Blizzard for $69 Billion (estimated value considering the final deal closure) significantly reshaped the landscape.
- Innovation Drivers: Technological advancements (VR/AR, AI), evolving consumer preferences, and competition.
- Regulatory Frameworks: The industry faces evolving regulations related to content, data privacy, and antitrust concerns.
US Video Game Industry Industry Trends & Insights
The US video game industry has experienced robust growth in recent years, driven by several factors. Technological advancements, such as the rise of mobile gaming and cloud gaming, have broadened access and opened new avenues for revenue generation. The industry's CAGR from 2019 to 2024 was xx%, with a projected CAGR of xx% from 2025 to 2033. This growth is further fueled by increasing smartphone penetration and consumer spending on entertainment. However, competitive pressures remain intense, as established players and new entrants vie for market share. Consumer preferences are shifting towards free-to-play models and subscription services, impacting the monetization strategies of game developers and publishers. The market penetration of mobile gaming is significantly high, at approximately xx% in 2024, showcasing its dominance compared to other segments. The emergence of esports has also created new revenue streams and broadened the industry's appeal.
Dominant Markets & Segments in US Video Game Industry
The US video game market is characterized by diverse segments, each exhibiting unique growth trajectories.
- Mobile Gaming: This segment dominates the market, driven by high smartphone penetration, accessibility, and diverse monetization models (in-app purchases, advertisements). Key monetization methods include in-app purchases, subscriptions, and rewarded video ads. Promotion strategies encompass social media marketing, influencer collaborations, and app store optimization. Market overview indicates an exceptionally high CAGR during the historical period.
- Console Gaming: While slightly less dominant than mobile, console gaming retains a substantial market share, fueled by high-quality graphics, immersive gameplay, and strong brand loyalty. This segment is characterized by significant upfront investment and a high reliance on physical and digital game sales.
- PC Browser/Downloaded: This segment maintains a considerable portion of the market, catering to a dedicated player base that values PC-specific titles and a highly customizable gaming experience. This segment benefits from the strong PC market and enjoys a loyal audience who prefer the capabilities that a PC gaming experience can offer.
Key Drivers for Dominance:
- Mobile Gaming: High smartphone penetration, ease of access, diverse monetization models.
- Console Gaming: High-quality graphics, immersive experiences, strong brand loyalty.
- PC Browser/Downloaded: Strong PC market, dedicated player base valuing customization.
US Video Game Industry Product Developments
The US video game industry is characterized by continuous product innovation, focusing on enhanced graphics, immersive gameplay, and multiplayer experiences. Technological advancements such as virtual reality (VR) and augmented reality (AR) are transforming the gaming experience, expanding game possibilities. Game developers are leveraging cloud computing to offer subscription-based services, expanding market reach, and reducing upfront hardware investments for gamers.
Report Scope & Segmentation Analysis
This report comprehensively covers the US video game market, segmented by game type: Mobile Gaming, Console Gaming, and PC Browser/Downloaded. Each segment's market size, growth projections, and competitive dynamics are analyzed. Growth projections for each segment from 2025 to 2033 are presented, alongside detailed analysis of competition and market factors.
Mobile Gaming: The mobile gaming segment is projected to experience robust growth due to increasing smartphone penetration and the widespread adoption of free-to-play models.
Console Gaming: The console gaming segment is anticipated to maintain steady growth, driven by the release of new consoles and high-quality game titles.
PC Browser/Downloaded: The PC gaming segment is expected to continue showing growth, but at a slightly slower rate, driven by loyal users and advancements in PC gaming technology.
Key Drivers of US Video Game Industry Growth
Several factors fuel the growth of the US video game industry. Technological advancements like VR/AR and cloud gaming are expanding access and experience. The rising disposable income of consumers, along with greater internet penetration, has increased spending on entertainment. Government support for the gaming industry, including tax incentives and initiatives promoting digital innovation, supports growth. Furthermore, the expanding esports sector is creating new revenue streams.
Challenges in the US Video Game Industry Sector
The US video game industry faces several challenges. Intense competition among established players and new entrants puts pressure on profit margins. Supply chain disruptions and increasing production costs affect game development and distribution. Furthermore, regulatory changes and concerns surrounding game content and data privacy impose compliance costs and could stifle innovation. The evolving regulatory environment, particularly surrounding loot boxes and other in-game purchases, poses challenges to monetization strategies.
Emerging Opportunities in US Video Game Industry
The US video game industry presents numerous emerging opportunities. Growth in VR/AR gaming presents new avenues for revenue generation and player engagement. The metaverse and Web3 gaming offer unique potential for innovation in gaming experiences. Furthermore, the growing popularity of esports and competitive gaming offers new opportunities for sponsorships and revenue generation. Expansion into new markets and demographic segments also presents opportunities.
Leading Players in the US Video Game Industry Market
Key Developments in US Video Game Industry Industry
- April 2022: Activision Blizzard, Inc. stockholders approved Microsoft Corporation's acquisition of the company for an estimated value of $69 Billion.
- May 2022: Electronic Arts partnered with Middle-earth Enterprises to develop a new free-to-play mobile game, The Lord of the Rings: Heroes of Middle-earth.
Strategic Outlook for US Video Game Industry Market
The US video game industry is poised for continued growth, driven by technological innovation, evolving consumer preferences, and the expansion of the esports market. New technologies like VR/AR and cloud gaming will reshape the gaming landscape, creating new opportunities for developers and publishers. The industry's focus on immersive experiences, social interaction, and cross-platform compatibility will continue to drive user engagement and market expansion, supporting strong growth over the forecast period.
US Video Game Industry Segmentation
-
1. Types
- 1.1. Mobile G
- 1.2. Console Gaming
- 1.3. PC Browser/Downloaded
-
2. Genre
- 2.1. Action
- 2.2. Adventure
- 2.3. Role-playing
- 2.4. Strategy
- 2.5. Simulation
- 2.6. sports
-
3. Platform
- 3.1. PC
- 3.2. console
- 3.3. Mobile device
-
4. Business model
- 4.1. Free-to-play
- 4.2. subscription-based
- 4.3. Pay-to-play
US Video Game Industry Segmentation By Geography
-
1. North America
- 1.1. United States
- 1.2. Canada
- 1.3. Mexico
-
2. South America
- 2.1. Brazil
- 2.2. Argentina
- 2.3. Rest of South America
-
3. Europe
- 3.1. United Kingdom
- 3.2. Germany
- 3.3. France
- 3.4. Italy
- 3.5. Spain
- 3.6. Russia
- 3.7. Benelux
- 3.8. Nordics
- 3.9. Rest of Europe
-
4. Middle East & Africa
- 4.1. Turkey
- 4.2. Israel
- 4.3. GCC
- 4.4. North Africa
- 4.5. South Africa
- 4.6. Rest of Middle East & Africa
-
5. Asia Pacific
- 5.1. China
- 5.2. India
- 5.3. Japan
- 5.4. South Korea
- 5.5. ASEAN
- 5.6. Oceania
- 5.7. Rest of Asia Pacific

US Video Game Industry Regional Market Share
Geographic Coverage of US Video Game Industry
US Video Game Industry REPORT HIGHLIGHTS
| Aspects | Details |
|---|---|
| Study Period | 2020-2034 |
| Base Year | 2025 |
| Estimated Year | 2026 |
| Forecast Period | 2026-2034 |
| Historical Period | 2020-2025 |
| Growth Rate | CAGR of 9.41% from 2020-2034 |
| Segmentation |
|
Table of Contents
- 1. Introduction
- 1.1. Research Scope
- 1.2. Market Segmentation
- 1.3. Research Methodology
- 1.4. Definitions and Assumptions
- 2. Executive Summary
- 2.1. Introduction
- 3. Market Dynamics
- 3.1. Introduction
- 3.2. Market Drivers
- 3.2.1. Growing Cloud Gaming subscriptions; Increasing trend fpr PVP format
- 3.3. Market Restrains
- 3.3.1. Huge capital investments in R&D
- 3.4. Market Trends
- 3.4.1. Mobile Gaming Segment Expected to Dominate the Market
- 4. Market Factor Analysis
- 4.1. Porters Five Forces
- 4.2. Supply/Value Chain
- 4.3. PESTEL analysis
- 4.4. Market Entropy
- 4.5. Patent/Trademark Analysis
- 5. Global US Video Game Industry Analysis, Insights and Forecast, 2020-2032
- 5.1. Market Analysis, Insights and Forecast - by Types
- 5.1.1. Mobile G
- 5.1.2. Console Gaming
- 5.1.3. PC Browser/Downloaded
- 5.2. Market Analysis, Insights and Forecast - by Genre
- 5.2.1. Action
- 5.2.2. Adventure
- 5.2.3. Role-playing
- 5.2.4. Strategy
- 5.2.5. Simulation
- 5.2.6. sports
- 5.3. Market Analysis, Insights and Forecast - by Platform
- 5.3.1. PC
- 5.3.2. console
- 5.3.3. Mobile device
- 5.4. Market Analysis, Insights and Forecast - by Business model
- 5.4.1. Free-to-play
- 5.4.2. subscription-based
- 5.4.3. Pay-to-play
- 5.5. Market Analysis, Insights and Forecast - by Region
- 5.5.1. North America
- 5.5.2. South America
- 5.5.3. Europe
- 5.5.4. Middle East & Africa
- 5.5.5. Asia Pacific
- 5.1. Market Analysis, Insights and Forecast - by Types
- 6. North America US Video Game Industry Analysis, Insights and Forecast, 2020-2032
- 6.1. Market Analysis, Insights and Forecast - by Types
- 6.1.1. Mobile G
- 6.1.2. Console Gaming
- 6.1.3. PC Browser/Downloaded
- 6.2. Market Analysis, Insights and Forecast - by Genre
- 6.2.1. Action
- 6.2.2. Adventure
- 6.2.3. Role-playing
- 6.2.4. Strategy
- 6.2.5. Simulation
- 6.2.6. sports
- 6.3. Market Analysis, Insights and Forecast - by Platform
- 6.3.1. PC
- 6.3.2. console
- 6.3.3. Mobile device
- 6.4. Market Analysis, Insights and Forecast - by Business model
- 6.4.1. Free-to-play
- 6.4.2. subscription-based
- 6.4.3. Pay-to-play
- 6.1. Market Analysis, Insights and Forecast - by Types
- 7. South America US Video Game Industry Analysis, Insights and Forecast, 2020-2032
- 7.1. Market Analysis, Insights and Forecast - by Types
- 7.1.1. Mobile G
- 7.1.2. Console Gaming
- 7.1.3. PC Browser/Downloaded
- 7.2. Market Analysis, Insights and Forecast - by Genre
- 7.2.1. Action
- 7.2.2. Adventure
- 7.2.3. Role-playing
- 7.2.4. Strategy
- 7.2.5. Simulation
- 7.2.6. sports
- 7.3. Market Analysis, Insights and Forecast - by Platform
- 7.3.1. PC
- 7.3.2. console
- 7.3.3. Mobile device
- 7.4. Market Analysis, Insights and Forecast - by Business model
- 7.4.1. Free-to-play
- 7.4.2. subscription-based
- 7.4.3. Pay-to-play
- 7.1. Market Analysis, Insights and Forecast - by Types
- 8. Europe US Video Game Industry Analysis, Insights and Forecast, 2020-2032
- 8.1. Market Analysis, Insights and Forecast - by Types
- 8.1.1. Mobile G
- 8.1.2. Console Gaming
- 8.1.3. PC Browser/Downloaded
- 8.2. Market Analysis, Insights and Forecast - by Genre
- 8.2.1. Action
- 8.2.2. Adventure
- 8.2.3. Role-playing
- 8.2.4. Strategy
- 8.2.5. Simulation
- 8.2.6. sports
- 8.3. Market Analysis, Insights and Forecast - by Platform
- 8.3.1. PC
- 8.3.2. console
- 8.3.3. Mobile device
- 8.4. Market Analysis, Insights and Forecast - by Business model
- 8.4.1. Free-to-play
- 8.4.2. subscription-based
- 8.4.3. Pay-to-play
- 8.1. Market Analysis, Insights and Forecast - by Types
- 9. Middle East & Africa US Video Game Industry Analysis, Insights and Forecast, 2020-2032
- 9.1. Market Analysis, Insights and Forecast - by Types
- 9.1.1. Mobile G
- 9.1.2. Console Gaming
- 9.1.3. PC Browser/Downloaded
- 9.2. Market Analysis, Insights and Forecast - by Genre
- 9.2.1. Action
- 9.2.2. Adventure
- 9.2.3. Role-playing
- 9.2.4. Strategy
- 9.2.5. Simulation
- 9.2.6. sports
- 9.3. Market Analysis, Insights and Forecast - by Platform
- 9.3.1. PC
- 9.3.2. console
- 9.3.3. Mobile device
- 9.4. Market Analysis, Insights and Forecast - by Business model
- 9.4.1. Free-to-play
- 9.4.2. subscription-based
- 9.4.3. Pay-to-play
- 9.1. Market Analysis, Insights and Forecast - by Types
- 10. Asia Pacific US Video Game Industry Analysis, Insights and Forecast, 2020-2032
- 10.1. Market Analysis, Insights and Forecast - by Types
- 10.1.1. Mobile G
- 10.1.2. Console Gaming
- 10.1.3. PC Browser/Downloaded
- 10.2. Market Analysis, Insights and Forecast - by Genre
- 10.2.1. Action
- 10.2.2. Adventure
- 10.2.3. Role-playing
- 10.2.4. Strategy
- 10.2.5. Simulation
- 10.2.6. sports
- 10.3. Market Analysis, Insights and Forecast - by Platform
- 10.3.1. PC
- 10.3.2. console
- 10.3.3. Mobile device
- 10.4. Market Analysis, Insights and Forecast - by Business model
- 10.4.1. Free-to-play
- 10.4.2. subscription-based
- 10.4.3. Pay-to-play
- 10.1. Market Analysis, Insights and Forecast - by Types
- 11. Competitive Analysis
- 11.1. Global Market Share Analysis 2025
- 11.2. Company Profiles
- 11.2.1 Zynga Inc
- 11.2.1.1. Overview
- 11.2.1.2. Products
- 11.2.1.3. SWOT Analysis
- 11.2.1.4. Recent Developments
- 11.2.1.5. Financials (Based on Availability)
- 11.2.2 Electronic Arts Inc
- 11.2.2.1. Overview
- 11.2.2.2. Products
- 11.2.2.3. SWOT Analysis
- 11.2.2.4. Recent Developments
- 11.2.2.5. Financials (Based on Availability)
- 11.2.3 BioWare
- 11.2.3.1. Overview
- 11.2.3.2. Products
- 11.2.3.3. SWOT Analysis
- 11.2.3.4. Recent Developments
- 11.2.3.5. Financials (Based on Availability)
- 11.2.4 Activision Blizzard Inc
- 11.2.4.1. Overview
- 11.2.4.2. Products
- 11.2.4.3. SWOT Analysis
- 11.2.4.4. Recent Developments
- 11.2.4.5. Financials (Based on Availability)
- 11.2.5 Microsoft Corporation
- 11.2.5.1. Overview
- 11.2.5.2. Products
- 11.2.5.3. SWOT Analysis
- 11.2.5.4. Recent Developments
- 11.2.5.5. Financials (Based on Availability)
- 11.2.6 Valve Corporation
- 11.2.6.1. Overview
- 11.2.6.2. Products
- 11.2.6.3. SWOT Analysis
- 11.2.6.4. Recent Developments
- 11.2.6.5. Financials (Based on Availability)
- 11.2.7 Ubisoft Entertainment SA
- 11.2.7.1. Overview
- 11.2.7.2. Products
- 11.2.7.3. SWOT Analysis
- 11.2.7.4. Recent Developments
- 11.2.7.5. Financials (Based on Availability)
- 11.2.8 Nintendo Co Ltd
- 11.2.8.1. Overview
- 11.2.8.2. Products
- 11.2.8.3. SWOT Analysis
- 11.2.8.4. Recent Developments
- 11.2.8.5. Financials (Based on Availability)
- 11.2.9 Take-Two Interactive Software Inc
- 11.2.9.1. Overview
- 11.2.9.2. Products
- 11.2.9.3. SWOT Analysis
- 11.2.9.4. Recent Developments
- 11.2.9.5. Financials (Based on Availability)
- 11.2.10 Sony Corporation
- 11.2.10.1. Overview
- 11.2.10.2. Products
- 11.2.10.3. SWOT Analysis
- 11.2.10.4. Recent Developments
- 11.2.10.5. Financials (Based on Availability)
- 11.2.1 Zynga Inc
List of Figures
- Figure 1: Global US Video Game Industry Revenue Breakdown (Million, %) by Region 2025 & 2033
- Figure 2: Global US Video Game Industry Volume Breakdown (K Unit, %) by Region 2025 & 2033
- Figure 3: North America US Video Game Industry Revenue (Million), by Types 2025 & 2033
- Figure 4: North America US Video Game Industry Volume (K Unit), by Types 2025 & 2033
- Figure 5: North America US Video Game Industry Revenue Share (%), by Types 2025 & 2033
- Figure 6: North America US Video Game Industry Volume Share (%), by Types 2025 & 2033
- Figure 7: North America US Video Game Industry Revenue (Million), by Genre 2025 & 2033
- Figure 8: North America US Video Game Industry Volume (K Unit), by Genre 2025 & 2033
- Figure 9: North America US Video Game Industry Revenue Share (%), by Genre 2025 & 2033
- Figure 10: North America US Video Game Industry Volume Share (%), by Genre 2025 & 2033
- Figure 11: North America US Video Game Industry Revenue (Million), by Platform 2025 & 2033
- Figure 12: North America US Video Game Industry Volume (K Unit), by Platform 2025 & 2033
- Figure 13: North America US Video Game Industry Revenue Share (%), by Platform 2025 & 2033
- Figure 14: North America US Video Game Industry Volume Share (%), by Platform 2025 & 2033
- Figure 15: North America US Video Game Industry Revenue (Million), by Business model 2025 & 2033
- Figure 16: North America US Video Game Industry Volume (K Unit), by Business model 2025 & 2033
- Figure 17: North America US Video Game Industry Revenue Share (%), by Business model 2025 & 2033
- Figure 18: North America US Video Game Industry Volume Share (%), by Business model 2025 & 2033
- Figure 19: North America US Video Game Industry Revenue (Million), by Country 2025 & 2033
- Figure 20: North America US Video Game Industry Volume (K Unit), by Country 2025 & 2033
- Figure 21: North America US Video Game Industry Revenue Share (%), by Country 2025 & 2033
- Figure 22: North America US Video Game Industry Volume Share (%), by Country 2025 & 2033
- Figure 23: South America US Video Game Industry Revenue (Million), by Types 2025 & 2033
- Figure 24: South America US Video Game Industry Volume (K Unit), by Types 2025 & 2033
- Figure 25: South America US Video Game Industry Revenue Share (%), by Types 2025 & 2033
- Figure 26: South America US Video Game Industry Volume Share (%), by Types 2025 & 2033
- Figure 27: South America US Video Game Industry Revenue (Million), by Genre 2025 & 2033
- Figure 28: South America US Video Game Industry Volume (K Unit), by Genre 2025 & 2033
- Figure 29: South America US Video Game Industry Revenue Share (%), by Genre 2025 & 2033
- Figure 30: South America US Video Game Industry Volume Share (%), by Genre 2025 & 2033
- Figure 31: South America US Video Game Industry Revenue (Million), by Platform 2025 & 2033
- Figure 32: South America US Video Game Industry Volume (K Unit), by Platform 2025 & 2033
- Figure 33: South America US Video Game Industry Revenue Share (%), by Platform 2025 & 2033
- Figure 34: South America US Video Game Industry Volume Share (%), by Platform 2025 & 2033
- Figure 35: South America US Video Game Industry Revenue (Million), by Business model 2025 & 2033
- Figure 36: South America US Video Game Industry Volume (K Unit), by Business model 2025 & 2033
- Figure 37: South America US Video Game Industry Revenue Share (%), by Business model 2025 & 2033
- Figure 38: South America US Video Game Industry Volume Share (%), by Business model 2025 & 2033
- Figure 39: South America US Video Game Industry Revenue (Million), by Country 2025 & 2033
- Figure 40: South America US Video Game Industry Volume (K Unit), by Country 2025 & 2033
- Figure 41: South America US Video Game Industry Revenue Share (%), by Country 2025 & 2033
- Figure 42: South America US Video Game Industry Volume Share (%), by Country 2025 & 2033
- Figure 43: Europe US Video Game Industry Revenue (Million), by Types 2025 & 2033
- Figure 44: Europe US Video Game Industry Volume (K Unit), by Types 2025 & 2033
- Figure 45: Europe US Video Game Industry Revenue Share (%), by Types 2025 & 2033
- Figure 46: Europe US Video Game Industry Volume Share (%), by Types 2025 & 2033
- Figure 47: Europe US Video Game Industry Revenue (Million), by Genre 2025 & 2033
- Figure 48: Europe US Video Game Industry Volume (K Unit), by Genre 2025 & 2033
- Figure 49: Europe US Video Game Industry Revenue Share (%), by Genre 2025 & 2033
- Figure 50: Europe US Video Game Industry Volume Share (%), by Genre 2025 & 2033
- Figure 51: Europe US Video Game Industry Revenue (Million), by Platform 2025 & 2033
- Figure 52: Europe US Video Game Industry Volume (K Unit), by Platform 2025 & 2033
- Figure 53: Europe US Video Game Industry Revenue Share (%), by Platform 2025 & 2033
- Figure 54: Europe US Video Game Industry Volume Share (%), by Platform 2025 & 2033
- Figure 55: Europe US Video Game Industry Revenue (Million), by Business model 2025 & 2033
- Figure 56: Europe US Video Game Industry Volume (K Unit), by Business model 2025 & 2033
- Figure 57: Europe US Video Game Industry Revenue Share (%), by Business model 2025 & 2033
- Figure 58: Europe US Video Game Industry Volume Share (%), by Business model 2025 & 2033
- Figure 59: Europe US Video Game Industry Revenue (Million), by Country 2025 & 2033
- Figure 60: Europe US Video Game Industry Volume (K Unit), by Country 2025 & 2033
- Figure 61: Europe US Video Game Industry Revenue Share (%), by Country 2025 & 2033
- Figure 62: Europe US Video Game Industry Volume Share (%), by Country 2025 & 2033
- Figure 63: Middle East & Africa US Video Game Industry Revenue (Million), by Types 2025 & 2033
- Figure 64: Middle East & Africa US Video Game Industry Volume (K Unit), by Types 2025 & 2033
- Figure 65: Middle East & Africa US Video Game Industry Revenue Share (%), by Types 2025 & 2033
- Figure 66: Middle East & Africa US Video Game Industry Volume Share (%), by Types 2025 & 2033
- Figure 67: Middle East & Africa US Video Game Industry Revenue (Million), by Genre 2025 & 2033
- Figure 68: Middle East & Africa US Video Game Industry Volume (K Unit), by Genre 2025 & 2033
- Figure 69: Middle East & Africa US Video Game Industry Revenue Share (%), by Genre 2025 & 2033
- Figure 70: Middle East & Africa US Video Game Industry Volume Share (%), by Genre 2025 & 2033
- Figure 71: Middle East & Africa US Video Game Industry Revenue (Million), by Platform 2025 & 2033
- Figure 72: Middle East & Africa US Video Game Industry Volume (K Unit), by Platform 2025 & 2033
- Figure 73: Middle East & Africa US Video Game Industry Revenue Share (%), by Platform 2025 & 2033
- Figure 74: Middle East & Africa US Video Game Industry Volume Share (%), by Platform 2025 & 2033
- Figure 75: Middle East & Africa US Video Game Industry Revenue (Million), by Business model 2025 & 2033
- Figure 76: Middle East & Africa US Video Game Industry Volume (K Unit), by Business model 2025 & 2033
- Figure 77: Middle East & Africa US Video Game Industry Revenue Share (%), by Business model 2025 & 2033
- Figure 78: Middle East & Africa US Video Game Industry Volume Share (%), by Business model 2025 & 2033
- Figure 79: Middle East & Africa US Video Game Industry Revenue (Million), by Country 2025 & 2033
- Figure 80: Middle East & Africa US Video Game Industry Volume (K Unit), by Country 2025 & 2033
- Figure 81: Middle East & Africa US Video Game Industry Revenue Share (%), by Country 2025 & 2033
- Figure 82: Middle East & Africa US Video Game Industry Volume Share (%), by Country 2025 & 2033
- Figure 83: Asia Pacific US Video Game Industry Revenue (Million), by Types 2025 & 2033
- Figure 84: Asia Pacific US Video Game Industry Volume (K Unit), by Types 2025 & 2033
- Figure 85: Asia Pacific US Video Game Industry Revenue Share (%), by Types 2025 & 2033
- Figure 86: Asia Pacific US Video Game Industry Volume Share (%), by Types 2025 & 2033
- Figure 87: Asia Pacific US Video Game Industry Revenue (Million), by Genre 2025 & 2033
- Figure 88: Asia Pacific US Video Game Industry Volume (K Unit), by Genre 2025 & 2033
- Figure 89: Asia Pacific US Video Game Industry Revenue Share (%), by Genre 2025 & 2033
- Figure 90: Asia Pacific US Video Game Industry Volume Share (%), by Genre 2025 & 2033
- Figure 91: Asia Pacific US Video Game Industry Revenue (Million), by Platform 2025 & 2033
- Figure 92: Asia Pacific US Video Game Industry Volume (K Unit), by Platform 2025 & 2033
- Figure 93: Asia Pacific US Video Game Industry Revenue Share (%), by Platform 2025 & 2033
- Figure 94: Asia Pacific US Video Game Industry Volume Share (%), by Platform 2025 & 2033
- Figure 95: Asia Pacific US Video Game Industry Revenue (Million), by Business model 2025 & 2033
- Figure 96: Asia Pacific US Video Game Industry Volume (K Unit), by Business model 2025 & 2033
- Figure 97: Asia Pacific US Video Game Industry Revenue Share (%), by Business model 2025 & 2033
- Figure 98: Asia Pacific US Video Game Industry Volume Share (%), by Business model 2025 & 2033
- Figure 99: Asia Pacific US Video Game Industry Revenue (Million), by Country 2025 & 2033
- Figure 100: Asia Pacific US Video Game Industry Volume (K Unit), by Country 2025 & 2033
- Figure 101: Asia Pacific US Video Game Industry Revenue Share (%), by Country 2025 & 2033
- Figure 102: Asia Pacific US Video Game Industry Volume Share (%), by Country 2025 & 2033
List of Tables
- Table 1: Global US Video Game Industry Revenue Million Forecast, by Types 2020 & 2033
- Table 2: Global US Video Game Industry Volume K Unit Forecast, by Types 2020 & 2033
- Table 3: Global US Video Game Industry Revenue Million Forecast, by Genre 2020 & 2033
- Table 4: Global US Video Game Industry Volume K Unit Forecast, by Genre 2020 & 2033
- Table 5: Global US Video Game Industry Revenue Million Forecast, by Platform 2020 & 2033
- Table 6: Global US Video Game Industry Volume K Unit Forecast, by Platform 2020 & 2033
- Table 7: Global US Video Game Industry Revenue Million Forecast, by Business model 2020 & 2033
- Table 8: Global US Video Game Industry Volume K Unit Forecast, by Business model 2020 & 2033
- Table 9: Global US Video Game Industry Revenue Million Forecast, by Region 2020 & 2033
- Table 10: Global US Video Game Industry Volume K Unit Forecast, by Region 2020 & 2033
- Table 11: Global US Video Game Industry Revenue Million Forecast, by Types 2020 & 2033
- Table 12: Global US Video Game Industry Volume K Unit Forecast, by Types 2020 & 2033
- Table 13: Global US Video Game Industry Revenue Million Forecast, by Genre 2020 & 2033
- Table 14: Global US Video Game Industry Volume K Unit Forecast, by Genre 2020 & 2033
- Table 15: Global US Video Game Industry Revenue Million Forecast, by Platform 2020 & 2033
- Table 16: Global US Video Game Industry Volume K Unit Forecast, by Platform 2020 & 2033
- Table 17: Global US Video Game Industry Revenue Million Forecast, by Business model 2020 & 2033
- Table 18: Global US Video Game Industry Volume K Unit Forecast, by Business model 2020 & 2033
- Table 19: Global US Video Game Industry Revenue Million Forecast, by Country 2020 & 2033
- Table 20: Global US Video Game Industry Volume K Unit Forecast, by Country 2020 & 2033
- Table 21: United States US Video Game Industry Revenue (Million) Forecast, by Application 2020 & 2033
- Table 22: United States US Video Game Industry Volume (K Unit) Forecast, by Application 2020 & 2033
- Table 23: Canada US Video Game Industry Revenue (Million) Forecast, by Application 2020 & 2033
- Table 24: Canada US Video Game Industry Volume (K Unit) Forecast, by Application 2020 & 2033
- Table 25: Mexico US Video Game Industry Revenue (Million) Forecast, by Application 2020 & 2033
- Table 26: Mexico US Video Game Industry Volume (K Unit) Forecast, by Application 2020 & 2033
- Table 27: Global US Video Game Industry Revenue Million Forecast, by Types 2020 & 2033
- Table 28: Global US Video Game Industry Volume K Unit Forecast, by Types 2020 & 2033
- Table 29: Global US Video Game Industry Revenue Million Forecast, by Genre 2020 & 2033
- Table 30: Global US Video Game Industry Volume K Unit Forecast, by Genre 2020 & 2033
- Table 31: Global US Video Game Industry Revenue Million Forecast, by Platform 2020 & 2033
- Table 32: Global US Video Game Industry Volume K Unit Forecast, by Platform 2020 & 2033
- Table 33: Global US Video Game Industry Revenue Million Forecast, by Business model 2020 & 2033
- Table 34: Global US Video Game Industry Volume K Unit Forecast, by Business model 2020 & 2033
- Table 35: Global US Video Game Industry Revenue Million Forecast, by Country 2020 & 2033
- Table 36: Global US Video Game Industry Volume K Unit Forecast, by Country 2020 & 2033
- Table 37: Brazil US Video Game Industry Revenue (Million) Forecast, by Application 2020 & 2033
- Table 38: Brazil US Video Game Industry Volume (K Unit) Forecast, by Application 2020 & 2033
- Table 39: Argentina US Video Game Industry Revenue (Million) Forecast, by Application 2020 & 2033
- Table 40: Argentina US Video Game Industry Volume (K Unit) Forecast, by Application 2020 & 2033
- Table 41: Rest of South America US Video Game Industry Revenue (Million) Forecast, by Application 2020 & 2033
- Table 42: Rest of South America US Video Game Industry Volume (K Unit) Forecast, by Application 2020 & 2033
- Table 43: Global US Video Game Industry Revenue Million Forecast, by Types 2020 & 2033
- Table 44: Global US Video Game Industry Volume K Unit Forecast, by Types 2020 & 2033
- Table 45: Global US Video Game Industry Revenue Million Forecast, by Genre 2020 & 2033
- Table 46: Global US Video Game Industry Volume K Unit Forecast, by Genre 2020 & 2033
- Table 47: Global US Video Game Industry Revenue Million Forecast, by Platform 2020 & 2033
- Table 48: Global US Video Game Industry Volume K Unit Forecast, by Platform 2020 & 2033
- Table 49: Global US Video Game Industry Revenue Million Forecast, by Business model 2020 & 2033
- Table 50: Global US Video Game Industry Volume K Unit Forecast, by Business model 2020 & 2033
- Table 51: Global US Video Game Industry Revenue Million Forecast, by Country 2020 & 2033
- Table 52: Global US Video Game Industry Volume K Unit Forecast, by Country 2020 & 2033
- Table 53: United Kingdom US Video Game Industry Revenue (Million) Forecast, by Application 2020 & 2033
- Table 54: United Kingdom US Video Game Industry Volume (K Unit) Forecast, by Application 2020 & 2033
- Table 55: Germany US Video Game Industry Revenue (Million) Forecast, by Application 2020 & 2033
- Table 56: Germany US Video Game Industry Volume (K Unit) Forecast, by Application 2020 & 2033
- Table 57: France US Video Game Industry Revenue (Million) Forecast, by Application 2020 & 2033
- Table 58: France US Video Game Industry Volume (K Unit) Forecast, by Application 2020 & 2033
- Table 59: Italy US Video Game Industry Revenue (Million) Forecast, by Application 2020 & 2033
- Table 60: Italy US Video Game Industry Volume (K Unit) Forecast, by Application 2020 & 2033
- Table 61: Spain US Video Game Industry Revenue (Million) Forecast, by Application 2020 & 2033
- Table 62: Spain US Video Game Industry Volume (K Unit) Forecast, by Application 2020 & 2033
- Table 63: Russia US Video Game Industry Revenue (Million) Forecast, by Application 2020 & 2033
- Table 64: Russia US Video Game Industry Volume (K Unit) Forecast, by Application 2020 & 2033
- Table 65: Benelux US Video Game Industry Revenue (Million) Forecast, by Application 2020 & 2033
- Table 66: Benelux US Video Game Industry Volume (K Unit) Forecast, by Application 2020 & 2033
- Table 67: Nordics US Video Game Industry Revenue (Million) Forecast, by Application 2020 & 2033
- Table 68: Nordics US Video Game Industry Volume (K Unit) Forecast, by Application 2020 & 2033
- Table 69: Rest of Europe US Video Game Industry Revenue (Million) Forecast, by Application 2020 & 2033
- Table 70: Rest of Europe US Video Game Industry Volume (K Unit) Forecast, by Application 2020 & 2033
- Table 71: Global US Video Game Industry Revenue Million Forecast, by Types 2020 & 2033
- Table 72: Global US Video Game Industry Volume K Unit Forecast, by Types 2020 & 2033
- Table 73: Global US Video Game Industry Revenue Million Forecast, by Genre 2020 & 2033
- Table 74: Global US Video Game Industry Volume K Unit Forecast, by Genre 2020 & 2033
- Table 75: Global US Video Game Industry Revenue Million Forecast, by Platform 2020 & 2033
- Table 76: Global US Video Game Industry Volume K Unit Forecast, by Platform 2020 & 2033
- Table 77: Global US Video Game Industry Revenue Million Forecast, by Business model 2020 & 2033
- Table 78: Global US Video Game Industry Volume K Unit Forecast, by Business model 2020 & 2033
- Table 79: Global US Video Game Industry Revenue Million Forecast, by Country 2020 & 2033
- Table 80: Global US Video Game Industry Volume K Unit Forecast, by Country 2020 & 2033
- Table 81: Turkey US Video Game Industry Revenue (Million) Forecast, by Application 2020 & 2033
- Table 82: Turkey US Video Game Industry Volume (K Unit) Forecast, by Application 2020 & 2033
- Table 83: Israel US Video Game Industry Revenue (Million) Forecast, by Application 2020 & 2033
- Table 84: Israel US Video Game Industry Volume (K Unit) Forecast, by Application 2020 & 2033
- Table 85: GCC US Video Game Industry Revenue (Million) Forecast, by Application 2020 & 2033
- Table 86: GCC US Video Game Industry Volume (K Unit) Forecast, by Application 2020 & 2033
- Table 87: North Africa US Video Game Industry Revenue (Million) Forecast, by Application 2020 & 2033
- Table 88: North Africa US Video Game Industry Volume (K Unit) Forecast, by Application 2020 & 2033
- Table 89: South Africa US Video Game Industry Revenue (Million) Forecast, by Application 2020 & 2033
- Table 90: South Africa US Video Game Industry Volume (K Unit) Forecast, by Application 2020 & 2033
- Table 91: Rest of Middle East & Africa US Video Game Industry Revenue (Million) Forecast, by Application 2020 & 2033
- Table 92: Rest of Middle East & Africa US Video Game Industry Volume (K Unit) Forecast, by Application 2020 & 2033
- Table 93: Global US Video Game Industry Revenue Million Forecast, by Types 2020 & 2033
- Table 94: Global US Video Game Industry Volume K Unit Forecast, by Types 2020 & 2033
- Table 95: Global US Video Game Industry Revenue Million Forecast, by Genre 2020 & 2033
- Table 96: Global US Video Game Industry Volume K Unit Forecast, by Genre 2020 & 2033
- Table 97: Global US Video Game Industry Revenue Million Forecast, by Platform 2020 & 2033
- Table 98: Global US Video Game Industry Volume K Unit Forecast, by Platform 2020 & 2033
- Table 99: Global US Video Game Industry Revenue Million Forecast, by Business model 2020 & 2033
- Table 100: Global US Video Game Industry Volume K Unit Forecast, by Business model 2020 & 2033
- Table 101: Global US Video Game Industry Revenue Million Forecast, by Country 2020 & 2033
- Table 102: Global US Video Game Industry Volume K Unit Forecast, by Country 2020 & 2033
- Table 103: China US Video Game Industry Revenue (Million) Forecast, by Application 2020 & 2033
- Table 104: China US Video Game Industry Volume (K Unit) Forecast, by Application 2020 & 2033
- Table 105: India US Video Game Industry Revenue (Million) Forecast, by Application 2020 & 2033
- Table 106: India US Video Game Industry Volume (K Unit) Forecast, by Application 2020 & 2033
- Table 107: Japan US Video Game Industry Revenue (Million) Forecast, by Application 2020 & 2033
- Table 108: Japan US Video Game Industry Volume (K Unit) Forecast, by Application 2020 & 2033
- Table 109: South Korea US Video Game Industry Revenue (Million) Forecast, by Application 2020 & 2033
- Table 110: South Korea US Video Game Industry Volume (K Unit) Forecast, by Application 2020 & 2033
- Table 111: ASEAN US Video Game Industry Revenue (Million) Forecast, by Application 2020 & 2033
- Table 112: ASEAN US Video Game Industry Volume (K Unit) Forecast, by Application 2020 & 2033
- Table 113: Oceania US Video Game Industry Revenue (Million) Forecast, by Application 2020 & 2033
- Table 114: Oceania US Video Game Industry Volume (K Unit) Forecast, by Application 2020 & 2033
- Table 115: Rest of Asia Pacific US Video Game Industry Revenue (Million) Forecast, by Application 2020 & 2033
- Table 116: Rest of Asia Pacific US Video Game Industry Volume (K Unit) Forecast, by Application 2020 & 2033
Frequently Asked Questions
1. What is the projected Compound Annual Growth Rate (CAGR) of the US Video Game Industry?
The projected CAGR is approximately 9.41%.
2. Which companies are prominent players in the US Video Game Industry?
Key companies in the market include Zynga Inc, Electronic Arts Inc, BioWare, Activision Blizzard Inc, Microsoft Corporation, Valve Corporation, Ubisoft Entertainment SA, Nintendo Co Ltd, Take-Two Interactive Software Inc, Sony Corporation.
3. What are the main segments of the US Video Game Industry?
The market segments include Types, Genre, Platform, Business model.
4. Can you provide details about the market size?
The market size is estimated to be USD 57.91 Million as of 2022.
5. What are some drivers contributing to market growth?
Growing Cloud Gaming subscriptions; Increasing trend fpr PVP format.
6. What are the notable trends driving market growth?
Mobile Gaming Segment Expected to Dominate the Market.
7. Are there any restraints impacting market growth?
Huge capital investments in R&D.
8. Can you provide examples of recent developments in the market?
May 2022: Electronic Arts has partnered with Middle-earth Enterprises, a division of The Saul Zaentz Company, to develop a new free-to-play mobile game. The Lord of the Rings: Heroes of Middle-earth is a Collectible Role-Playing Game (RPG) that brings the fantasy and adventure of The Lord of the Rings to existing fans and new audiences alike in a strategic, social-competitive experience.
9. What pricing options are available for accessing the report?
Pricing options include single-user, multi-user, and enterprise licenses priced at USD 3800, USD 4500, and USD 5800 respectively.
10. Is the market size provided in terms of value or volume?
The market size is provided in terms of value, measured in Million and volume, measured in K Unit.
11. Are there any specific market keywords associated with the report?
Yes, the market keyword associated with the report is "US Video Game Industry," which aids in identifying and referencing the specific market segment covered.
12. How do I determine which pricing option suits my needs best?
The pricing options vary based on user requirements and access needs. Individual users may opt for single-user licenses, while businesses requiring broader access may choose multi-user or enterprise licenses for cost-effective access to the report.
13. Are there any additional resources or data provided in the US Video Game Industry report?
While the report offers comprehensive insights, it's advisable to review the specific contents or supplementary materials provided to ascertain if additional resources or data are available.
14. How can I stay updated on further developments or reports in the US Video Game Industry?
To stay informed about further developments, trends, and reports in the US Video Game Industry, consider subscribing to industry newsletters, following relevant companies and organizations, or regularly checking reputable industry news sources and publications.
Methodology
Step 1 - Identification of Relevant Samples Size from Population Database


Step 2 - Approaches for Defining Global Market Size (Value, Volume* & Price*)

Note*: In applicable scenarios
Step 3 - Data Sources
Primary Research
- Web Analytics
- Survey Reports
- Research Institute
- Latest Research Reports
- Opinion Leaders
Secondary Research
- Annual Reports
- White Paper
- Latest Press Release
- Industry Association
- Paid Database
- Investor Presentations

Step 4 - Data Triangulation
Involves using different sources of information in order to increase the validity of a study
These sources are likely to be stakeholders in a program - participants, other researchers, program staff, other community members, and so on.
Then we put all data in single framework & apply various statistical tools to find out the dynamic on the market.
During the analysis stage, feedback from the stakeholder groups would be compared to determine areas of agreement as well as areas of divergence