
Key Insights
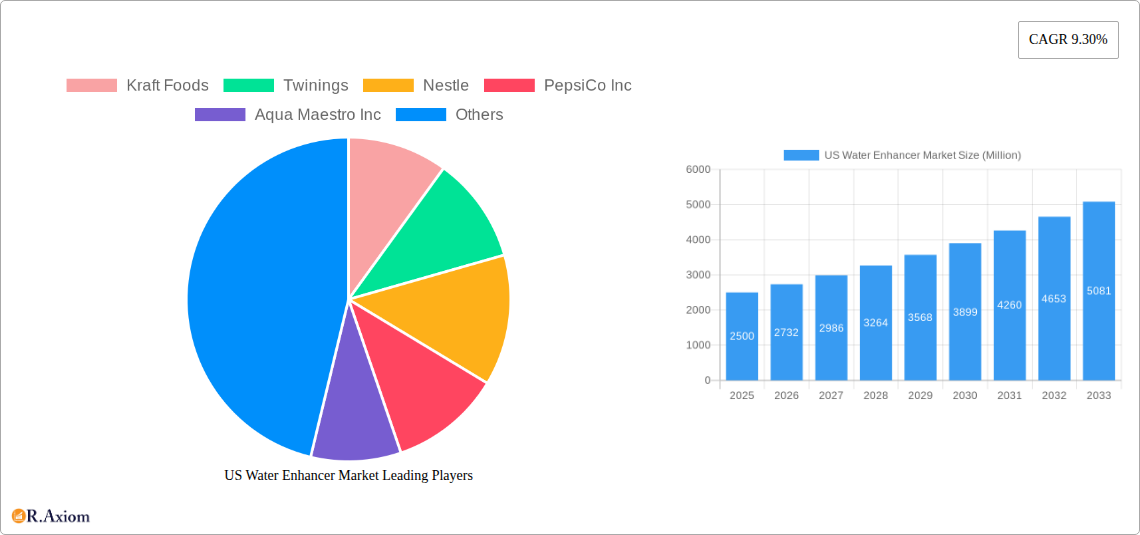
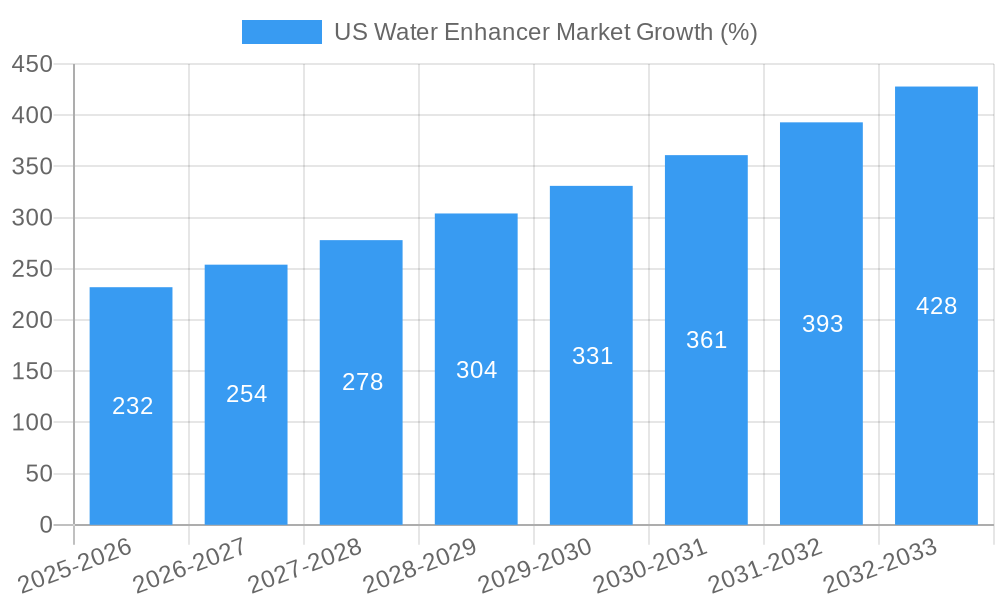
The US water enhancer market, valued at approximately $2.5 billion in 2025, is projected to experience robust growth, exhibiting a compound annual growth rate (CAGR) of 9.3% from 2025 to 2033. This expansion is fueled by several key drivers. A rising health-conscious population increasingly seeks healthier beverage alternatives, driving demand for low-calorie, sugar-free, and naturally flavored options. The convenience factor of water enhancers, offering effortless flavor customization and portability, also contributes significantly to market growth. Furthermore, the expanding distribution network, encompassing pharmacies, health stores, supermarkets, convenience stores, and a rapidly growing online presence, ensures wide accessibility for consumers. Specific product trends include a surge in demand for functional water enhancers incorporating vitamins, minerals, and antioxidants, catering to the growing wellness segment. However, market growth might be slightly constrained by potential consumer perception concerns regarding artificial sweeteners and additives, despite the increasing availability of natural alternatives.
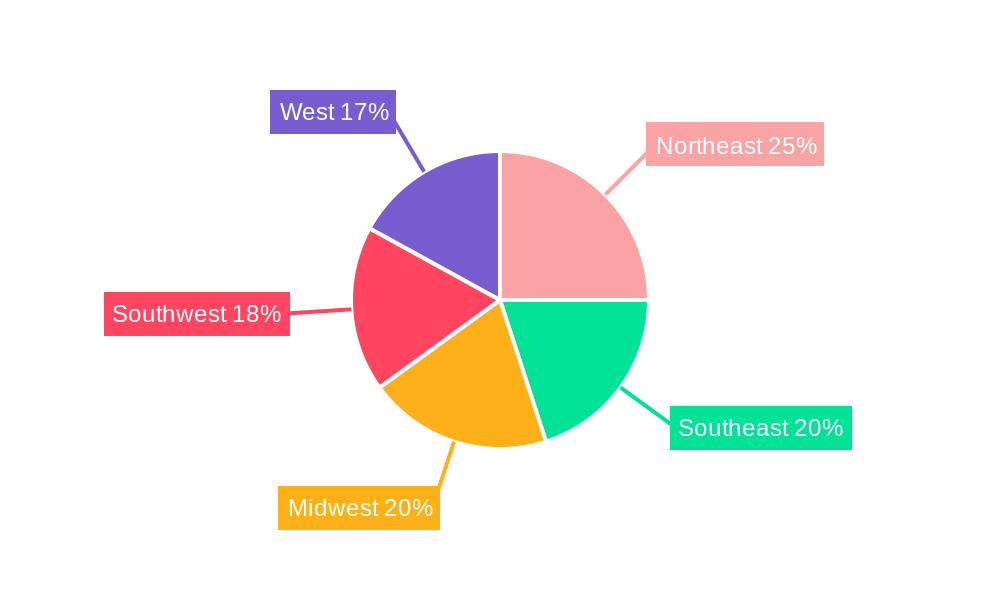
The market segmentation reveals significant contribution from various distribution channels. While supermarkets and hypermarkets maintain a leading position, the online channel demonstrates particularly strong growth potential, driven by increased e-commerce penetration and convenience. Leading brands like Kraft Foods, Nestle, PepsiCo, and Coca-Cola are key players, constantly innovating with new flavors and functional benefits to maintain a competitive edge. Regional variations in consumption patterns are observed, likely influenced by demographic differences and regional preferences. The Northeast and West Coast, known for higher health consciousness, potentially show greater per capita consumption. The projected market size for 2033, extrapolated from the 9.3% CAGR, points toward a substantially larger market, indicating substantial future opportunities for established players and new entrants alike.
US Water Enhancer Market: A Comprehensive Report (2019-2033)
This comprehensive report provides an in-depth analysis of the US Water Enhancer Market, covering market size, growth drivers, challenges, opportunities, and key players. The study period spans from 2019 to 2033, with 2025 serving as the base and estimated year. The forecast period is 2025-2033, and the historical period covers 2019-2024. This report is essential for industry stakeholders, investors, and market entrants seeking to understand and capitalize on the dynamic US water enhancer market.
US Water Enhancer Market Market Concentration & Innovation
The US water enhancer market exhibits a moderately concentrated landscape, with key players like Kraft Foods, Twinings, Nestle, PepsiCo Inc, and The Coca-Cola Company holding significant market share. Precise market share figures for 2025 are estimated at xx%, xx%, xx%, xx%, and xx% respectively, reflecting ongoing competition. Smaller players, including Aqua Maestro Inc, True Citrus, AriZona Beverages USA LLC, and Avitae, contribute to the market's vibrancy through niche offerings and innovation. The market concentration ratio (CR4) is estimated at xx% in 2025.
Innovation in the water enhancer market is driven by consumer demand for healthier, more convenient, and better-tasting options. This translates into a focus on natural ingredients, low-calorie formulations, and functional benefits such as enhanced hydration or added vitamins. Recent product launches include enhanced water with added electrolytes and functional water enhancers. Regulatory frameworks such as FDA guidelines regarding labeling and ingredient safety are crucial to the industry. Product substitutes include ready-to-drink flavored waters and other beverages, posing ongoing competitive pressure. Mergers and acquisitions (M&A) activity has been relatively moderate in recent years, with deal values averaging approximately $xx Million annually over the period of 2019-2024. Future M&A activity is expected to be driven by efforts to expand product portfolios and access new distribution channels. End-user trends indicate a preference for convenient packaging formats, a growing interest in personalized nutrition, and a heightened awareness of health and wellness.
US Water Enhancer Market Industry Trends & Insights
The US water enhancer market is projected to experience a Compound Annual Growth Rate (CAGR) of xx% during the forecast period (2025-2033). This growth is fueled by several factors. Firstly, the rising health consciousness among consumers is driving demand for healthier alternatives to sugary drinks. Secondly, technological advancements are leading to new product formulations and innovative delivery systems. For instance, the increasing availability of single-serve pouches and convenient dispensing systems are enhancing market penetration. Thirdly, changing consumer preferences toward natural and organic ingredients are stimulating the growth of this sector. The market penetration of water enhancers in the US is estimated at xx% in 2025 and is predicted to reach xx% by 2033. However, intense competition from established beverage giants and emerging brands continues to shape market dynamics, impacting pricing and market share. The shift towards e-commerce also presents both opportunities and challenges, requiring brands to adapt their strategies to online marketplaces.
Dominant Markets & Segments in US Water Enhancer Market
Within the US water enhancer market, the hypermarket/supermarket segment holds the dominant position, driven by its extensive reach and established distribution networks.
- Key Drivers for Hypermarket/Supermarket Dominance:
- High consumer foot traffic and purchasing power.
- Strong brand visibility and shelf space availability.
- Established supply chain infrastructure.
- Promotional opportunities and bulk purchasing options.
While other channels like convenience stores, online retailers, and pharmacies contribute to overall market growth, the hypermarket/supermarket segment continues to drive the majority of sales volume due to factors mentioned above. The online channel is exhibiting rapid growth, primarily because of increased internet penetration and consumer preference for home delivery. Convenience stores cater to the impulse purchases and offer easy accessibility. Pharmacy and health stores cater to the health-conscious consumer segment, while the "other" channel encompasses smaller retailers and direct-to-consumer channels. The growth of these segments depends heavily on factors such as economic conditions, consumer spending habits, and the continued development of e-commerce infrastructure.
US Water Enhancer Market Product Developments
Recent product developments focus on enhancing the sensory experience and functional benefits of water enhancers. Innovations include natural flavor profiles, sugar-free or low-sugar formulations, added electrolytes for enhanced hydration, and the incorporation of vitamins or other functional ingredients to cater to health-conscious consumers. The market is also witnessing the rise of convenient packaging formats like single-serve pouches and stick packs. These developments enhance convenience and offer better portability, appealing to busy lifestyles. Companies are also focusing on creating unique taste profiles and branding to differentiate themselves in a competitive landscape.
Report Scope & Segmentation Analysis
This report segments the US water enhancer market by distribution channel:
Pharmacy and Health Store: This segment caters to health-conscious consumers seeking added benefits and is projected to grow at a CAGR of xx% from 2025 to 2033, reaching a market size of $xx Million by 2033. Competitive dynamics are moderate.
Convenience Store: This segment benefits from impulse purchases and its convenience and is expected to grow at a CAGR of xx%, reaching $xx Million by 2033. Competition is high.
Hypermarket/Supermarket: This segment dominates due to its scale and reach, with projected growth at a CAGR of xx% and a market size of $xx Million by 2033. Intense competition exists.
Online Channel: This fast-growing segment is expected to experience a CAGR of xx%, reaching $xx Million by 2033, fueled by e-commerce expansion. Competition is rising.
Other Distribution Channel: This segment includes smaller retailers and direct-to-consumer sales and is expected to grow at a CAGR of xx%, reaching $xx Million by 2033. Competitive dynamics vary widely.
Key Drivers of US Water Enhancer Market Growth
Several factors are driving the growth of the US water enhancer market. The rising health consciousness among consumers is leading to a shift away from sugary drinks and towards healthier alternatives. Technological advancements in flavor and formulation are resulting in more appealing and functional products. Increased consumer awareness of hydration needs and the benefits of electrolytes are also driving demand. Moreover, convenient packaging options and expanding distribution channels are making water enhancers more accessible to consumers.
Challenges in the US Water Enhancer Market Sector
The US water enhancer market faces certain challenges. Intense competition from established beverage companies and new entrants exerts downward pressure on pricing and profit margins. Fluctuating raw material costs can impact production costs. Regulatory compliance concerning labeling and ingredient safety presents ongoing challenges. Maintaining consumer interest and preventing market saturation through innovation are critical. Supply chain disruptions can affect the availability of products.
Emerging Opportunities in US Water Enhancer Market
Emerging opportunities exist in the development of functional water enhancers with added health benefits, such as vitamins, antioxidants, or probiotics. Expansion into niche markets, such as organic or sustainably sourced products, can also open up new avenues for growth. Developing innovative packaging formats and enhancing online sales channels will be crucial for reaching a broader consumer base. The exploration of new flavor profiles and taste preferences can further diversify product offerings.
Leading Players in the US Water Enhancer Market Market
- Kraft Foods
- Twinings
- Nestle
- PepsiCo Inc
- Aqua Maestro Inc
- True Citrus
- The Coca-Cola Company
- AriZona Beverages USA LLC
- Avitae
Key Developments in US Water Enhancer Market Industry
- 2023-Q2: PepsiCo Inc. launched a new line of enhanced waters with natural flavors.
- 2022-Q4: Nestle acquired a smaller water enhancer company, expanding its product portfolio.
- 2021-Q3: Kraft Foods introduced a new packaging format for its water enhancers. (Further developments would be added here)
Strategic Outlook for US Water Enhancer Market Market
The US water enhancer market exhibits significant future potential, driven by sustained consumer demand for healthier beverages, continuous product innovation, and the expansion of distribution channels. Strategic investments in research and development, focusing on functional ingredients and improved formulations, are expected to drive further growth. Expanding into new markets and adapting to evolving consumer preferences will be vital for long-term success in this dynamic market.
US Water Enhancer Market Segmentation
-
1. Distribution Channel
- 1.1. Pharmacy and Health Store
- 1.2. Convenience Store
- 1.3. Hypermarket/Supermarket
- 1.4. Online Channel
- 1.5. Other Distribution Channel
US Water Enhancer Market Segmentation By Geography
-
1. North America
- 1.1. United States
- 1.2. Canada
- 1.3. Mexico
-
2. South America
- 2.1. Brazil
- 2.2. Argentina
- 2.3. Rest of South America
-
3. Europe
- 3.1. United Kingdom
- 3.2. Germany
- 3.3. France
- 3.4. Italy
- 3.5. Spain
- 3.6. Russia
- 3.7. Benelux
- 3.8. Nordics
- 3.9. Rest of Europe
-
4. Middle East & Africa
- 4.1. Turkey
- 4.2. Israel
- 4.3. GCC
- 4.4. North Africa
- 4.5. South Africa
- 4.6. Rest of Middle East & Africa
-
5. Asia Pacific
- 5.1. China
- 5.2. India
- 5.3. Japan
- 5.4. South Korea
- 5.5. ASEAN
- 5.6. Oceania
- 5.7. Rest of Asia Pacific
US Water Enhancer Market REPORT HIGHLIGHTS
| Aspects | Details |
|---|---|
| Study Period | 2019-2033 |
| Base Year | 2024 |
| Estimated Year | 2025 |
| Forecast Period | 2025-2033 |
| Historical Period | 2019-2024 |
| Growth Rate | CAGR of 9.30% from 2019-2033 |
| Segmentation |
|
Table of Contents
- 1. Introduction
- 1.1. Research Scope
- 1.2. Market Segmentation
- 1.3. Research Methodology
- 1.4. Definitions and Assumptions
- 2. Executive Summary
- 2.1. Introduction
- 3. Market Dynamics
- 3.1. Introduction
- 3.2. Market Drivers
- 3.2.1. Rising Demand for Functional Beverages; Increasing Health Consciousness
- 3.3. Market Restrains
- 3.3.1. High prices for premium or specialized water enhancers can limit their appeal to cost-conscious consumers
- 3.4. Market Trends
- 3.4.1. Consumers are increasingly seeking clean-label products with natural ingredients
- 4. Market Factor Analysis
- 4.1. Porters Five Forces
- 4.2. Supply/Value Chain
- 4.3. PESTEL analysis
- 4.4. Market Entropy
- 4.5. Patent/Trademark Analysis
- 5. Global US Water Enhancer Market Analysis, Insights and Forecast, 2019-2031
- 5.1. Market Analysis, Insights and Forecast - by Distribution Channel
- 5.1.1. Pharmacy and Health Store
- 5.1.2. Convenience Store
- 5.1.3. Hypermarket/Supermarket
- 5.1.4. Online Channel
- 5.1.5. Other Distribution Channel
- 5.2. Market Analysis, Insights and Forecast - by Region
- 5.2.1. North America
- 5.2.2. South America
- 5.2.3. Europe
- 5.2.4. Middle East & Africa
- 5.2.5. Asia Pacific
- 5.1. Market Analysis, Insights and Forecast - by Distribution Channel
- 6. North America US Water Enhancer Market Analysis, Insights and Forecast, 2019-2031
- 6.1. Market Analysis, Insights and Forecast - by Distribution Channel
- 6.1.1. Pharmacy and Health Store
- 6.1.2. Convenience Store
- 6.1.3. Hypermarket/Supermarket
- 6.1.4. Online Channel
- 6.1.5. Other Distribution Channel
- 6.1. Market Analysis, Insights and Forecast - by Distribution Channel
- 7. South America US Water Enhancer Market Analysis, Insights and Forecast, 2019-2031
- 7.1. Market Analysis, Insights and Forecast - by Distribution Channel
- 7.1.1. Pharmacy and Health Store
- 7.1.2. Convenience Store
- 7.1.3. Hypermarket/Supermarket
- 7.1.4. Online Channel
- 7.1.5. Other Distribution Channel
- 7.1. Market Analysis, Insights and Forecast - by Distribution Channel
- 8. Europe US Water Enhancer Market Analysis, Insights and Forecast, 2019-2031
- 8.1. Market Analysis, Insights and Forecast - by Distribution Channel
- 8.1.1. Pharmacy and Health Store
- 8.1.2. Convenience Store
- 8.1.3. Hypermarket/Supermarket
- 8.1.4. Online Channel
- 8.1.5. Other Distribution Channel
- 8.1. Market Analysis, Insights and Forecast - by Distribution Channel
- 9. Middle East & Africa US Water Enhancer Market Analysis, Insights and Forecast, 2019-2031
- 9.1. Market Analysis, Insights and Forecast - by Distribution Channel
- 9.1.1. Pharmacy and Health Store
- 9.1.2. Convenience Store
- 9.1.3. Hypermarket/Supermarket
- 9.1.4. Online Channel
- 9.1.5. Other Distribution Channel
- 9.1. Market Analysis, Insights and Forecast - by Distribution Channel
- 10. Asia Pacific US Water Enhancer Market Analysis, Insights and Forecast, 2019-2031
- 10.1. Market Analysis, Insights and Forecast - by Distribution Channel
- 10.1.1. Pharmacy and Health Store
- 10.1.2. Convenience Store
- 10.1.3. Hypermarket/Supermarket
- 10.1.4. Online Channel
- 10.1.5. Other Distribution Channel
- 10.1. Market Analysis, Insights and Forecast - by Distribution Channel
- 11. Northeast US Water Enhancer Market Analysis, Insights and Forecast, 2019-2031
- 12. Southeast US Water Enhancer Market Analysis, Insights and Forecast, 2019-2031
- 13. Midwest US Water Enhancer Market Analysis, Insights and Forecast, 2019-2031
- 14. Southwest US Water Enhancer Market Analysis, Insights and Forecast, 2019-2031
- 15. West US Water Enhancer Market Analysis, Insights and Forecast, 2019-2031
- 16. Competitive Analysis
- 16.1. Global Market Share Analysis 2024
- 16.2. Company Profiles
- 16.2.1 Kraft Foods
- 16.2.1.1. Overview
- 16.2.1.2. Products
- 16.2.1.3. SWOT Analysis
- 16.2.1.4. Recent Developments
- 16.2.1.5. Financials (Based on Availability)
- 16.2.2 Twinings
- 16.2.2.1. Overview
- 16.2.2.2. Products
- 16.2.2.3. SWOT Analysis
- 16.2.2.4. Recent Developments
- 16.2.2.5. Financials (Based on Availability)
- 16.2.3 Nestle
- 16.2.3.1. Overview
- 16.2.3.2. Products
- 16.2.3.3. SWOT Analysis
- 16.2.3.4. Recent Developments
- 16.2.3.5. Financials (Based on Availability)
- 16.2.4 PepsiCo Inc
- 16.2.4.1. Overview
- 16.2.4.2. Products
- 16.2.4.3. SWOT Analysis
- 16.2.4.4. Recent Developments
- 16.2.4.5. Financials (Based on Availability)
- 16.2.5 Aqua Maestro Inc
- 16.2.5.1. Overview
- 16.2.5.2. Products
- 16.2.5.3. SWOT Analysis
- 16.2.5.4. Recent Developments
- 16.2.5.5. Financials (Based on Availability)
- 16.2.6 True Citrus
- 16.2.6.1. Overview
- 16.2.6.2. Products
- 16.2.6.3. SWOT Analysis
- 16.2.6.4. Recent Developments
- 16.2.6.5. Financials (Based on Availability)
- 16.2.7 The Coca-Cola Company
- 16.2.7.1. Overview
- 16.2.7.2. Products
- 16.2.7.3. SWOT Analysis
- 16.2.7.4. Recent Developments
- 16.2.7.5. Financials (Based on Availability)
- 16.2.8 AriZona Beverages USA LLC*List Not Exhaustive
- 16.2.8.1. Overview
- 16.2.8.2. Products
- 16.2.8.3. SWOT Analysis
- 16.2.8.4. Recent Developments
- 16.2.8.5. Financials (Based on Availability)
- 16.2.9 Avitae
- 16.2.9.1. Overview
- 16.2.9.2. Products
- 16.2.9.3. SWOT Analysis
- 16.2.9.4. Recent Developments
- 16.2.9.5. Financials (Based on Availability)
- 16.2.1 Kraft Foods
List of Figures
- Figure 1: Global US Water Enhancer Market Revenue Breakdown (Million, %) by Region 2024 & 2032
- Figure 2: United states US Water Enhancer Market Revenue (Million), by Country 2024 & 2032
- Figure 3: United states US Water Enhancer Market Revenue Share (%), by Country 2024 & 2032
- Figure 4: North America US Water Enhancer Market Revenue (Million), by Distribution Channel 2024 & 2032
- Figure 5: North America US Water Enhancer Market Revenue Share (%), by Distribution Channel 2024 & 2032
- Figure 6: North America US Water Enhancer Market Revenue (Million), by Country 2024 & 2032
- Figure 7: North America US Water Enhancer Market Revenue Share (%), by Country 2024 & 2032
- Figure 8: South America US Water Enhancer Market Revenue (Million), by Distribution Channel 2024 & 2032
- Figure 9: South America US Water Enhancer Market Revenue Share (%), by Distribution Channel 2024 & 2032
- Figure 10: South America US Water Enhancer Market Revenue (Million), by Country 2024 & 2032
- Figure 11: South America US Water Enhancer Market Revenue Share (%), by Country 2024 & 2032
- Figure 12: Europe US Water Enhancer Market Revenue (Million), by Distribution Channel 2024 & 2032
- Figure 13: Europe US Water Enhancer Market Revenue Share (%), by Distribution Channel 2024 & 2032
- Figure 14: Europe US Water Enhancer Market Revenue (Million), by Country 2024 & 2032
- Figure 15: Europe US Water Enhancer Market Revenue Share (%), by Country 2024 & 2032
- Figure 16: Middle East & Africa US Water Enhancer Market Revenue (Million), by Distribution Channel 2024 & 2032
- Figure 17: Middle East & Africa US Water Enhancer Market Revenue Share (%), by Distribution Channel 2024 & 2032
- Figure 18: Middle East & Africa US Water Enhancer Market Revenue (Million), by Country 2024 & 2032
- Figure 19: Middle East & Africa US Water Enhancer Market Revenue Share (%), by Country 2024 & 2032
- Figure 20: Asia Pacific US Water Enhancer Market Revenue (Million), by Distribution Channel 2024 & 2032
- Figure 21: Asia Pacific US Water Enhancer Market Revenue Share (%), by Distribution Channel 2024 & 2032
- Figure 22: Asia Pacific US Water Enhancer Market Revenue (Million), by Country 2024 & 2032
- Figure 23: Asia Pacific US Water Enhancer Market Revenue Share (%), by Country 2024 & 2032
List of Tables
- Table 1: Global US Water Enhancer Market Revenue Million Forecast, by Region 2019 & 2032
- Table 2: Global US Water Enhancer Market Revenue Million Forecast, by Distribution Channel 2019 & 2032
- Table 3: Global US Water Enhancer Market Revenue Million Forecast, by Region 2019 & 2032
- Table 4: Global US Water Enhancer Market Revenue Million Forecast, by Country 2019 & 2032
- Table 5: Northeast US Water Enhancer Market Revenue (Million) Forecast, by Application 2019 & 2032
- Table 6: Southeast US Water Enhancer Market Revenue (Million) Forecast, by Application 2019 & 2032
- Table 7: Midwest US Water Enhancer Market Revenue (Million) Forecast, by Application 2019 & 2032
- Table 8: Southwest US Water Enhancer Market Revenue (Million) Forecast, by Application 2019 & 2032
- Table 9: West US Water Enhancer Market Revenue (Million) Forecast, by Application 2019 & 2032
- Table 10: Global US Water Enhancer Market Revenue Million Forecast, by Distribution Channel 2019 & 2032
- Table 11: Global US Water Enhancer Market Revenue Million Forecast, by Country 2019 & 2032
- Table 12: United States US Water Enhancer Market Revenue (Million) Forecast, by Application 2019 & 2032
- Table 13: Canada US Water Enhancer Market Revenue (Million) Forecast, by Application 2019 & 2032
- Table 14: Mexico US Water Enhancer Market Revenue (Million) Forecast, by Application 2019 & 2032
- Table 15: Global US Water Enhancer Market Revenue Million Forecast, by Distribution Channel 2019 & 2032
- Table 16: Global US Water Enhancer Market Revenue Million Forecast, by Country 2019 & 2032
- Table 17: Brazil US Water Enhancer Market Revenue (Million) Forecast, by Application 2019 & 2032
- Table 18: Argentina US Water Enhancer Market Revenue (Million) Forecast, by Application 2019 & 2032
- Table 19: Rest of South America US Water Enhancer Market Revenue (Million) Forecast, by Application 2019 & 2032
- Table 20: Global US Water Enhancer Market Revenue Million Forecast, by Distribution Channel 2019 & 2032
- Table 21: Global US Water Enhancer Market Revenue Million Forecast, by Country 2019 & 2032
- Table 22: United Kingdom US Water Enhancer Market Revenue (Million) Forecast, by Application 2019 & 2032
- Table 23: Germany US Water Enhancer Market Revenue (Million) Forecast, by Application 2019 & 2032
- Table 24: France US Water Enhancer Market Revenue (Million) Forecast, by Application 2019 & 2032
- Table 25: Italy US Water Enhancer Market Revenue (Million) Forecast, by Application 2019 & 2032
- Table 26: Spain US Water Enhancer Market Revenue (Million) Forecast, by Application 2019 & 2032
- Table 27: Russia US Water Enhancer Market Revenue (Million) Forecast, by Application 2019 & 2032
- Table 28: Benelux US Water Enhancer Market Revenue (Million) Forecast, by Application 2019 & 2032
- Table 29: Nordics US Water Enhancer Market Revenue (Million) Forecast, by Application 2019 & 2032
- Table 30: Rest of Europe US Water Enhancer Market Revenue (Million) Forecast, by Application 2019 & 2032
- Table 31: Global US Water Enhancer Market Revenue Million Forecast, by Distribution Channel 2019 & 2032
- Table 32: Global US Water Enhancer Market Revenue Million Forecast, by Country 2019 & 2032
- Table 33: Turkey US Water Enhancer Market Revenue (Million) Forecast, by Application 2019 & 2032
- Table 34: Israel US Water Enhancer Market Revenue (Million) Forecast, by Application 2019 & 2032
- Table 35: GCC US Water Enhancer Market Revenue (Million) Forecast, by Application 2019 & 2032
- Table 36: North Africa US Water Enhancer Market Revenue (Million) Forecast, by Application 2019 & 2032
- Table 37: South Africa US Water Enhancer Market Revenue (Million) Forecast, by Application 2019 & 2032
- Table 38: Rest of Middle East & Africa US Water Enhancer Market Revenue (Million) Forecast, by Application 2019 & 2032
- Table 39: Global US Water Enhancer Market Revenue Million Forecast, by Distribution Channel 2019 & 2032
- Table 40: Global US Water Enhancer Market Revenue Million Forecast, by Country 2019 & 2032
- Table 41: China US Water Enhancer Market Revenue (Million) Forecast, by Application 2019 & 2032
- Table 42: India US Water Enhancer Market Revenue (Million) Forecast, by Application 2019 & 2032
- Table 43: Japan US Water Enhancer Market Revenue (Million) Forecast, by Application 2019 & 2032
- Table 44: South Korea US Water Enhancer Market Revenue (Million) Forecast, by Application 2019 & 2032
- Table 45: ASEAN US Water Enhancer Market Revenue (Million) Forecast, by Application 2019 & 2032
- Table 46: Oceania US Water Enhancer Market Revenue (Million) Forecast, by Application 2019 & 2032
- Table 47: Rest of Asia Pacific US Water Enhancer Market Revenue (Million) Forecast, by Application 2019 & 2032
Frequently Asked Questions
1. What is the projected Compound Annual Growth Rate (CAGR) of the US Water Enhancer Market?
The projected CAGR is approximately 9.30%.
2. Which companies are prominent players in the US Water Enhancer Market?
Key companies in the market include Kraft Foods, Twinings, Nestle, PepsiCo Inc, Aqua Maestro Inc, True Citrus, The Coca-Cola Company, AriZona Beverages USA LLC*List Not Exhaustive, Avitae.
3. What are the main segments of the US Water Enhancer Market?
The market segments include Distribution Channel .
4. Can you provide details about the market size?
The market size is estimated to be USD XX Million as of 2022.
5. What are some drivers contributing to market growth?
Rising Demand for Functional Beverages; Increasing Health Consciousness.
6. What are the notable trends driving market growth?
Consumers are increasingly seeking clean-label products with natural ingredients.
7. Are there any restraints impacting market growth?
High prices for premium or specialized water enhancers can limit their appeal to cost-conscious consumers.
8. Can you provide examples of recent developments in the market?
N/A
9. What pricing options are available for accessing the report?
Pricing options include single-user, multi-user, and enterprise licenses priced at USD 3800, USD 4500, and USD 5800 respectively.
10. Is the market size provided in terms of value or volume?
The market size is provided in terms of value, measured in Million.
11. Are there any specific market keywords associated with the report?
Yes, the market keyword associated with the report is "US Water Enhancer Market," which aids in identifying and referencing the specific market segment covered.
12. How do I determine which pricing option suits my needs best?
The pricing options vary based on user requirements and access needs. Individual users may opt for single-user licenses, while businesses requiring broader access may choose multi-user or enterprise licenses for cost-effective access to the report.
13. Are there any additional resources or data provided in the US Water Enhancer Market report?
While the report offers comprehensive insights, it's advisable to review the specific contents or supplementary materials provided to ascertain if additional resources or data are available.
14. How can I stay updated on further developments or reports in the US Water Enhancer Market?
To stay informed about further developments, trends, and reports in the US Water Enhancer Market, consider subscribing to industry newsletters, following relevant companies and organizations, or regularly checking reputable industry news sources and publications.
Methodology
Step 1 - Identification of Relevant Samples Size from Population Database


Step 2 - Approaches for Defining Global Market Size (Value, Volume* & Price*)

Note*: In applicable scenarios
Step 3 - Data Sources
Primary Research
- Web Analytics
- Survey Reports
- Research Institute
- Latest Research Reports
- Opinion Leaders
Secondary Research
- Annual Reports
- White Paper
- Latest Press Release
- Industry Association
- Paid Database
- Investor Presentations

Step 4 - Data Triangulation
Involves using different sources of information in order to increase the validity of a study
These sources are likely to be stakeholders in a program - participants, other researchers, program staff, other community members, and so on.
Then we put all data in single framework & apply various statistical tools to find out the dynamic on the market.
During the analysis stage, feedback from the stakeholder groups would be compared to determine areas of agreement as well as areas of divergence


