
Key Insights
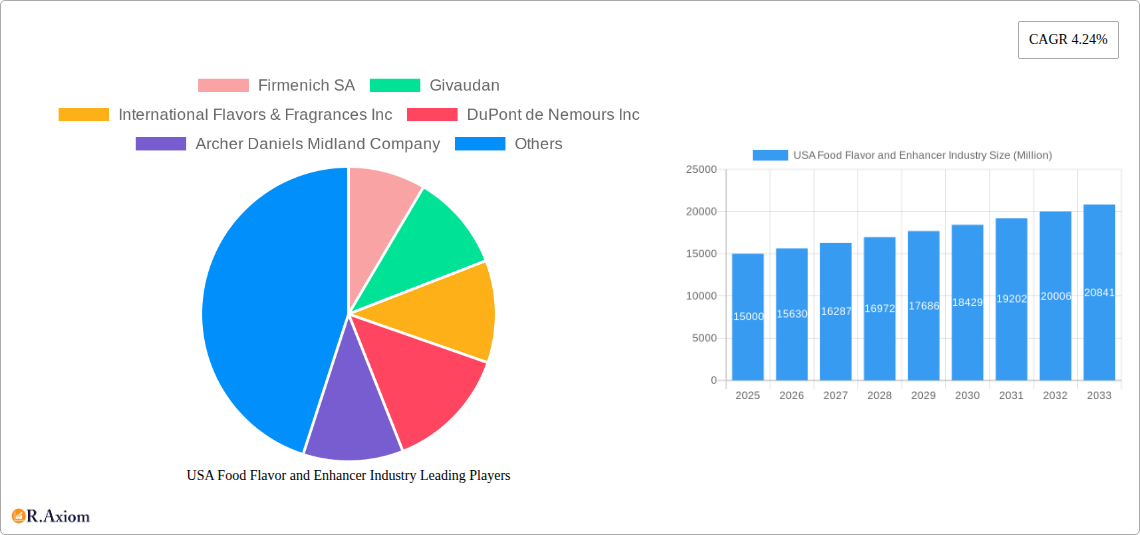
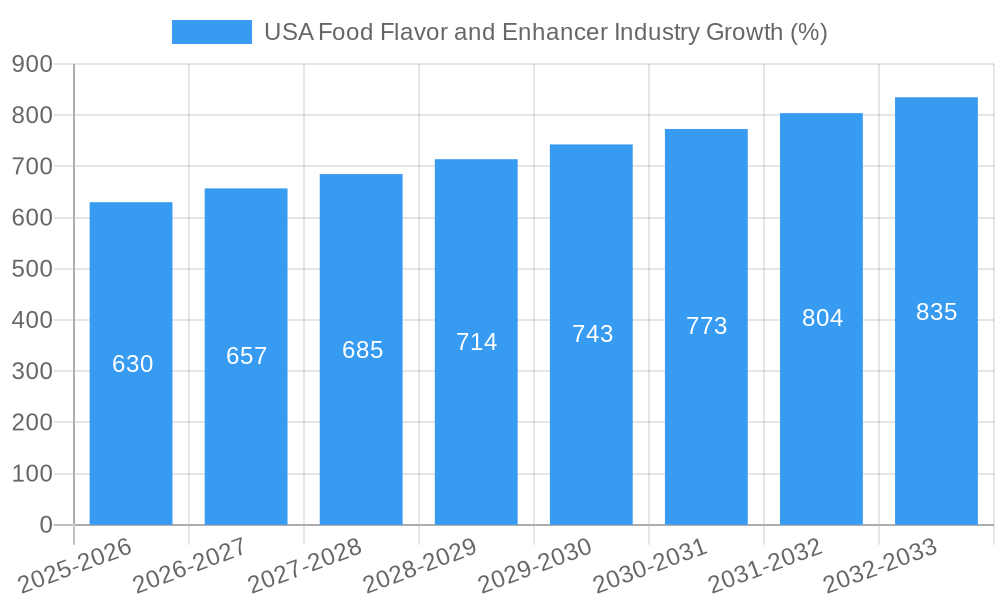
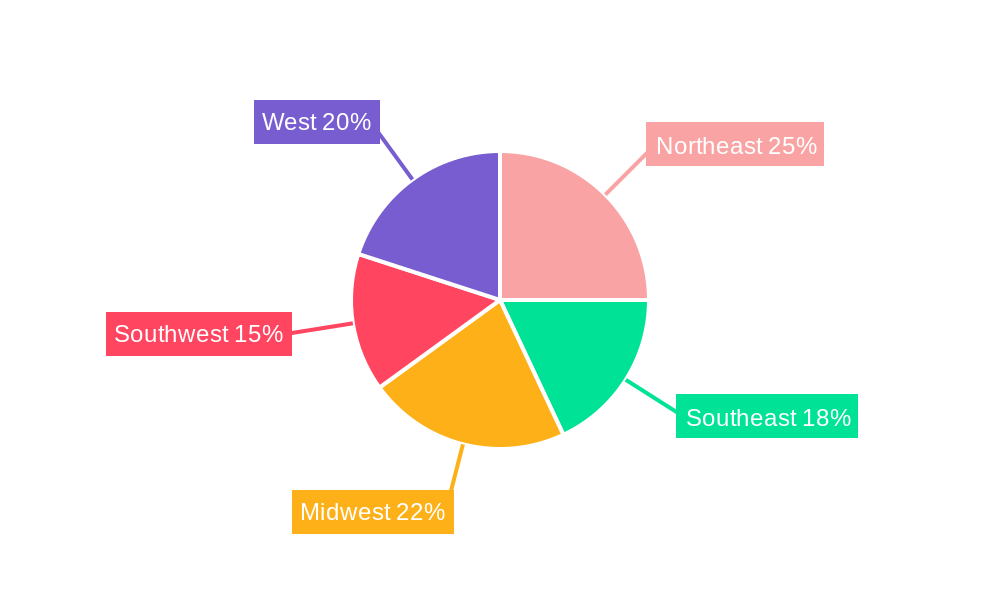
The US food flavor and enhancer market, valued at approximately $XX million in 2025, is projected to experience robust growth, driven by escalating demand for processed and convenient foods, increasing consumer preference for diverse and enhanced flavors, and the expansion of the food and beverage industry. The market's Compound Annual Growth Rate (CAGR) of 4.24% from 2025 to 2033 indicates a steady upward trajectory. Key segments contributing to this growth include bakery and confectionery, dairy products, and beverages, where innovative flavor profiles and natural or "nature-identical" options are gaining significant traction. The increasing consumer awareness of health and wellness is also influencing market trends, pushing manufacturers to adopt clean-label ingredients and incorporate natural flavor enhancers. Competition within the industry is intense, with major players like Firmenich SA, Givaudan, International Flavors & Fragrances Inc., and DuPont de Nemours Inc. constantly striving for innovation and market share. Regional variations exist, with the Northeast and West regions likely commanding larger market shares due to higher population density and stronger consumer spending. However, growth is anticipated across all regions, reflecting the widespread use of flavor enhancers in the food industry.
Despite the positive outlook, certain restraints remain. Fluctuations in raw material costs and stringent regulatory requirements concerning food additives could present challenges for market growth. Furthermore, evolving consumer preferences and the increasing demand for unique and authentic flavor experiences necessitate continuous innovation and adaptation from manufacturers. The market's future will likely be shaped by the successful navigation of these constraints, continued investment in research and development, and the ability of manufacturers to provide high-quality, safe, and appealing food flavor and enhancer solutions. This combination of factors is poised to propel the US food flavor and enhancer market toward considerable expansion in the coming years.
USA Food Flavor and Enhancer Industry: A Comprehensive Market Report (2019-2033)
This comprehensive report provides an in-depth analysis of the USA food flavor and enhancer industry, offering valuable insights for industry stakeholders, investors, and businesses seeking to navigate this dynamic market. The report covers the period from 2019 to 2033, with a base year of 2025 and a forecast period from 2025 to 2033. Market sizing and growth projections are provided in Millions.
USA Food Flavor and Enhancer Industry Market Concentration & Innovation
The USA food flavor and enhancer market is characterized by a moderately concentrated landscape dominated by a few multinational giants like Firmenich SA, Givaudan, International Flavors & Fragrances Inc., DuPont de Nemours Inc., Archer Daniels Midland Company, Koninklijke DSM N.V., and FMC Corporation. These companies hold a significant market share, estimated at approximately 65% in 2025, primarily due to their extensive product portfolios, robust R&D capabilities, and established distribution networks. However, the market also accommodates several smaller players specializing in niche segments or regional markets. Innovation is a key driver, with companies investing heavily in developing natural, clean-label, and functional flavor solutions to cater to evolving consumer preferences. Regulatory frameworks, such as the FDA's stringent regulations on food additives, significantly influence product development and market access. The presence of substitute ingredients and the rise of plant-based alternatives are creating competitive pressures. M&A activities are prevalent, with deal values exceeding xx Million in the past five years, indicating a trend towards consolidation and expansion.
- Market Share: Top 7 players hold approximately 65% in 2025.
- M&A Deal Value (2020-2024): xx Million
- Key Innovation Drivers: Consumer demand for natural and clean-label products, technological advancements in flavor creation, and the increasing demand for functional foods.
USA Food Flavor and Enhancer Industry Industry Trends & Insights
The USA food flavor and enhancer market is experiencing robust growth, driven by several key factors. The increasing demand for convenient and ready-to-eat foods, the rising popularity of ethnic cuisines, and the growing preference for personalized food experiences are fueling market expansion. Technological advancements, such as the use of artificial intelligence and machine learning in flavor development, are enhancing efficiency and customization capabilities. The shift towards healthier and more natural food choices is driving demand for natural and clean-label flavors and enhancers. This trend is reflected in the rising market penetration of natural flavoring solutions, currently estimated at xx% in 2025, and projected to reach xx% by 2033. Intense competition among established players and emerging companies is driving innovation and price competitiveness. The Compound Annual Growth Rate (CAGR) is projected to be xx% during the forecast period (2025-2033).
Dominant Markets & Segments in USA Food Flavor and Enhancer Industry
The Bakery and Confectionery segment dominates the application market, accounting for approximately 30% of total revenue in 2025. This dominance stems from high flavor usage in this sector and constant innovation in product offerings. The Savory segment shows significant potential for growth, driven by evolving consumer preferences and the rise of globally inspired cuisines.
- By Type: Flavors segment is the largest, holding xx% market share in 2025.
- By Application:
- Bakery and Confectionery: High demand for innovative flavors and indulgent experiences.
- Savory: Increasing popularity of ethnic foods and global cuisines.
- Beverage: Demand for unique and refreshing flavor profiles in beverages.
- Key Drivers: Strong consumer spending on food, increasing disposable incomes, and robust food processing industries are major contributors.
USA Food Flavor and Enhancer Industry Product Developments
Recent product innovations focus on clean-label ingredients, natural flavors, and customized flavor profiles tailored to specific consumer preferences. Companies are leveraging biotechnology and fermentation technologies to create novel flavor compounds. The emphasis is on creating products that meet consumer demands for health, authenticity, and convenience. Technological advances, such as advanced flavor extraction techniques and precision fermentation, are leading to the development of superior flavoring solutions with enhanced stability and functionality. These developments are creating significant competitive advantages for companies that invest in cutting-edge R&D.
Report Scope & Segmentation Analysis
This report segments the USA food flavor and enhancer market by type (Flavors, Nature Identical Flavorings, Flavor Enhancers) and application (Dairy Products, Bakery and Confectionery, Savory, Soups, Pasta and Noodles, Beverages, Others). Each segment is analyzed in detail, providing market size, growth projections, and competitive dynamics. For example, the Flavors segment is anticipated to exhibit a CAGR of xx% during the forecast period, primarily driven by the growing demand for naturally derived flavorings. The Bakery and Confectionery application segment showcases considerable growth potential, projected to increase at a CAGR of xx% due to continuous innovation and rising consumption.
Key Drivers of USA Food Flavor and Enhancer Industry Growth
The growth of the USA food flavor and enhancer industry is propelled by several factors. Technological advancements in flavor creation and delivery systems are enhancing product quality and expanding application possibilities. The increasing demand for convenient and ready-to-eat foods is driving the need for flavor enhancers. Favorable economic conditions and rising disposable incomes fuel consumer spending on food products. Furthermore, evolving consumer preferences toward unique flavor profiles and healthier options are fostering innovation in the sector. Stricter food safety regulations are also influencing the demand for high-quality and reliable flavoring solutions.
Challenges in the USA Food Flavor and Enhancer Industry Sector
The industry faces challenges such as stringent regulatory requirements for food additives, which increase compliance costs and development times. Fluctuations in raw material prices and supply chain disruptions can affect profitability and production stability. Intense competition among established players and the emergence of new competitors pose a constant challenge. Furthermore, changing consumer preferences and the demand for clean-label ingredients require continuous adaptation and innovation from companies. These challenges, if not properly managed, can affect market growth by approximately xx%.
Emerging Opportunities in USA Food Flavor and Enhancer Industry
Emerging opportunities lie in the development of natural and clean-label flavors, the increasing demand for personalized food experiences, and the expansion into new and emerging markets. The growing interest in plant-based foods and functional foods presents a significant opportunity for manufacturers of flavor enhancers. Technological advancements, such as 3D food printing and precision fermentation, are opening up new possibilities for flavor customization and creation. The growing trend towards sustainable and ethically sourced ingredients is expected to drive demand for eco-friendly flavoring solutions.
Leading Players in the USA Food Flavor and Enhancer Industry Market
- Firmenich SA
- Givaudan
- International Flavors & Fragrances Inc
- DuPont de Nemours Inc
- Archer Daniels Midland Company
- Koninklijke DSM N.V.
- FMC Corporation
- *List Not Exhaustive
Key Developments in USA Food Flavor and Enhancer Industry Industry
- 2022 Q4: Givaudan launched a new range of natural flavors targeting the health and wellness market.
- 2023 Q1: International Flavors & Fragrances Inc. acquired a smaller flavor company, expanding its product portfolio.
- 2024 Q2: Firmenich invested in new technology for sustainable flavor extraction.
- Further developments will be detailed in the full report.
Strategic Outlook for USA Food Flavor and Enhancer Industry Market
The USA food flavor and enhancer market is poised for continued growth, driven by sustained consumer demand, technological advancements, and ongoing industry consolidation. The focus on natural and clean-label solutions, along with the exploration of novel flavor profiles, will continue to shape the market landscape. Companies that effectively leverage technological innovations, adapt to evolving consumer preferences, and comply with evolving regulatory standards will be best positioned to capitalize on future growth opportunities. The market's future potential rests on the successful integration of sustainability and innovation in flavor technology.
USA Food Flavor and Enhancer Industry Segmentation
-
1. Type
-
1.1. Flavors
- 1.1.1. Natural Flavor
- 1.1.2. Synthetic Flavor
- 1.1.3. Nature Identical Flavoring
- 1.2. Flavor Enhancers
-
1.1. Flavors
-
2. Application
- 2.1. Dairy Products
- 2.2. Bakery and Confectionery
- 2.3. Savory
- 2.4. Soups, Pasta and Noodles
- 2.5. Beverage
- 2.6. Others
USA Food Flavor and Enhancer Industry Segmentation By Geography
-
1. North America
- 1.1. United States
- 1.2. Canada
- 1.3. Mexico
-
2. South America
- 2.1. Brazil
- 2.2. Argentina
- 2.3. Rest of South America
-
3. Europe
- 3.1. United Kingdom
- 3.2. Germany
- 3.3. France
- 3.4. Italy
- 3.5. Spain
- 3.6. Russia
- 3.7. Benelux
- 3.8. Nordics
- 3.9. Rest of Europe
-
4. Middle East & Africa
- 4.1. Turkey
- 4.2. Israel
- 4.3. GCC
- 4.4. North Africa
- 4.5. South Africa
- 4.6. Rest of Middle East & Africa
-
5. Asia Pacific
- 5.1. China
- 5.2. India
- 5.3. Japan
- 5.4. South Korea
- 5.5. ASEAN
- 5.6. Oceania
- 5.7. Rest of Asia Pacific
USA Food Flavor and Enhancer Industry REPORT HIGHLIGHTS
| Aspects | Details |
|---|---|
| Study Period | 2019-2033 |
| Base Year | 2024 |
| Estimated Year | 2025 |
| Forecast Period | 2025-2033 |
| Historical Period | 2019-2024 |
| Growth Rate | CAGR of 4.24% from 2019-2033 |
| Segmentation |
|
Table of Contents
- 1. Introduction
- 1.1. Research Scope
- 1.2. Market Segmentation
- 1.3. Research Methodology
- 1.4. Definitions and Assumptions
- 2. Executive Summary
- 2.1. Introduction
- 3. Market Dynamics
- 3.1. Introduction
- 3.2. Market Drivers
- 3.2.1. The Rising Awareness of the Health Benefits Associated with Collagen Consumption; Rising Sport and Fitness Trends Drives the Market Growth
- 3.3. Market Restrains
- 3.3.1. Concerns over the Source and Animal Welfare in Collagen Extraction Limit the Market Growth
- 3.4. Market Trends
- 3.4.1. Increasing Demand For Natural Food Flavors and Enhancers
- 4. Market Factor Analysis
- 4.1. Porters Five Forces
- 4.2. Supply/Value Chain
- 4.3. PESTEL analysis
- 4.4. Market Entropy
- 4.5. Patent/Trademark Analysis
- 5. Global USA Food Flavor and Enhancer Industry Analysis, Insights and Forecast, 2019-2031
- 5.1. Market Analysis, Insights and Forecast - by Type
- 5.1.1. Flavors
- 5.1.1.1. Natural Flavor
- 5.1.1.2. Synthetic Flavor
- 5.1.1.3. Nature Identical Flavoring
- 5.1.2. Flavor Enhancers
- 5.1.1. Flavors
- 5.2. Market Analysis, Insights and Forecast - by Application
- 5.2.1. Dairy Products
- 5.2.2. Bakery and Confectionery
- 5.2.3. Savory
- 5.2.4. Soups, Pasta and Noodles
- 5.2.5. Beverage
- 5.2.6. Others
- 5.3. Market Analysis, Insights and Forecast - by Region
- 5.3.1. North America
- 5.3.2. South America
- 5.3.3. Europe
- 5.3.4. Middle East & Africa
- 5.3.5. Asia Pacific
- 5.1. Market Analysis, Insights and Forecast - by Type
- 6. North America USA Food Flavor and Enhancer Industry Analysis, Insights and Forecast, 2019-2031
- 6.1. Market Analysis, Insights and Forecast - by Type
- 6.1.1. Flavors
- 6.1.1.1. Natural Flavor
- 6.1.1.2. Synthetic Flavor
- 6.1.1.3. Nature Identical Flavoring
- 6.1.2. Flavor Enhancers
- 6.1.1. Flavors
- 6.2. Market Analysis, Insights and Forecast - by Application
- 6.2.1. Dairy Products
- 6.2.2. Bakery and Confectionery
- 6.2.3. Savory
- 6.2.4. Soups, Pasta and Noodles
- 6.2.5. Beverage
- 6.2.6. Others
- 6.1. Market Analysis, Insights and Forecast - by Type
- 7. South America USA Food Flavor and Enhancer Industry Analysis, Insights and Forecast, 2019-2031
- 7.1. Market Analysis, Insights and Forecast - by Type
- 7.1.1. Flavors
- 7.1.1.1. Natural Flavor
- 7.1.1.2. Synthetic Flavor
- 7.1.1.3. Nature Identical Flavoring
- 7.1.2. Flavor Enhancers
- 7.1.1. Flavors
- 7.2. Market Analysis, Insights and Forecast - by Application
- 7.2.1. Dairy Products
- 7.2.2. Bakery and Confectionery
- 7.2.3. Savory
- 7.2.4. Soups, Pasta and Noodles
- 7.2.5. Beverage
- 7.2.6. Others
- 7.1. Market Analysis, Insights and Forecast - by Type
- 8. Europe USA Food Flavor and Enhancer Industry Analysis, Insights and Forecast, 2019-2031
- 8.1. Market Analysis, Insights and Forecast - by Type
- 8.1.1. Flavors
- 8.1.1.1. Natural Flavor
- 8.1.1.2. Synthetic Flavor
- 8.1.1.3. Nature Identical Flavoring
- 8.1.2. Flavor Enhancers
- 8.1.1. Flavors
- 8.2. Market Analysis, Insights and Forecast - by Application
- 8.2.1. Dairy Products
- 8.2.2. Bakery and Confectionery
- 8.2.3. Savory
- 8.2.4. Soups, Pasta and Noodles
- 8.2.5. Beverage
- 8.2.6. Others
- 8.1. Market Analysis, Insights and Forecast - by Type
- 9. Middle East & Africa USA Food Flavor and Enhancer Industry Analysis, Insights and Forecast, 2019-2031
- 9.1. Market Analysis, Insights and Forecast - by Type
- 9.1.1. Flavors
- 9.1.1.1. Natural Flavor
- 9.1.1.2. Synthetic Flavor
- 9.1.1.3. Nature Identical Flavoring
- 9.1.2. Flavor Enhancers
- 9.1.1. Flavors
- 9.2. Market Analysis, Insights and Forecast - by Application
- 9.2.1. Dairy Products
- 9.2.2. Bakery and Confectionery
- 9.2.3. Savory
- 9.2.4. Soups, Pasta and Noodles
- 9.2.5. Beverage
- 9.2.6. Others
- 9.1. Market Analysis, Insights and Forecast - by Type
- 10. Asia Pacific USA Food Flavor and Enhancer Industry Analysis, Insights and Forecast, 2019-2031
- 10.1. Market Analysis, Insights and Forecast - by Type
- 10.1.1. Flavors
- 10.1.1.1. Natural Flavor
- 10.1.1.2. Synthetic Flavor
- 10.1.1.3. Nature Identical Flavoring
- 10.1.2. Flavor Enhancers
- 10.1.1. Flavors
- 10.2. Market Analysis, Insights and Forecast - by Application
- 10.2.1. Dairy Products
- 10.2.2. Bakery and Confectionery
- 10.2.3. Savory
- 10.2.4. Soups, Pasta and Noodles
- 10.2.5. Beverage
- 10.2.6. Others
- 10.1. Market Analysis, Insights and Forecast - by Type
- 11. Northeast USA Food Flavor and Enhancer Industry Analysis, Insights and Forecast, 2019-2031
- 12. Southeast USA Food Flavor and Enhancer Industry Analysis, Insights and Forecast, 2019-2031
- 13. Midwest USA Food Flavor and Enhancer Industry Analysis, Insights and Forecast, 2019-2031
- 14. Southwest USA Food Flavor and Enhancer Industry Analysis, Insights and Forecast, 2019-2031
- 15. West USA Food Flavor and Enhancer Industry Analysis, Insights and Forecast, 2019-2031
- 16. Competitive Analysis
- 16.1. Global Market Share Analysis 2024
- 16.2. Company Profiles
- 16.2.1 Firmenich SA
- 16.2.1.1. Overview
- 16.2.1.2. Products
- 16.2.1.3. SWOT Analysis
- 16.2.1.4. Recent Developments
- 16.2.1.5. Financials (Based on Availability)
- 16.2.2 Givaudan
- 16.2.2.1. Overview
- 16.2.2.2. Products
- 16.2.2.3. SWOT Analysis
- 16.2.2.4. Recent Developments
- 16.2.2.5. Financials (Based on Availability)
- 16.2.3 International Flavors & Fragrances Inc
- 16.2.3.1. Overview
- 16.2.3.2. Products
- 16.2.3.3. SWOT Analysis
- 16.2.3.4. Recent Developments
- 16.2.3.5. Financials (Based on Availability)
- 16.2.4 DuPont de Nemours Inc
- 16.2.4.1. Overview
- 16.2.4.2. Products
- 16.2.4.3. SWOT Analysis
- 16.2.4.4. Recent Developments
- 16.2.4.5. Financials (Based on Availability)
- 16.2.5 Archer Daniels Midland Company
- 16.2.5.1. Overview
- 16.2.5.2. Products
- 16.2.5.3. SWOT Analysis
- 16.2.5.4. Recent Developments
- 16.2.5.5. Financials (Based on Availability)
- 16.2.6 Koninklijke DSM N V
- 16.2.6.1. Overview
- 16.2.6.2. Products
- 16.2.6.3. SWOT Analysis
- 16.2.6.4. Recent Developments
- 16.2.6.5. Financials (Based on Availability)
- 16.2.7 FMC Corporation*List Not Exhaustive
- 16.2.7.1. Overview
- 16.2.7.2. Products
- 16.2.7.3. SWOT Analysis
- 16.2.7.4. Recent Developments
- 16.2.7.5. Financials (Based on Availability)
- 16.2.1 Firmenich SA
List of Figures
- Figure 1: Global USA Food Flavor and Enhancer Industry Revenue Breakdown (Million, %) by Region 2024 & 2032
- Figure 2: United states USA Food Flavor and Enhancer Industry Revenue (Million), by Country 2024 & 2032
- Figure 3: United states USA Food Flavor and Enhancer Industry Revenue Share (%), by Country 2024 & 2032
- Figure 4: North America USA Food Flavor and Enhancer Industry Revenue (Million), by Type 2024 & 2032
- Figure 5: North America USA Food Flavor and Enhancer Industry Revenue Share (%), by Type 2024 & 2032
- Figure 6: North America USA Food Flavor and Enhancer Industry Revenue (Million), by Application 2024 & 2032
- Figure 7: North America USA Food Flavor and Enhancer Industry Revenue Share (%), by Application 2024 & 2032
- Figure 8: North America USA Food Flavor and Enhancer Industry Revenue (Million), by Country 2024 & 2032
- Figure 9: North America USA Food Flavor and Enhancer Industry Revenue Share (%), by Country 2024 & 2032
- Figure 10: South America USA Food Flavor and Enhancer Industry Revenue (Million), by Type 2024 & 2032
- Figure 11: South America USA Food Flavor and Enhancer Industry Revenue Share (%), by Type 2024 & 2032
- Figure 12: South America USA Food Flavor and Enhancer Industry Revenue (Million), by Application 2024 & 2032
- Figure 13: South America USA Food Flavor and Enhancer Industry Revenue Share (%), by Application 2024 & 2032
- Figure 14: South America USA Food Flavor and Enhancer Industry Revenue (Million), by Country 2024 & 2032
- Figure 15: South America USA Food Flavor and Enhancer Industry Revenue Share (%), by Country 2024 & 2032
- Figure 16: Europe USA Food Flavor and Enhancer Industry Revenue (Million), by Type 2024 & 2032
- Figure 17: Europe USA Food Flavor and Enhancer Industry Revenue Share (%), by Type 2024 & 2032
- Figure 18: Europe USA Food Flavor and Enhancer Industry Revenue (Million), by Application 2024 & 2032
- Figure 19: Europe USA Food Flavor and Enhancer Industry Revenue Share (%), by Application 2024 & 2032
- Figure 20: Europe USA Food Flavor and Enhancer Industry Revenue (Million), by Country 2024 & 2032
- Figure 21: Europe USA Food Flavor and Enhancer Industry Revenue Share (%), by Country 2024 & 2032
- Figure 22: Middle East & Africa USA Food Flavor and Enhancer Industry Revenue (Million), by Type 2024 & 2032
- Figure 23: Middle East & Africa USA Food Flavor and Enhancer Industry Revenue Share (%), by Type 2024 & 2032
- Figure 24: Middle East & Africa USA Food Flavor and Enhancer Industry Revenue (Million), by Application 2024 & 2032
- Figure 25: Middle East & Africa USA Food Flavor and Enhancer Industry Revenue Share (%), by Application 2024 & 2032
- Figure 26: Middle East & Africa USA Food Flavor and Enhancer Industry Revenue (Million), by Country 2024 & 2032
- Figure 27: Middle East & Africa USA Food Flavor and Enhancer Industry Revenue Share (%), by Country 2024 & 2032
- Figure 28: Asia Pacific USA Food Flavor and Enhancer Industry Revenue (Million), by Type 2024 & 2032
- Figure 29: Asia Pacific USA Food Flavor and Enhancer Industry Revenue Share (%), by Type 2024 & 2032
- Figure 30: Asia Pacific USA Food Flavor and Enhancer Industry Revenue (Million), by Application 2024 & 2032
- Figure 31: Asia Pacific USA Food Flavor and Enhancer Industry Revenue Share (%), by Application 2024 & 2032
- Figure 32: Asia Pacific USA Food Flavor and Enhancer Industry Revenue (Million), by Country 2024 & 2032
- Figure 33: Asia Pacific USA Food Flavor and Enhancer Industry Revenue Share (%), by Country 2024 & 2032
List of Tables
- Table 1: Global USA Food Flavor and Enhancer Industry Revenue Million Forecast, by Region 2019 & 2032
- Table 2: Global USA Food Flavor and Enhancer Industry Revenue Million Forecast, by Type 2019 & 2032
- Table 3: Global USA Food Flavor and Enhancer Industry Revenue Million Forecast, by Application 2019 & 2032
- Table 4: Global USA Food Flavor and Enhancer Industry Revenue Million Forecast, by Region 2019 & 2032
- Table 5: Global USA Food Flavor and Enhancer Industry Revenue Million Forecast, by Country 2019 & 2032
- Table 6: Northeast USA Food Flavor and Enhancer Industry Revenue (Million) Forecast, by Application 2019 & 2032
- Table 7: Southeast USA Food Flavor and Enhancer Industry Revenue (Million) Forecast, by Application 2019 & 2032
- Table 8: Midwest USA Food Flavor and Enhancer Industry Revenue (Million) Forecast, by Application 2019 & 2032
- Table 9: Southwest USA Food Flavor and Enhancer Industry Revenue (Million) Forecast, by Application 2019 & 2032
- Table 10: West USA Food Flavor and Enhancer Industry Revenue (Million) Forecast, by Application 2019 & 2032
- Table 11: Global USA Food Flavor and Enhancer Industry Revenue Million Forecast, by Type 2019 & 2032
- Table 12: Global USA Food Flavor and Enhancer Industry Revenue Million Forecast, by Application 2019 & 2032
- Table 13: Global USA Food Flavor and Enhancer Industry Revenue Million Forecast, by Country 2019 & 2032
- Table 14: United States USA Food Flavor and Enhancer Industry Revenue (Million) Forecast, by Application 2019 & 2032
- Table 15: Canada USA Food Flavor and Enhancer Industry Revenue (Million) Forecast, by Application 2019 & 2032
- Table 16: Mexico USA Food Flavor and Enhancer Industry Revenue (Million) Forecast, by Application 2019 & 2032
- Table 17: Global USA Food Flavor and Enhancer Industry Revenue Million Forecast, by Type 2019 & 2032
- Table 18: Global USA Food Flavor and Enhancer Industry Revenue Million Forecast, by Application 2019 & 2032
- Table 19: Global USA Food Flavor and Enhancer Industry Revenue Million Forecast, by Country 2019 & 2032
- Table 20: Brazil USA Food Flavor and Enhancer Industry Revenue (Million) Forecast, by Application 2019 & 2032
- Table 21: Argentina USA Food Flavor and Enhancer Industry Revenue (Million) Forecast, by Application 2019 & 2032
- Table 22: Rest of South America USA Food Flavor and Enhancer Industry Revenue (Million) Forecast, by Application 2019 & 2032
- Table 23: Global USA Food Flavor and Enhancer Industry Revenue Million Forecast, by Type 2019 & 2032
- Table 24: Global USA Food Flavor and Enhancer Industry Revenue Million Forecast, by Application 2019 & 2032
- Table 25: Global USA Food Flavor and Enhancer Industry Revenue Million Forecast, by Country 2019 & 2032
- Table 26: United Kingdom USA Food Flavor and Enhancer Industry Revenue (Million) Forecast, by Application 2019 & 2032
- Table 27: Germany USA Food Flavor and Enhancer Industry Revenue (Million) Forecast, by Application 2019 & 2032
- Table 28: France USA Food Flavor and Enhancer Industry Revenue (Million) Forecast, by Application 2019 & 2032
- Table 29: Italy USA Food Flavor and Enhancer Industry Revenue (Million) Forecast, by Application 2019 & 2032
- Table 30: Spain USA Food Flavor and Enhancer Industry Revenue (Million) Forecast, by Application 2019 & 2032
- Table 31: Russia USA Food Flavor and Enhancer Industry Revenue (Million) Forecast, by Application 2019 & 2032
- Table 32: Benelux USA Food Flavor and Enhancer Industry Revenue (Million) Forecast, by Application 2019 & 2032
- Table 33: Nordics USA Food Flavor and Enhancer Industry Revenue (Million) Forecast, by Application 2019 & 2032
- Table 34: Rest of Europe USA Food Flavor and Enhancer Industry Revenue (Million) Forecast, by Application 2019 & 2032
- Table 35: Global USA Food Flavor and Enhancer Industry Revenue Million Forecast, by Type 2019 & 2032
- Table 36: Global USA Food Flavor and Enhancer Industry Revenue Million Forecast, by Application 2019 & 2032
- Table 37: Global USA Food Flavor and Enhancer Industry Revenue Million Forecast, by Country 2019 & 2032
- Table 38: Turkey USA Food Flavor and Enhancer Industry Revenue (Million) Forecast, by Application 2019 & 2032
- Table 39: Israel USA Food Flavor and Enhancer Industry Revenue (Million) Forecast, by Application 2019 & 2032
- Table 40: GCC USA Food Flavor and Enhancer Industry Revenue (Million) Forecast, by Application 2019 & 2032
- Table 41: North Africa USA Food Flavor and Enhancer Industry Revenue (Million) Forecast, by Application 2019 & 2032
- Table 42: South Africa USA Food Flavor and Enhancer Industry Revenue (Million) Forecast, by Application 2019 & 2032
- Table 43: Rest of Middle East & Africa USA Food Flavor and Enhancer Industry Revenue (Million) Forecast, by Application 2019 & 2032
- Table 44: Global USA Food Flavor and Enhancer Industry Revenue Million Forecast, by Type 2019 & 2032
- Table 45: Global USA Food Flavor and Enhancer Industry Revenue Million Forecast, by Application 2019 & 2032
- Table 46: Global USA Food Flavor and Enhancer Industry Revenue Million Forecast, by Country 2019 & 2032
- Table 47: China USA Food Flavor and Enhancer Industry Revenue (Million) Forecast, by Application 2019 & 2032
- Table 48: India USA Food Flavor and Enhancer Industry Revenue (Million) Forecast, by Application 2019 & 2032
- Table 49: Japan USA Food Flavor and Enhancer Industry Revenue (Million) Forecast, by Application 2019 & 2032
- Table 50: South Korea USA Food Flavor and Enhancer Industry Revenue (Million) Forecast, by Application 2019 & 2032
- Table 51: ASEAN USA Food Flavor and Enhancer Industry Revenue (Million) Forecast, by Application 2019 & 2032
- Table 52: Oceania USA Food Flavor and Enhancer Industry Revenue (Million) Forecast, by Application 2019 & 2032
- Table 53: Rest of Asia Pacific USA Food Flavor and Enhancer Industry Revenue (Million) Forecast, by Application 2019 & 2032
Frequently Asked Questions
1. What is the projected Compound Annual Growth Rate (CAGR) of the USA Food Flavor and Enhancer Industry?
The projected CAGR is approximately 4.24%.
2. Which companies are prominent players in the USA Food Flavor and Enhancer Industry?
Key companies in the market include Firmenich SA, Givaudan, International Flavors & Fragrances Inc, DuPont de Nemours Inc, Archer Daniels Midland Company, Koninklijke DSM N V, FMC Corporation*List Not Exhaustive.
3. What are the main segments of the USA Food Flavor and Enhancer Industry?
The market segments include Type, Application.
4. Can you provide details about the market size?
The market size is estimated to be USD XX Million as of 2022.
5. What are some drivers contributing to market growth?
The Rising Awareness of the Health Benefits Associated with Collagen Consumption; Rising Sport and Fitness Trends Drives the Market Growth.
6. What are the notable trends driving market growth?
Increasing Demand For Natural Food Flavors and Enhancers.
7. Are there any restraints impacting market growth?
Concerns over the Source and Animal Welfare in Collagen Extraction Limit the Market Growth.
8. Can you provide examples of recent developments in the market?
N/A
9. What pricing options are available for accessing the report?
Pricing options include single-user, multi-user, and enterprise licenses priced at USD 3800, USD 4500, and USD 5800 respectively.
10. Is the market size provided in terms of value or volume?
The market size is provided in terms of value, measured in Million.
11. Are there any specific market keywords associated with the report?
Yes, the market keyword associated with the report is "USA Food Flavor and Enhancer Industry," which aids in identifying and referencing the specific market segment covered.
12. How do I determine which pricing option suits my needs best?
The pricing options vary based on user requirements and access needs. Individual users may opt for single-user licenses, while businesses requiring broader access may choose multi-user or enterprise licenses for cost-effective access to the report.
13. Are there any additional resources or data provided in the USA Food Flavor and Enhancer Industry report?
While the report offers comprehensive insights, it's advisable to review the specific contents or supplementary materials provided to ascertain if additional resources or data are available.
14. How can I stay updated on further developments or reports in the USA Food Flavor and Enhancer Industry?
To stay informed about further developments, trends, and reports in the USA Food Flavor and Enhancer Industry, consider subscribing to industry newsletters, following relevant companies and organizations, or regularly checking reputable industry news sources and publications.
Methodology
Step 1 - Identification of Relevant Samples Size from Population Database


Step 2 - Approaches for Defining Global Market Size (Value, Volume* & Price*)

Note*: In applicable scenarios
Step 3 - Data Sources
Primary Research
- Web Analytics
- Survey Reports
- Research Institute
- Latest Research Reports
- Opinion Leaders
Secondary Research
- Annual Reports
- White Paper
- Latest Press Release
- Industry Association
- Paid Database
- Investor Presentations

Step 4 - Data Triangulation
Involves using different sources of information in order to increase the validity of a study
These sources are likely to be stakeholders in a program - participants, other researchers, program staff, other community members, and so on.
Then we put all data in single framework & apply various statistical tools to find out the dynamic on the market.
During the analysis stage, feedback from the stakeholder groups would be compared to determine areas of agreement as well as areas of divergence


