
Key Insights
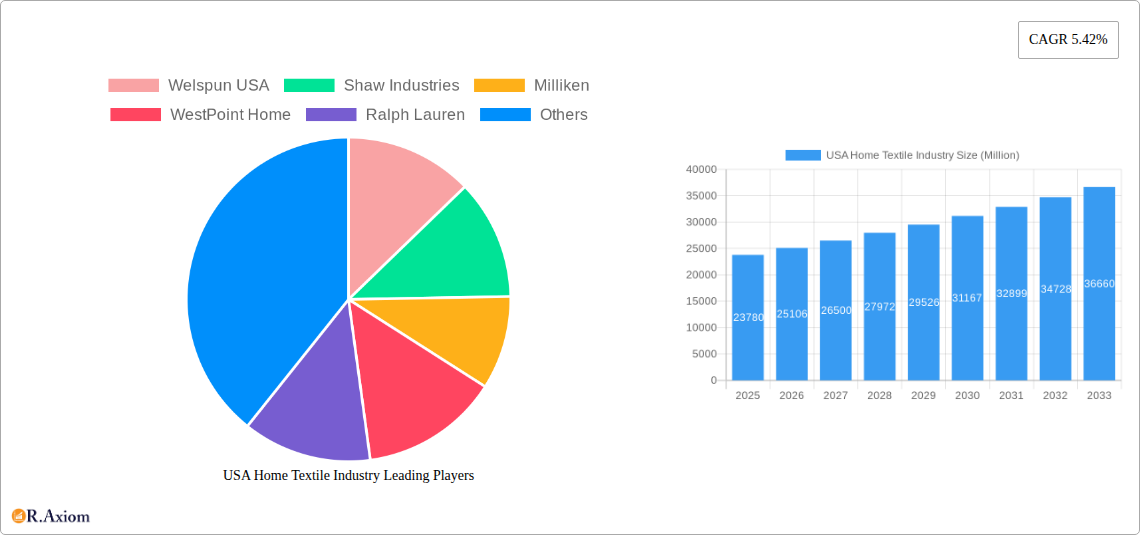
The US home textile market, valued at $23.78 billion in 2025, is projected to experience robust growth, exhibiting a Compound Annual Growth Rate (CAGR) of 5.42% from 2025 to 2033. This expansion is fueled by several key drivers. The rising disposable incomes among US households, coupled with a growing preference for comfortable and aesthetically pleasing home environments, significantly boosts demand for high-quality bed linens, bath linens, and other home textile products. Furthermore, the increasing popularity of online retail channels offers convenient access to a wider selection of products and competitive pricing, further stimulating market growth. The market segmentation reveals strong performance across various material types, with bed linens and bath linens holding significant market share due to their essential nature. Online sales are rapidly gaining traction, challenging the traditional dominance of supermarkets and specialty stores. While factors such as fluctuating raw material prices and increasing competition could pose some restraints, the overall market outlook remains positive, driven by the aforementioned trends.
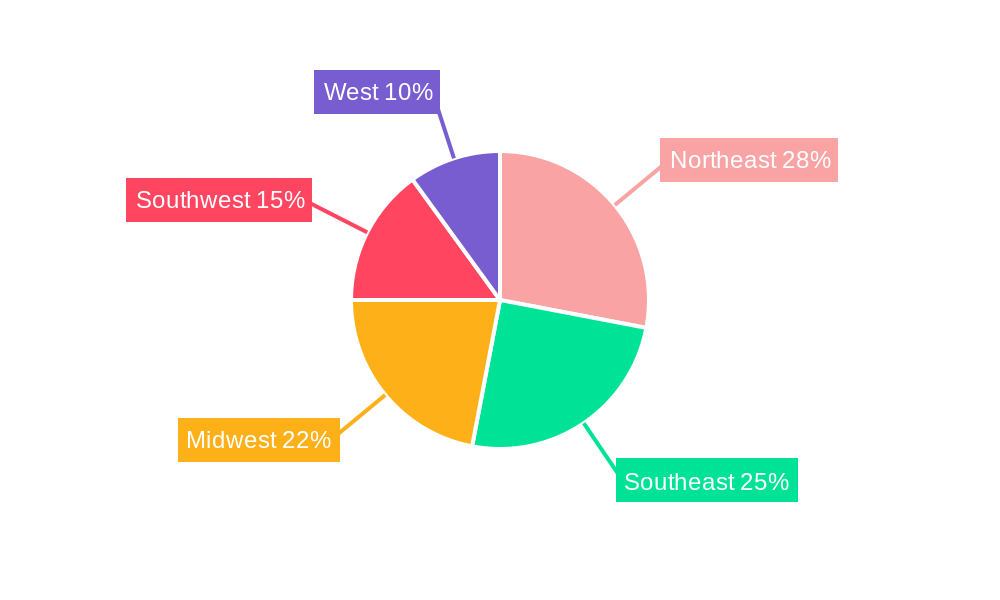
The geographical distribution of the market showcases variations across regions within the United States. The Northeast and West regions, characterized by higher average household incomes and a greater emphasis on home décor, are expected to lead in terms of market share and growth. However, all regions will contribute to the overall expansion, fueled by the pervasive trends of home improvement and a growing desire for enhanced comfort and style in homes. Key players like Welspun USA, Shaw Industries, and Milliken are leveraging their established brands and innovative product offerings to solidify their market positions. The competitive landscape is dynamic, with both established brands and emerging players striving for market share through product diversification, strategic partnerships, and targeted marketing initiatives. The continued growth in online sales will shape the market's competitive dynamics, demanding greater agility and adaptability from companies in their e-commerce strategies and supply chain management.
This comprehensive report provides a detailed analysis of the USA home textile industry, covering market size, segmentation, growth drivers, challenges, and key players. The study period spans from 2019 to 2033, with 2025 serving as the base and estimated year. The report is essential for industry stakeholders, investors, and businesses seeking to understand this dynamic market.
USA Home Textile Industry Market Concentration & Innovation
The USA home textile industry exhibits a moderately concentrated structure, with a few major players holding significant market share. Welspun USA, Shaw Industries, Milliken, and Mohawk Industries are among the leading companies, controlling an estimated xx% of the market in 2025. However, a significant portion of the market is fragmented amongst smaller players and private labels. Innovation is driven by factors like consumer demand for sustainable products, technological advancements in materials and manufacturing, and the growing preference for personalized home décor. Regulatory frameworks, particularly those related to product safety and environmental standards, significantly influence industry practices. Product substitutes, such as synthetic alternatives, exert competitive pressure. M&A activities are noteworthy, with recent transactions like Mohawk Industries' acquisition of Vitromex showcasing consolidation trends. The total value of M&A deals in the period 2019-2024 was approximately xx Million.
- Market Share Concentration: Top 5 players hold xx% in 2025.
- Innovation Drivers: Sustainable materials, technological advancements, personalization.
- Regulatory Impact: Safety standards, environmental regulations.
- M&A Activity: Significant consolidation with deals totaling xx Million (2019-2024).
USA Home Textile Industry Industry Trends & Insights
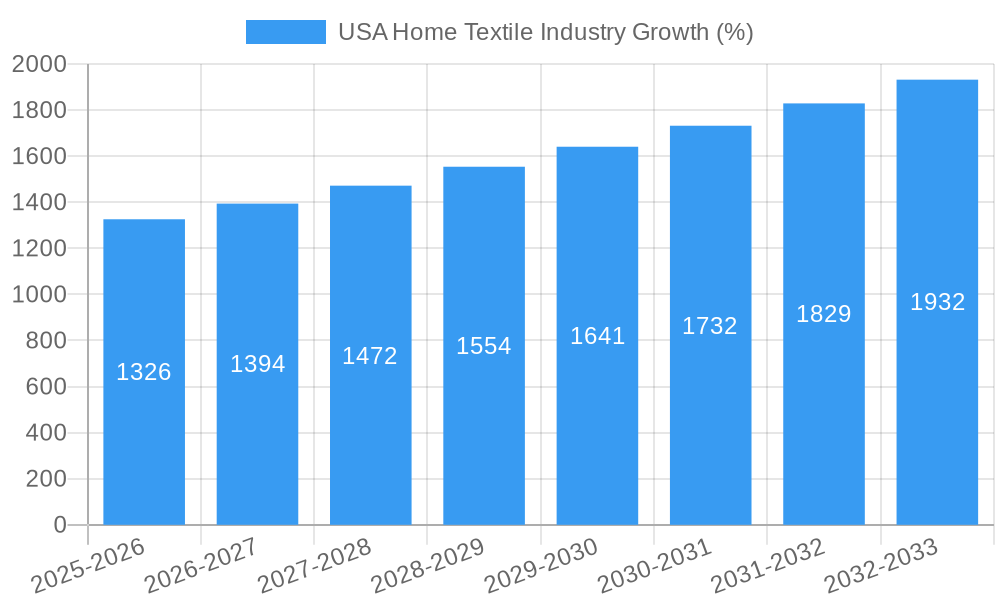
The USA home textile industry is projected to experience a CAGR of xx% during the forecast period (2025-2033), driven by several key factors. Rising disposable incomes, coupled with a growing emphasis on home improvement and comfort, are fueling demand. Technological disruptions, such as the adoption of smart textiles and advanced manufacturing techniques, are transforming production and product offerings. Consumer preferences are shifting towards eco-friendly, durable, and aesthetically pleasing products. Intense competition necessitates continuous innovation and strategic marketing to capture market share. Online sales channels are gaining significant traction, leading to increased market penetration. The market penetration of online sales is projected to reach xx% by 2033.
Dominant Markets & Segments in USA Home Textile Industry
The bed linen segment dominates the market by material type, accounting for approximately xx% of the total market value in 2025, driven by its high demand and wide usage. Online channels are emerging as a dominant distribution channel, gaining market share from traditional retail channels due to convenience and wider reach. The Northeast and West Coast regions exhibit higher spending patterns due to high income levels and a larger population density.
- Leading Segment (Material): Bed Linen (xx% market share in 2025)
- Leading Segment (Distribution): Online (projected xx% market share by 2033)
- Key Regional Drivers: High income levels (Northeast, West Coast).
USA Home Textile Industry Product Developments
Recent product innovations include the introduction of antimicrobial fabrics, smart textiles with temperature regulation capabilities, and eco-friendly materials made from recycled resources. These developments address growing consumer demand for sustainable and functional products. Companies are focusing on enhancing product quality, aesthetic appeal, and durability to gain a competitive advantage. Technological advancements such as 3D printing and advanced weaving techniques are enabling the creation of complex designs and improved material performance.
Report Scope & Segmentation Analysis
This report segments the USA home textile market by material type (bed linen, bath linen, kitchen linen, upholstery, floor covering) and distribution channel (supermarkets/hypermarkets, specialty stores, online, others). Each segment's growth projections, market size, and competitive dynamics are analyzed, offering granular insight into market performance. For instance, the online channel is expected to show the highest CAGR, while bed linen holds the largest market share among material types. Competitive dynamics vary across segments, with higher concentration in certain areas and greater fragmentation in others.
Key Drivers of USA Home Textile Industry Growth
Several factors propel the growth of the USA home textile industry. Rising disposable incomes allow consumers to increase their spending on home furnishings. The growing popularity of home décor and the desire for improved comfort contribute to higher demand. Technological advancements lead to innovative product development and increased efficiency in production. Favorable government policies and infrastructural development further support industry expansion.
Challenges in the USA Home Textile Industry Sector
The USA home textile industry faces challenges such as fluctuating raw material prices, increasing labor costs, and stringent environmental regulations, leading to increased production costs. Supply chain disruptions pose risks to timely delivery and production. Intense competition from both domestic and international players requires continuous innovation and efficient operations. These factors can impact profitability and necessitate strategic adjustments.
Emerging Opportunities in USA Home Textile Industry
Emerging opportunities lie in the growing demand for sustainable and eco-friendly products, smart home integration, and personalized designs. The increasing adoption of online sales channels presents significant growth potential. Expansion into niche markets and exploration of new materials like recycled fibers and innovative manufacturing technologies present promising avenues for growth.
Leading Players in the USA Home Textile Industry Market
- Welspun USA
- Shaw Industries
- Milliken
- WestPoint Home
- Ralph Lauren
- Standard Textile
- TJX Companies
- Etro Home Collection
- Mohawk Industries
- Jim Thompson Fabrics
Key Developments in USA Home Textile Industry Industry
- June 2022: Mohawk Industries acquired Vitromex for approximately $293 Million, expanding its presence in the ceramic tile market.
- December 2022: Milliken & Company invested $27.4 Million in expanding its operations in Cherokee County, creating 75 new jobs.
Strategic Outlook for USA Home Textile Industry Market
The USA home textile industry is poised for sustained growth, driven by positive consumer sentiment, technological advancements, and increasing demand for comfortable and aesthetically pleasing home furnishings. Strategic focus on sustainable practices, innovative product development, and efficient supply chain management will be crucial for success. Expansion into e-commerce and the development of smart home textile products present substantial opportunities for growth in the coming years.
USA Home Textile Industry Segmentation
-
1. Material Type
- 1.1. Bed Linen
- 1.2. Bath Linen
- 1.3. Kitchen Linen
- 1.4. Upholstery
- 1.5. Floor Covering
-
2. Distribution Channel
- 2.1. Supermarkets and Hypermarkets
- 2.2. Specialty Stores
- 2.3. Online
- 2.4. Others
USA Home Textile Industry Segmentation By Geography
-
1. North America
- 1.1. United States
- 1.2. Canada
- 1.3. Mexico
-
2. South America
- 2.1. Brazil
- 2.2. Argentina
- 2.3. Rest of South America
-
3. Europe
- 3.1. United Kingdom
- 3.2. Germany
- 3.3. France
- 3.4. Italy
- 3.5. Spain
- 3.6. Russia
- 3.7. Benelux
- 3.8. Nordics
- 3.9. Rest of Europe
-
4. Middle East & Africa
- 4.1. Turkey
- 4.2. Israel
- 4.3. GCC
- 4.4. North Africa
- 4.5. South Africa
- 4.6. Rest of Middle East & Africa
-
5. Asia Pacific
- 5.1. China
- 5.2. India
- 5.3. Japan
- 5.4. South Korea
- 5.5. ASEAN
- 5.6. Oceania
- 5.7. Rest of Asia Pacific
USA Home Textile Industry REPORT HIGHLIGHTS
| Aspects | Details |
|---|---|
| Study Period | 2019-2033 |
| Base Year | 2024 |
| Estimated Year | 2025 |
| Forecast Period | 2025-2033 |
| Historical Period | 2019-2024 |
| Growth Rate | CAGR of 5.42% from 2019-2033 |
| Segmentation |
|
Table of Contents
- 1. Introduction
- 1.1. Research Scope
- 1.2. Market Segmentation
- 1.3. Research Methodology
- 1.4. Definitions and Assumptions
- 2. Executive Summary
- 2.1. Introduction
- 3. Market Dynamics
- 3.1. Introduction
- 3.2. Market Drivers
- 3.2.1. High Resistance to Scratches and Stains Drives the Market; High Durability Drives the Market
- 3.3. Market Restrains
- 3.3.1. Excess Water Damages the Floor Covering; Exposure to Sun Cause Damages to the Floor Covering; Market Oppurtunities4.; Technological Advancements in Floor Covering Market4.; Increasing Demand for Hardwood Floors
- 3.4. Market Trends
- 3.4.1. Increasing Sector of Real Estate is Driving the Market
- 4. Market Factor Analysis
- 4.1. Porters Five Forces
- 4.2. Supply/Value Chain
- 4.3. PESTEL analysis
- 4.4. Market Entropy
- 4.5. Patent/Trademark Analysis
- 5. Global USA Home Textile Industry Analysis, Insights and Forecast, 2019-2031
- 5.1. Market Analysis, Insights and Forecast - by Material Type
- 5.1.1. Bed Linen
- 5.1.2. Bath Linen
- 5.1.3. Kitchen Linen
- 5.1.4. Upholstery
- 5.1.5. Floor Covering
- 5.2. Market Analysis, Insights and Forecast - by Distribution Channel
- 5.2.1. Supermarkets and Hypermarkets
- 5.2.2. Specialty Stores
- 5.2.3. Online
- 5.2.4. Others
- 5.3. Market Analysis, Insights and Forecast - by Region
- 5.3.1. North America
- 5.3.2. South America
- 5.3.3. Europe
- 5.3.4. Middle East & Africa
- 5.3.5. Asia Pacific
- 5.1. Market Analysis, Insights and Forecast - by Material Type
- 6. North America USA Home Textile Industry Analysis, Insights and Forecast, 2019-2031
- 6.1. Market Analysis, Insights and Forecast - by Material Type
- 6.1.1. Bed Linen
- 6.1.2. Bath Linen
- 6.1.3. Kitchen Linen
- 6.1.4. Upholstery
- 6.1.5. Floor Covering
- 6.2. Market Analysis, Insights and Forecast - by Distribution Channel
- 6.2.1. Supermarkets and Hypermarkets
- 6.2.2. Specialty Stores
- 6.2.3. Online
- 6.2.4. Others
- 6.1. Market Analysis, Insights and Forecast - by Material Type
- 7. South America USA Home Textile Industry Analysis, Insights and Forecast, 2019-2031
- 7.1. Market Analysis, Insights and Forecast - by Material Type
- 7.1.1. Bed Linen
- 7.1.2. Bath Linen
- 7.1.3. Kitchen Linen
- 7.1.4. Upholstery
- 7.1.5. Floor Covering
- 7.2. Market Analysis, Insights and Forecast - by Distribution Channel
- 7.2.1. Supermarkets and Hypermarkets
- 7.2.2. Specialty Stores
- 7.2.3. Online
- 7.2.4. Others
- 7.1. Market Analysis, Insights and Forecast - by Material Type
- 8. Europe USA Home Textile Industry Analysis, Insights and Forecast, 2019-2031
- 8.1. Market Analysis, Insights and Forecast - by Material Type
- 8.1.1. Bed Linen
- 8.1.2. Bath Linen
- 8.1.3. Kitchen Linen
- 8.1.4. Upholstery
- 8.1.5. Floor Covering
- 8.2. Market Analysis, Insights and Forecast - by Distribution Channel
- 8.2.1. Supermarkets and Hypermarkets
- 8.2.2. Specialty Stores
- 8.2.3. Online
- 8.2.4. Others
- 8.1. Market Analysis, Insights and Forecast - by Material Type
- 9. Middle East & Africa USA Home Textile Industry Analysis, Insights and Forecast, 2019-2031
- 9.1. Market Analysis, Insights and Forecast - by Material Type
- 9.1.1. Bed Linen
- 9.1.2. Bath Linen
- 9.1.3. Kitchen Linen
- 9.1.4. Upholstery
- 9.1.5. Floor Covering
- 9.2. Market Analysis, Insights and Forecast - by Distribution Channel
- 9.2.1. Supermarkets and Hypermarkets
- 9.2.2. Specialty Stores
- 9.2.3. Online
- 9.2.4. Others
- 9.1. Market Analysis, Insights and Forecast - by Material Type
- 10. Asia Pacific USA Home Textile Industry Analysis, Insights and Forecast, 2019-2031
- 10.1. Market Analysis, Insights and Forecast - by Material Type
- 10.1.1. Bed Linen
- 10.1.2. Bath Linen
- 10.1.3. Kitchen Linen
- 10.1.4. Upholstery
- 10.1.5. Floor Covering
- 10.2. Market Analysis, Insights and Forecast - by Distribution Channel
- 10.2.1. Supermarkets and Hypermarkets
- 10.2.2. Specialty Stores
- 10.2.3. Online
- 10.2.4. Others
- 10.1. Market Analysis, Insights and Forecast - by Material Type
- 11. Northeast USA Home Textile Industry Analysis, Insights and Forecast, 2019-2031
- 12. Southeast USA Home Textile Industry Analysis, Insights and Forecast, 2019-2031
- 13. Midwest USA Home Textile Industry Analysis, Insights and Forecast, 2019-2031
- 14. Southwest USA Home Textile Industry Analysis, Insights and Forecast, 2019-2031
- 15. West USA Home Textile Industry Analysis, Insights and Forecast, 2019-2031
- 16. Competitive Analysis
- 16.1. Global Market Share Analysis 2024
- 16.2. Company Profiles
- 16.2.1 Welspun USA
- 16.2.1.1. Overview
- 16.2.1.2. Products
- 16.2.1.3. SWOT Analysis
- 16.2.1.4. Recent Developments
- 16.2.1.5. Financials (Based on Availability)
- 16.2.2 Shaw Industries
- 16.2.2.1. Overview
- 16.2.2.2. Products
- 16.2.2.3. SWOT Analysis
- 16.2.2.4. Recent Developments
- 16.2.2.5. Financials (Based on Availability)
- 16.2.3 Milliken
- 16.2.3.1. Overview
- 16.2.3.2. Products
- 16.2.3.3. SWOT Analysis
- 16.2.3.4. Recent Developments
- 16.2.3.5. Financials (Based on Availability)
- 16.2.4 WestPoint Home
- 16.2.4.1. Overview
- 16.2.4.2. Products
- 16.2.4.3. SWOT Analysis
- 16.2.4.4. Recent Developments
- 16.2.4.5. Financials (Based on Availability)
- 16.2.5 Ralph Lauren
- 16.2.5.1. Overview
- 16.2.5.2. Products
- 16.2.5.3. SWOT Analysis
- 16.2.5.4. Recent Developments
- 16.2.5.5. Financials (Based on Availability)
- 16.2.6 Standard Textile**List Not Exhaustive
- 16.2.6.1. Overview
- 16.2.6.2. Products
- 16.2.6.3. SWOT Analysis
- 16.2.6.4. Recent Developments
- 16.2.6.5. Financials (Based on Availability)
- 16.2.7 TJX Companies
- 16.2.7.1. Overview
- 16.2.7.2. Products
- 16.2.7.3. SWOT Analysis
- 16.2.7.4. Recent Developments
- 16.2.7.5. Financials (Based on Availability)
- 16.2.8 Etro Home Collection
- 16.2.8.1. Overview
- 16.2.8.2. Products
- 16.2.8.3. SWOT Analysis
- 16.2.8.4. Recent Developments
- 16.2.8.5. Financials (Based on Availability)
- 16.2.9 Mohawk Industries
- 16.2.9.1. Overview
- 16.2.9.2. Products
- 16.2.9.3. SWOT Analysis
- 16.2.9.4. Recent Developments
- 16.2.9.5. Financials (Based on Availability)
- 16.2.10 Jim Thompson Fabrics
- 16.2.10.1. Overview
- 16.2.10.2. Products
- 16.2.10.3. SWOT Analysis
- 16.2.10.4. Recent Developments
- 16.2.10.5. Financials (Based on Availability)
- 16.2.1 Welspun USA
List of Figures
- Figure 1: Global USA Home Textile Industry Revenue Breakdown (Million, %) by Region 2024 & 2032
- Figure 2: United states USA Home Textile Industry Revenue (Million), by Country 2024 & 2032
- Figure 3: United states USA Home Textile Industry Revenue Share (%), by Country 2024 & 2032
- Figure 4: North America USA Home Textile Industry Revenue (Million), by Material Type 2024 & 2032
- Figure 5: North America USA Home Textile Industry Revenue Share (%), by Material Type 2024 & 2032
- Figure 6: North America USA Home Textile Industry Revenue (Million), by Distribution Channel 2024 & 2032
- Figure 7: North America USA Home Textile Industry Revenue Share (%), by Distribution Channel 2024 & 2032
- Figure 8: North America USA Home Textile Industry Revenue (Million), by Country 2024 & 2032
- Figure 9: North America USA Home Textile Industry Revenue Share (%), by Country 2024 & 2032
- Figure 10: South America USA Home Textile Industry Revenue (Million), by Material Type 2024 & 2032
- Figure 11: South America USA Home Textile Industry Revenue Share (%), by Material Type 2024 & 2032
- Figure 12: South America USA Home Textile Industry Revenue (Million), by Distribution Channel 2024 & 2032
- Figure 13: South America USA Home Textile Industry Revenue Share (%), by Distribution Channel 2024 & 2032
- Figure 14: South America USA Home Textile Industry Revenue (Million), by Country 2024 & 2032
- Figure 15: South America USA Home Textile Industry Revenue Share (%), by Country 2024 & 2032
- Figure 16: Europe USA Home Textile Industry Revenue (Million), by Material Type 2024 & 2032
- Figure 17: Europe USA Home Textile Industry Revenue Share (%), by Material Type 2024 & 2032
- Figure 18: Europe USA Home Textile Industry Revenue (Million), by Distribution Channel 2024 & 2032
- Figure 19: Europe USA Home Textile Industry Revenue Share (%), by Distribution Channel 2024 & 2032
- Figure 20: Europe USA Home Textile Industry Revenue (Million), by Country 2024 & 2032
- Figure 21: Europe USA Home Textile Industry Revenue Share (%), by Country 2024 & 2032
- Figure 22: Middle East & Africa USA Home Textile Industry Revenue (Million), by Material Type 2024 & 2032
- Figure 23: Middle East & Africa USA Home Textile Industry Revenue Share (%), by Material Type 2024 & 2032
- Figure 24: Middle East & Africa USA Home Textile Industry Revenue (Million), by Distribution Channel 2024 & 2032
- Figure 25: Middle East & Africa USA Home Textile Industry Revenue Share (%), by Distribution Channel 2024 & 2032
- Figure 26: Middle East & Africa USA Home Textile Industry Revenue (Million), by Country 2024 & 2032
- Figure 27: Middle East & Africa USA Home Textile Industry Revenue Share (%), by Country 2024 & 2032
- Figure 28: Asia Pacific USA Home Textile Industry Revenue (Million), by Material Type 2024 & 2032
- Figure 29: Asia Pacific USA Home Textile Industry Revenue Share (%), by Material Type 2024 & 2032
- Figure 30: Asia Pacific USA Home Textile Industry Revenue (Million), by Distribution Channel 2024 & 2032
- Figure 31: Asia Pacific USA Home Textile Industry Revenue Share (%), by Distribution Channel 2024 & 2032
- Figure 32: Asia Pacific USA Home Textile Industry Revenue (Million), by Country 2024 & 2032
- Figure 33: Asia Pacific USA Home Textile Industry Revenue Share (%), by Country 2024 & 2032
List of Tables
- Table 1: Global USA Home Textile Industry Revenue Million Forecast, by Region 2019 & 2032
- Table 2: Global USA Home Textile Industry Revenue Million Forecast, by Material Type 2019 & 2032
- Table 3: Global USA Home Textile Industry Revenue Million Forecast, by Distribution Channel 2019 & 2032
- Table 4: Global USA Home Textile Industry Revenue Million Forecast, by Region 2019 & 2032
- Table 5: Global USA Home Textile Industry Revenue Million Forecast, by Country 2019 & 2032
- Table 6: Northeast USA Home Textile Industry Revenue (Million) Forecast, by Application 2019 & 2032
- Table 7: Southeast USA Home Textile Industry Revenue (Million) Forecast, by Application 2019 & 2032
- Table 8: Midwest USA Home Textile Industry Revenue (Million) Forecast, by Application 2019 & 2032
- Table 9: Southwest USA Home Textile Industry Revenue (Million) Forecast, by Application 2019 & 2032
- Table 10: West USA Home Textile Industry Revenue (Million) Forecast, by Application 2019 & 2032
- Table 11: Global USA Home Textile Industry Revenue Million Forecast, by Material Type 2019 & 2032
- Table 12: Global USA Home Textile Industry Revenue Million Forecast, by Distribution Channel 2019 & 2032
- Table 13: Global USA Home Textile Industry Revenue Million Forecast, by Country 2019 & 2032
- Table 14: United States USA Home Textile Industry Revenue (Million) Forecast, by Application 2019 & 2032
- Table 15: Canada USA Home Textile Industry Revenue (Million) Forecast, by Application 2019 & 2032
- Table 16: Mexico USA Home Textile Industry Revenue (Million) Forecast, by Application 2019 & 2032
- Table 17: Global USA Home Textile Industry Revenue Million Forecast, by Material Type 2019 & 2032
- Table 18: Global USA Home Textile Industry Revenue Million Forecast, by Distribution Channel 2019 & 2032
- Table 19: Global USA Home Textile Industry Revenue Million Forecast, by Country 2019 & 2032
- Table 20: Brazil USA Home Textile Industry Revenue (Million) Forecast, by Application 2019 & 2032
- Table 21: Argentina USA Home Textile Industry Revenue (Million) Forecast, by Application 2019 & 2032
- Table 22: Rest of South America USA Home Textile Industry Revenue (Million) Forecast, by Application 2019 & 2032
- Table 23: Global USA Home Textile Industry Revenue Million Forecast, by Material Type 2019 & 2032
- Table 24: Global USA Home Textile Industry Revenue Million Forecast, by Distribution Channel 2019 & 2032
- Table 25: Global USA Home Textile Industry Revenue Million Forecast, by Country 2019 & 2032
- Table 26: United Kingdom USA Home Textile Industry Revenue (Million) Forecast, by Application 2019 & 2032
- Table 27: Germany USA Home Textile Industry Revenue (Million) Forecast, by Application 2019 & 2032
- Table 28: France USA Home Textile Industry Revenue (Million) Forecast, by Application 2019 & 2032
- Table 29: Italy USA Home Textile Industry Revenue (Million) Forecast, by Application 2019 & 2032
- Table 30: Spain USA Home Textile Industry Revenue (Million) Forecast, by Application 2019 & 2032
- Table 31: Russia USA Home Textile Industry Revenue (Million) Forecast, by Application 2019 & 2032
- Table 32: Benelux USA Home Textile Industry Revenue (Million) Forecast, by Application 2019 & 2032
- Table 33: Nordics USA Home Textile Industry Revenue (Million) Forecast, by Application 2019 & 2032
- Table 34: Rest of Europe USA Home Textile Industry Revenue (Million) Forecast, by Application 2019 & 2032
- Table 35: Global USA Home Textile Industry Revenue Million Forecast, by Material Type 2019 & 2032
- Table 36: Global USA Home Textile Industry Revenue Million Forecast, by Distribution Channel 2019 & 2032
- Table 37: Global USA Home Textile Industry Revenue Million Forecast, by Country 2019 & 2032
- Table 38: Turkey USA Home Textile Industry Revenue (Million) Forecast, by Application 2019 & 2032
- Table 39: Israel USA Home Textile Industry Revenue (Million) Forecast, by Application 2019 & 2032
- Table 40: GCC USA Home Textile Industry Revenue (Million) Forecast, by Application 2019 & 2032
- Table 41: North Africa USA Home Textile Industry Revenue (Million) Forecast, by Application 2019 & 2032
- Table 42: South Africa USA Home Textile Industry Revenue (Million) Forecast, by Application 2019 & 2032
- Table 43: Rest of Middle East & Africa USA Home Textile Industry Revenue (Million) Forecast, by Application 2019 & 2032
- Table 44: Global USA Home Textile Industry Revenue Million Forecast, by Material Type 2019 & 2032
- Table 45: Global USA Home Textile Industry Revenue Million Forecast, by Distribution Channel 2019 & 2032
- Table 46: Global USA Home Textile Industry Revenue Million Forecast, by Country 2019 & 2032
- Table 47: China USA Home Textile Industry Revenue (Million) Forecast, by Application 2019 & 2032
- Table 48: India USA Home Textile Industry Revenue (Million) Forecast, by Application 2019 & 2032
- Table 49: Japan USA Home Textile Industry Revenue (Million) Forecast, by Application 2019 & 2032
- Table 50: South Korea USA Home Textile Industry Revenue (Million) Forecast, by Application 2019 & 2032
- Table 51: ASEAN USA Home Textile Industry Revenue (Million) Forecast, by Application 2019 & 2032
- Table 52: Oceania USA Home Textile Industry Revenue (Million) Forecast, by Application 2019 & 2032
- Table 53: Rest of Asia Pacific USA Home Textile Industry Revenue (Million) Forecast, by Application 2019 & 2032
Frequently Asked Questions
1. What is the projected Compound Annual Growth Rate (CAGR) of the USA Home Textile Industry?
The projected CAGR is approximately 5.42%.
2. Which companies are prominent players in the USA Home Textile Industry?
Key companies in the market include Welspun USA, Shaw Industries, Milliken, WestPoint Home, Ralph Lauren, Standard Textile**List Not Exhaustive, TJX Companies, Etro Home Collection, Mohawk Industries, Jim Thompson Fabrics.
3. What are the main segments of the USA Home Textile Industry?
The market segments include Material Type, Distribution Channel.
4. Can you provide details about the market size?
The market size is estimated to be USD 23.78 Million as of 2022.
5. What are some drivers contributing to market growth?
High Resistance to Scratches and Stains Drives the Market; High Durability Drives the Market.
6. What are the notable trends driving market growth?
Increasing Sector of Real Estate is Driving the Market.
7. Are there any restraints impacting market growth?
Excess Water Damages the Floor Covering; Exposure to Sun Cause Damages to the Floor Covering; Market Oppurtunities4.; Technological Advancements in Floor Covering Market4.; Increasing Demand for Hardwood Floors.
8. Can you provide examples of recent developments in the market?
December 2022: Milliken & Company, a diversified global textile manufacturer with more than 70 locations worldwide, plans to expand operations in Cherokee County. The company's $27.4 million investment will create 75 new jobs.
9. What pricing options are available for accessing the report?
Pricing options include single-user, multi-user, and enterprise licenses priced at USD 3800, USD 4500, and USD 5800 respectively.
10. Is the market size provided in terms of value or volume?
The market size is provided in terms of value, measured in Million.
11. Are there any specific market keywords associated with the report?
Yes, the market keyword associated with the report is "USA Home Textile Industry," which aids in identifying and referencing the specific market segment covered.
12. How do I determine which pricing option suits my needs best?
The pricing options vary based on user requirements and access needs. Individual users may opt for single-user licenses, while businesses requiring broader access may choose multi-user or enterprise licenses for cost-effective access to the report.
13. Are there any additional resources or data provided in the USA Home Textile Industry report?
While the report offers comprehensive insights, it's advisable to review the specific contents or supplementary materials provided to ascertain if additional resources or data are available.
14. How can I stay updated on further developments or reports in the USA Home Textile Industry?
To stay informed about further developments, trends, and reports in the USA Home Textile Industry, consider subscribing to industry newsletters, following relevant companies and organizations, or regularly checking reputable industry news sources and publications.
Methodology
Step 1 - Identification of Relevant Samples Size from Population Database


Step 2 - Approaches for Defining Global Market Size (Value, Volume* & Price*)

Note*: In applicable scenarios
Step 3 - Data Sources
Primary Research
- Web Analytics
- Survey Reports
- Research Institute
- Latest Research Reports
- Opinion Leaders
Secondary Research
- Annual Reports
- White Paper
- Latest Press Release
- Industry Association
- Paid Database
- Investor Presentations

Step 4 - Data Triangulation
Involves using different sources of information in order to increase the validity of a study
These sources are likely to be stakeholders in a program - participants, other researchers, program staff, other community members, and so on.
Then we put all data in single framework & apply various statistical tools to find out the dynamic on the market.
During the analysis stage, feedback from the stakeholder groups would be compared to determine areas of agreement as well as areas of divergence


