Key Insights
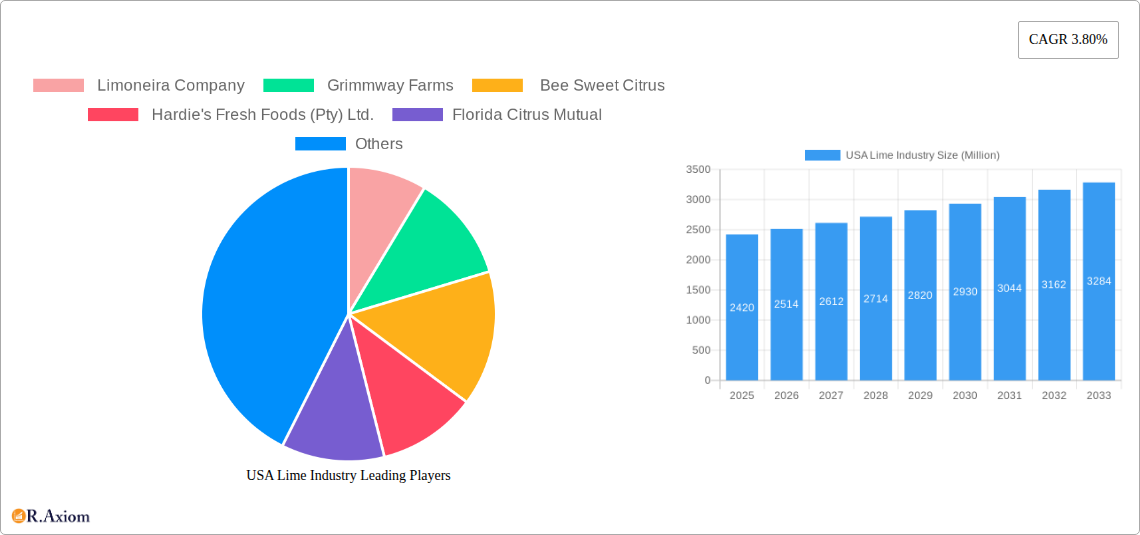
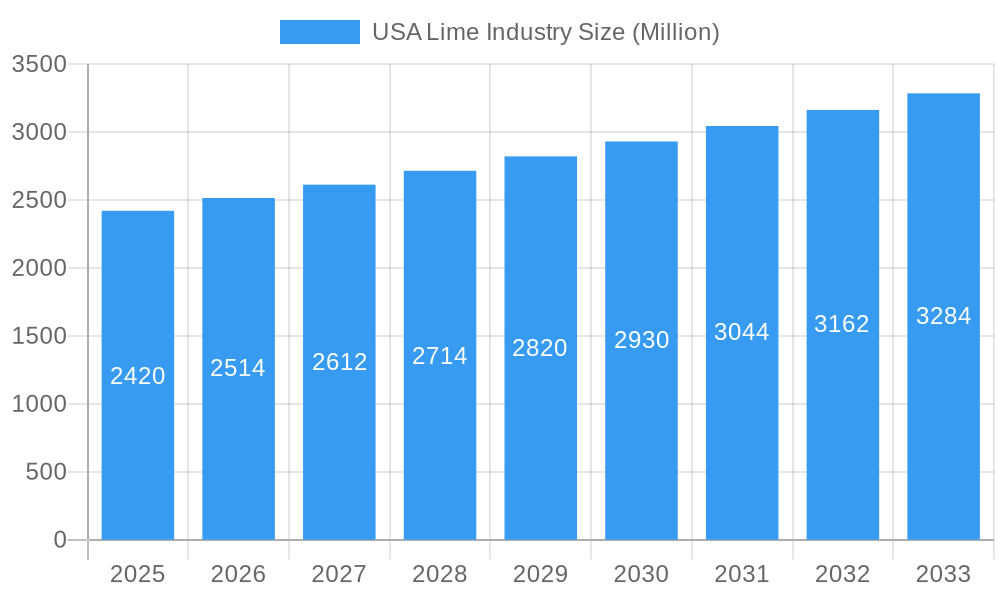
The US lime industry, valued at $2.42 billion in 2025, is projected to experience steady growth, with a compound annual growth rate (CAGR) of 3.80% from 2025 to 2033. This growth is fueled by several key factors. Increased consumer demand for healthy and flavorful beverages and culinary options drives consumption. The rising popularity of lime juice in various food and beverage applications, including cocktails, soft drinks, and culinary dishes, significantly contributes to market expansion. Furthermore, the growing awareness of the health benefits associated with limes, such as their rich vitamin C content and antioxidant properties, enhances their appeal among health-conscious consumers. The industry benefits from established distribution channels, including supermarkets, restaurants, and food processing facilities, facilitating easy access for consumers. However, factors such as seasonal variations in lime production, susceptibility to pests and diseases, and fluctuations in global supply chains pose challenges to consistent growth. Competitive pressures among major players like Limoneira Company, Grimmway Farms, and Sunkist Growers also influence market dynamics. Regional variations in consumption patterns are observed, with the Southwest and West regions likely exhibiting higher demand due to their climate and culinary traditions. The industry's success will depend on its ability to manage these challenges effectively and leverage opportunities presented by evolving consumer preferences and technological advancements in cultivation and processing.
USA Lime Industry Market Size (In Billion)
The forecast period from 2025 to 2033 shows promising growth potential for the US lime industry. The expansion into innovative product formats, such as ready-to-drink lime juices and lime-infused beverages, caters to convenience-seeking consumers. Moreover, the increasing focus on sustainable and ethical sourcing practices enhances the industry’s image among environmentally conscious buyers. Strategic partnerships between lime producers and food processing companies will streamline the supply chain and ensure timely delivery to consumers. Government support for research and development in improving lime cultivation techniques and pest management will further boost production efficiency. Competition within the industry will likely drive innovation and enhance the overall quality and availability of limes in the market. Sustained marketing campaigns highlighting the versatility and health benefits of limes will further solidify their position in the consumer market. Maintaining a strong supply chain and managing potential disruptions caused by climatic factors and global events are crucial for ensuring the industry's long-term growth and profitability.
USA Lime Industry Company Market Share
This in-depth report provides a comprehensive analysis of the USA lime industry, offering invaluable insights for industry stakeholders, investors, and businesses seeking to navigate this dynamic market. Covering the period from 2019 to 2033, with a base year of 2025, this report forecasts market trends, identifies key players, and highlights emerging opportunities. The study incorporates extensive data analysis of production, consumption, import/export, and price trends, providing actionable intelligence for strategic decision-making.
USA Lime Industry Market Concentration & Innovation
This section analyzes the competitive landscape of the US lime industry, examining market concentration, innovation drivers, regulatory influences, substitute products, end-user trends, and mergers & acquisitions (M&A) activities. The report quantifies market share for key players and evaluates the financial implications of significant M&A deals. The analysis explores the impact of technological advancements on production efficiency, product quality, and market competitiveness. Regulatory frameworks governing lime production, trade, and labeling are assessed to understand their influence on market dynamics. The role of substitute products and evolving consumer preferences are also considered.
- Market Concentration: The US lime market exhibits a moderately concentrated structure, with a few dominant players controlling a significant portion of the market. Market share data for key players will be presented in the full report.
- Innovation Drivers: Technological advancements in post-harvest technologies (e.g., Hazel Technologies’ Hazel 100) are driving innovation, enhancing lime shelf life and reducing waste.
- Regulatory Framework: Federal and state regulations concerning food safety, labeling, and pesticide use significantly shape industry practices.
- Product Substitutes: Other citrus fruits and juices compete with limes, influencing consumer choices and market demand.
- End-User Trends: Growing consumer demand for fresh produce and functional foods drives market growth. The report details the influence of health-conscious consumers on the lime market.
- M&A Activities: The report identifies completed and potential M&A activities, analyzing their impacts on market consolidation and competitiveness. The total value of M&A deals within the study period is estimated at xx Million.
USA Lime Industry Industry Trends & Insights
This section delves into the key trends shaping the US lime industry, providing a detailed analysis of market growth drivers, technological disruptions, evolving consumer preferences, and competitive dynamics. The report utilizes historical data (2019-2024) and projects future growth (2025-2033) using established forecasting models. Specific metrics, including the Compound Annual Growth Rate (CAGR) and market penetration rates, are included. The report examines fluctuations in supply and demand, influenced by factors such as weather patterns, disease outbreaks, and economic conditions.
- Market size and CAGR projections for the forecast period will be detailed in the full report.
- Market penetration of key lime varieties and processing methods is analyzed.
- The report identifies emerging trends in consumer preferences, focusing on factors like organic limes, convenient packaging, and specialty lime varieties.
- A detailed competitive analysis assesses the market positioning and strategic actions of major players.
Dominant Markets & Segments in USA Lime Industry
This section identifies the leading regions, countries, and segments within the US lime industry, analyzing their respective market dominance. It examines the drivers underpinning this dominance, including economic policies, infrastructure development, and consumer behavior. The analysis covers production, consumption, import, export, and price trends for each segment.
- United States: Production Analysis: California and Florida are the leading lime-producing states, accounting for xx Million of total production in 2024. Key drivers include favorable climate and established agricultural infrastructure.
- United States: Consumption Analysis: Consumption is highest in regions with large populations and strong food service industries. Detailed consumption patterns will be presented in the full report.
- United States: Market Value: The total market value of limes in the US is estimated to be xx Million in 2024.
- Import Market Analysis (Volume and Value): The report details import volumes and values from major exporting countries, analyzing trade patterns and import tariffs. Estimated import values for 2024 are xx Million.
- Export Market Analysis (Volume and Value): The report analyzes US lime exports, their destinations, and associated value chains. Estimated export values for 2024 are xx Million.
- Price Trend Analysis: The report provides an in-depth analysis of price fluctuations, considering factors such as supply, demand, and seasonal variations. Average lime prices in 2024 are projected at xx per unit.
USA Lime Industry Product Developments
This section summarizes recent product innovations, applications, and competitive advantages within the US lime industry. The report examines technological advancements in lime processing, packaging, and preservation, evaluating their impact on product quality, shelf life, and market competitiveness.
The industry is witnessing innovation in post-harvest technologies and packaging to extend the shelf life and improve the quality of limes. This enhances consumer appeal and minimizes post-harvest losses.
Report Scope & Segmentation Analysis
This report segments the US lime industry based on various factors, providing detailed analysis and growth projections for each segment.
- By Type: Key lime, Persian lime, etc.
- By Form: Fresh, processed (juice, concentrates).
- By Distribution Channel: Retail, food service, wholesale.
- By Region: California, Florida, and other states.
Each segment's growth projections, market sizes, and competitive dynamics will be detailed in the full report.
Key Drivers of USA Lime Industry Growth
Several factors are driving the growth of the US lime industry. These include rising consumer demand for healthy and convenient food options, technological advancements improving production efficiency and lime shelf life, and favorable economic conditions in key consuming regions. Government support for agricultural research and development also contributes to industry growth.
Challenges in the USA Lime Industry Sector
The US lime industry faces challenges such as fluctuating lime prices due to climatic conditions, competition from other citrus fruits, and increasing input costs such as fertilizer and labor. Supply chain disruptions and the impact of disease outbreaks can significantly affect production and availability. Furthermore, stricter regulatory requirements regarding food safety and environmental sustainability increase operational costs. The impact of these challenges on profitability is estimated to be xx Million annually.
Emerging Opportunities in USA Lime Industry
Growing consumer demand for functional foods and beverages, the expanding food service sector, and the increasing adoption of innovative processing and packaging technologies present significant opportunities for growth. Exploring niche market segments (e.g., organic limes, specialty lime varieties) and expanding into export markets offer additional potential.
Leading Players in the USA Lime Industry Market
- Limoneira Company
- Grimmway Farms
- Bee Sweet Citrus
- Hardie's Fresh Foods (Pty) Ltd.
- Florida Citrus Mutual
- Sunkist Growers
- Wonderful Citrus
- California Citrus Mutual
Key Developments in USA Lime Industry Industry
- August 2022: Hazel Technologies Inc. introduced Hazel 100, extending the freshness of limes.
- February 2022: Rising input costs, particularly fertilizers and logistics, were predicted to increase lime prices.
Strategic Outlook for USA Lime Industry Market
The US lime industry is poised for continued growth, driven by factors such as rising consumer demand, technological innovation, and the expansion of the food service sector. Focusing on sustainability, improving supply chain efficiency, and capitalizing on emerging market segments will be crucial for future success. The market is expected to reach xx Million by 2033, presenting significant opportunities for both established players and new entrants.
USA Lime Industry Segmentation
-
1. United States
- 1.1. Production Analysis
- 1.2. Consumption Analysis and Market Value
- 1.3. Import Market Analysis (Volume and Value)
- 1.4. Export Market Analysis (Volume and Value)
- 1.5. Price Trend Analysis
-
2. United States
- 2.1. Production Analysis
- 2.2. Consumption Analysis and Market Value
- 2.3. Import Market Analysis (Volume and Value)
- 2.4. Export Market Analysis (Volume and Value)
- 2.5. Price Trend Analysis
USA Lime Industry Segmentation By Geography
-
1. North America
- 1.1. United States
- 1.2. Canada
- 1.3. Mexico
-
2. South America
- 2.1. Brazil
- 2.2. Argentina
- 2.3. Rest of South America
-
3. Europe
- 3.1. United Kingdom
- 3.2. Germany
- 3.3. France
- 3.4. Italy
- 3.5. Spain
- 3.6. Russia
- 3.7. Benelux
- 3.8. Nordics
- 3.9. Rest of Europe
-
4. Middle East & Africa
- 4.1. Turkey
- 4.2. Israel
- 4.3. GCC
- 4.4. North Africa
- 4.5. South Africa
- 4.6. Rest of Middle East & Africa
-
5. Asia Pacific
- 5.1. China
- 5.2. India
- 5.3. Japan
- 5.4. South Korea
- 5.5. ASEAN
- 5.6. Oceania
- 5.7. Rest of Asia Pacific
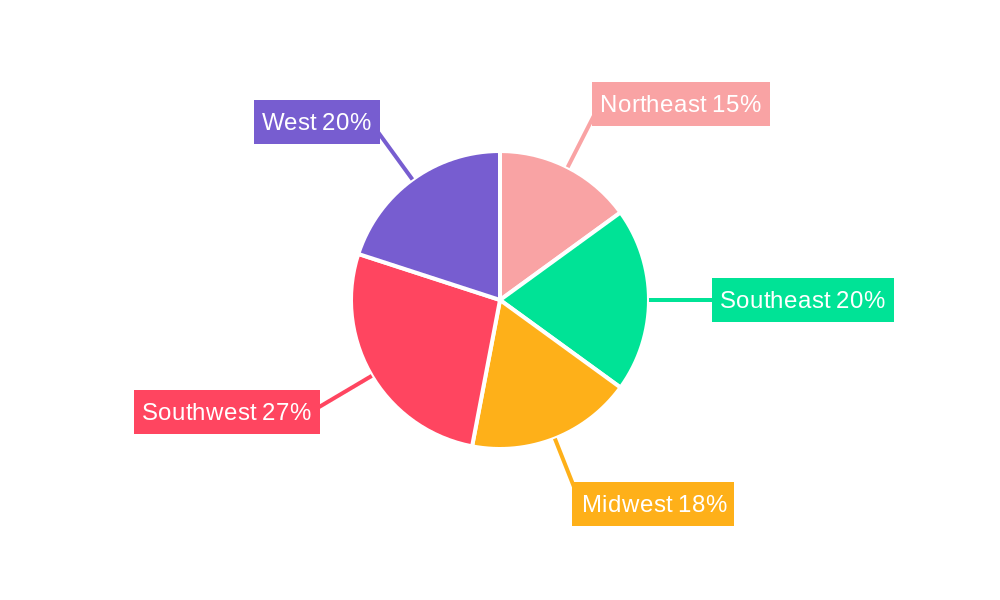
USA Lime Industry Regional Market Share
Geographic Coverage of USA Lime Industry
USA Lime Industry REPORT HIGHLIGHTS
| Aspects | Details |
|---|---|
| Study Period | 2020-2034 |
| Base Year | 2025 |
| Estimated Year | 2026 |
| Forecast Period | 2026-2034 |
| Historical Period | 2020-2025 |
| Growth Rate | CAGR of 3.80% from 2020-2034 |
| Segmentation |
|
Table of Contents
- 1. Introduction
- 1.1. Research Scope
- 1.2. Market Segmentation
- 1.3. Research Objective
- 1.4. Definitions and Assumptions
- 2. Executive Summary
- 2.1. Market Snapshot
- 3. Market Dynamics
- 3.1. Market Drivers
- 3.2. Market Restrains
- 3.3. Market Trends
- 3.4. Market Opportunities
- 4. Market Factor Analysis
- 4.1. Porters Five Forces
- 4.1.1. Bargaining Power of Suppliers
- 4.1.2. Bargaining Power of Buyers
- 4.1.3. Threat of New Entrants
- 4.1.4. Threat of Substitutes
- 4.1.5. Competitive Rivalry
- 4.2. PESTEL analysis
- 4.3. BCG Analysis
- 4.3.1. Stars (High Growth, High Market Share)
- 4.3.2. Cash Cows (Low Growth, High Market Share)
- 4.3.3. Question Mark (High Growth, Low Market Share)
- 4.3.4. Dogs (Low Growth, Low Market Share)
- 4.4. Ansoff Matrix Analysis
- 4.5. Supply Chain Analysis
- 4.6. Regulatory Landscape
- 4.7. Current Market Potential and Opportunity Assessment (TAM–SAM–SOM Framework)
- 4.8. RAX Analyst Note
- 4.1. Porters Five Forces
- 5. Market Analysis, Insights and Forecast 2021-2033
- 5.1. Market Analysis, Insights and Forecast - by United States
- 5.1.1. Production Analysis
- 5.1.2. Consumption Analysis and Market Value
- 5.1.3. Import Market Analysis (Volume and Value)
- 5.1.4. Export Market Analysis (Volume and Value)
- 5.1.5. Price Trend Analysis
- 5.2. Market Analysis, Insights and Forecast - by United States
- 5.2.1. Production Analysis
- 5.2.2. Consumption Analysis and Market Value
- 5.2.3. Import Market Analysis (Volume and Value)
- 5.2.4. Export Market Analysis (Volume and Value)
- 5.2.5. Price Trend Analysis
- 5.3. Market Analysis, Insights and Forecast - by Region
- 5.3.1. North America
- 5.3.2. South America
- 5.3.3. Europe
- 5.3.4. Middle East & Africa
- 5.3.5. Asia Pacific
- 5.1. Market Analysis, Insights and Forecast - by United States
- 6. Global USA Lime Industry Analysis, Insights and Forecast, 2021-2033
- 6.1. Market Analysis, Insights and Forecast - by United States
- 6.1.1. Production Analysis
- 6.1.2. Consumption Analysis and Market Value
- 6.1.3. Import Market Analysis (Volume and Value)
- 6.1.4. Export Market Analysis (Volume and Value)
- 6.1.5. Price Trend Analysis
- 6.2. Market Analysis, Insights and Forecast - by United States
- 6.2.1. Production Analysis
- 6.2.2. Consumption Analysis and Market Value
- 6.2.3. Import Market Analysis (Volume and Value)
- 6.2.4. Export Market Analysis (Volume and Value)
- 6.2.5. Price Trend Analysis
- 6.1. Market Analysis, Insights and Forecast - by United States
- 7. North America USA Lime Industry Analysis, Insights and Forecast, 2020-2032
- 7.1. Market Analysis, Insights and Forecast - by United States
- 7.1.1. Production Analysis
- 7.1.2. Consumption Analysis and Market Value
- 7.1.3. Import Market Analysis (Volume and Value)
- 7.1.4. Export Market Analysis (Volume and Value)
- 7.1.5. Price Trend Analysis
- 7.2. Market Analysis, Insights and Forecast - by United States
- 7.2.1. Production Analysis
- 7.2.2. Consumption Analysis and Market Value
- 7.2.3. Import Market Analysis (Volume and Value)
- 7.2.4. Export Market Analysis (Volume and Value)
- 7.2.5. Price Trend Analysis
- 7.1. Market Analysis, Insights and Forecast - by United States
- 8. South America USA Lime Industry Analysis, Insights and Forecast, 2020-2032
- 8.1. Market Analysis, Insights and Forecast - by United States
- 8.1.1. Production Analysis
- 8.1.2. Consumption Analysis and Market Value
- 8.1.3. Import Market Analysis (Volume and Value)
- 8.1.4. Export Market Analysis (Volume and Value)
- 8.1.5. Price Trend Analysis
- 8.2. Market Analysis, Insights and Forecast - by United States
- 8.2.1. Production Analysis
- 8.2.2. Consumption Analysis and Market Value
- 8.2.3. Import Market Analysis (Volume and Value)
- 8.2.4. Export Market Analysis (Volume and Value)
- 8.2.5. Price Trend Analysis
- 8.1. Market Analysis, Insights and Forecast - by United States
- 9. Europe USA Lime Industry Analysis, Insights and Forecast, 2020-2032
- 9.1. Market Analysis, Insights and Forecast - by United States
- 9.1.1. Production Analysis
- 9.1.2. Consumption Analysis and Market Value
- 9.1.3. Import Market Analysis (Volume and Value)
- 9.1.4. Export Market Analysis (Volume and Value)
- 9.1.5. Price Trend Analysis
- 9.2. Market Analysis, Insights and Forecast - by United States
- 9.2.1. Production Analysis
- 9.2.2. Consumption Analysis and Market Value
- 9.2.3. Import Market Analysis (Volume and Value)
- 9.2.4. Export Market Analysis (Volume and Value)
- 9.2.5. Price Trend Analysis
- 9.1. Market Analysis, Insights and Forecast - by United States
- 10. Middle East & Africa USA Lime Industry Analysis, Insights and Forecast, 2020-2032
- 10.1. Market Analysis, Insights and Forecast - by United States
- 10.1.1. Production Analysis
- 10.1.2. Consumption Analysis and Market Value
- 10.1.3. Import Market Analysis (Volume and Value)
- 10.1.4. Export Market Analysis (Volume and Value)
- 10.1.5. Price Trend Analysis
- 10.2. Market Analysis, Insights and Forecast - by United States
- 10.2.1. Production Analysis
- 10.2.2. Consumption Analysis and Market Value
- 10.2.3. Import Market Analysis (Volume and Value)
- 10.2.4. Export Market Analysis (Volume and Value)
- 10.2.5. Price Trend Analysis
- 10.1. Market Analysis, Insights and Forecast - by United States
- 11. Asia Pacific USA Lime Industry Analysis, Insights and Forecast, 2020-2032
- 11.1. Market Analysis, Insights and Forecast - by United States
- 11.1.1. Production Analysis
- 11.1.2. Consumption Analysis and Market Value
- 11.1.3. Import Market Analysis (Volume and Value)
- 11.1.4. Export Market Analysis (Volume and Value)
- 11.1.5. Price Trend Analysis
- 11.2. Market Analysis, Insights and Forecast - by United States
- 11.2.1. Production Analysis
- 11.2.2. Consumption Analysis and Market Value
- 11.2.3. Import Market Analysis (Volume and Value)
- 11.2.4. Export Market Analysis (Volume and Value)
- 11.2.5. Price Trend Analysis
- 11.1. Market Analysis, Insights and Forecast - by United States
- 12. Competitive Analysis
- 12.1. Company Profiles
- 12.1.1 Limoneira Company
- 12.1.1.1. Company Overview
- 12.1.1.2. Products
- 12.1.1.3. Company Financials
- 12.1.1.4. SWOT Analysis
- 12.1.2 Grimmway Farms
- 12.1.2.1. Company Overview
- 12.1.2.2. Products
- 12.1.2.3. Company Financials
- 12.1.2.4. SWOT Analysis
- 12.1.3 Bee Sweet Citrus
- 12.1.3.1. Company Overview
- 12.1.3.2. Products
- 12.1.3.3. Company Financials
- 12.1.3.4. SWOT Analysis
- 12.1.4 Hardie's Fresh Foods (Pty) Ltd.
- 12.1.4.1. Company Overview
- 12.1.4.2. Products
- 12.1.4.3. Company Financials
- 12.1.4.4. SWOT Analysis
- 12.1.5 Florida Citrus Mutual
- 12.1.5.1. Company Overview
- 12.1.5.2. Products
- 12.1.5.3. Company Financials
- 12.1.5.4. SWOT Analysis
- 12.1.6 Sunkist Growers
- 12.1.6.1. Company Overview
- 12.1.6.2. Products
- 12.1.6.3. Company Financials
- 12.1.6.4. SWOT Analysis
- 12.1.7 Sunkist Growers
- 12.1.7.1. Company Overview
- 12.1.7.2. Products
- 12.1.7.3. Company Financials
- 12.1.7.4. SWOT Analysis
- 12.1.8 Wonderful Citrus
- 12.1.8.1. Company Overview
- 12.1.8.2. Products
- 12.1.8.3. Company Financials
- 12.1.8.4. SWOT Analysis
- 12.1.9 California Citrus Mutual
- 12.1.9.1. Company Overview
- 12.1.9.2. Products
- 12.1.9.3. Company Financials
- 12.1.9.4. SWOT Analysis
- 12.1.1 Limoneira Company
- 12.2. Market Entropy
- 12.2.1 Company's Key Areas Served
- 12.2.2 Recent Developments
- 12.3. Company Market Share Analysis 2025
- 12.3.1 Top 5 Companies Market Share Analysis
- 12.3.2 Top 3 Companies Market Share Analysis
- 12.4. List of Potential Customers
- 13. Research Methodology
List of Figures
- Figure 1: Global USA Lime Industry Revenue Breakdown (Million, %) by Region 2025 & 2033
- Figure 2: Global USA Lime Industry Volume Breakdown (Kiloton, %) by Region 2025 & 2033
- Figure 3: North America USA Lime Industry Revenue (Million), by United States 2025 & 2033
- Figure 4: North America USA Lime Industry Volume (Kiloton), by United States 2025 & 2033
- Figure 5: North America USA Lime Industry Revenue Share (%), by United States 2025 & 2033
- Figure 6: North America USA Lime Industry Volume Share (%), by United States 2025 & 2033
- Figure 7: North America USA Lime Industry Revenue (Million), by United States 2025 & 2033
- Figure 8: North America USA Lime Industry Volume (Kiloton), by United States 2025 & 2033
- Figure 9: North America USA Lime Industry Revenue Share (%), by United States 2025 & 2033
- Figure 10: North America USA Lime Industry Volume Share (%), by United States 2025 & 2033
- Figure 11: North America USA Lime Industry Revenue (Million), by Country 2025 & 2033
- Figure 12: North America USA Lime Industry Volume (Kiloton), by Country 2025 & 2033
- Figure 13: North America USA Lime Industry Revenue Share (%), by Country 2025 & 2033
- Figure 14: North America USA Lime Industry Volume Share (%), by Country 2025 & 2033
- Figure 15: South America USA Lime Industry Revenue (Million), by United States 2025 & 2033
- Figure 16: South America USA Lime Industry Volume (Kiloton), by United States 2025 & 2033
- Figure 17: South America USA Lime Industry Revenue Share (%), by United States 2025 & 2033
- Figure 18: South America USA Lime Industry Volume Share (%), by United States 2025 & 2033
- Figure 19: South America USA Lime Industry Revenue (Million), by United States 2025 & 2033
- Figure 20: South America USA Lime Industry Volume (Kiloton), by United States 2025 & 2033
- Figure 21: South America USA Lime Industry Revenue Share (%), by United States 2025 & 2033
- Figure 22: South America USA Lime Industry Volume Share (%), by United States 2025 & 2033
- Figure 23: South America USA Lime Industry Revenue (Million), by Country 2025 & 2033
- Figure 24: South America USA Lime Industry Volume (Kiloton), by Country 2025 & 2033
- Figure 25: South America USA Lime Industry Revenue Share (%), by Country 2025 & 2033
- Figure 26: South America USA Lime Industry Volume Share (%), by Country 2025 & 2033
- Figure 27: Europe USA Lime Industry Revenue (Million), by United States 2025 & 2033
- Figure 28: Europe USA Lime Industry Volume (Kiloton), by United States 2025 & 2033
- Figure 29: Europe USA Lime Industry Revenue Share (%), by United States 2025 & 2033
- Figure 30: Europe USA Lime Industry Volume Share (%), by United States 2025 & 2033
- Figure 31: Europe USA Lime Industry Revenue (Million), by United States 2025 & 2033
- Figure 32: Europe USA Lime Industry Volume (Kiloton), by United States 2025 & 2033
- Figure 33: Europe USA Lime Industry Revenue Share (%), by United States 2025 & 2033
- Figure 34: Europe USA Lime Industry Volume Share (%), by United States 2025 & 2033
- Figure 35: Europe USA Lime Industry Revenue (Million), by Country 2025 & 2033
- Figure 36: Europe USA Lime Industry Volume (Kiloton), by Country 2025 & 2033
- Figure 37: Europe USA Lime Industry Revenue Share (%), by Country 2025 & 2033
- Figure 38: Europe USA Lime Industry Volume Share (%), by Country 2025 & 2033
- Figure 39: Middle East & Africa USA Lime Industry Revenue (Million), by United States 2025 & 2033
- Figure 40: Middle East & Africa USA Lime Industry Volume (Kiloton), by United States 2025 & 2033
- Figure 41: Middle East & Africa USA Lime Industry Revenue Share (%), by United States 2025 & 2033
- Figure 42: Middle East & Africa USA Lime Industry Volume Share (%), by United States 2025 & 2033
- Figure 43: Middle East & Africa USA Lime Industry Revenue (Million), by United States 2025 & 2033
- Figure 44: Middle East & Africa USA Lime Industry Volume (Kiloton), by United States 2025 & 2033
- Figure 45: Middle East & Africa USA Lime Industry Revenue Share (%), by United States 2025 & 2033
- Figure 46: Middle East & Africa USA Lime Industry Volume Share (%), by United States 2025 & 2033
- Figure 47: Middle East & Africa USA Lime Industry Revenue (Million), by Country 2025 & 2033
- Figure 48: Middle East & Africa USA Lime Industry Volume (Kiloton), by Country 2025 & 2033
- Figure 49: Middle East & Africa USA Lime Industry Revenue Share (%), by Country 2025 & 2033
- Figure 50: Middle East & Africa USA Lime Industry Volume Share (%), by Country 2025 & 2033
- Figure 51: Asia Pacific USA Lime Industry Revenue (Million), by United States 2025 & 2033
- Figure 52: Asia Pacific USA Lime Industry Volume (Kiloton), by United States 2025 & 2033
- Figure 53: Asia Pacific USA Lime Industry Revenue Share (%), by United States 2025 & 2033
- Figure 54: Asia Pacific USA Lime Industry Volume Share (%), by United States 2025 & 2033
- Figure 55: Asia Pacific USA Lime Industry Revenue (Million), by United States 2025 & 2033
- Figure 56: Asia Pacific USA Lime Industry Volume (Kiloton), by United States 2025 & 2033
- Figure 57: Asia Pacific USA Lime Industry Revenue Share (%), by United States 2025 & 2033
- Figure 58: Asia Pacific USA Lime Industry Volume Share (%), by United States 2025 & 2033
- Figure 59: Asia Pacific USA Lime Industry Revenue (Million), by Country 2025 & 2033
- Figure 60: Asia Pacific USA Lime Industry Volume (Kiloton), by Country 2025 & 2033
- Figure 61: Asia Pacific USA Lime Industry Revenue Share (%), by Country 2025 & 2033
- Figure 62: Asia Pacific USA Lime Industry Volume Share (%), by Country 2025 & 2033
List of Tables
- Table 1: Global USA Lime Industry Revenue Million Forecast, by United States 2020 & 2033
- Table 2: Global USA Lime Industry Volume Kiloton Forecast, by United States 2020 & 2033
- Table 3: Global USA Lime Industry Revenue Million Forecast, by United States 2020 & 2033
- Table 4: Global USA Lime Industry Volume Kiloton Forecast, by United States 2020 & 2033
- Table 5: Global USA Lime Industry Revenue Million Forecast, by Region 2020 & 2033
- Table 6: Global USA Lime Industry Volume Kiloton Forecast, by Region 2020 & 2033
- Table 7: Global USA Lime Industry Revenue Million Forecast, by United States 2020 & 2033
- Table 8: Global USA Lime Industry Volume Kiloton Forecast, by United States 2020 & 2033
- Table 9: Global USA Lime Industry Revenue Million Forecast, by United States 2020 & 2033
- Table 10: Global USA Lime Industry Volume Kiloton Forecast, by United States 2020 & 2033
- Table 11: Global USA Lime Industry Revenue Million Forecast, by Country 2020 & 2033
- Table 12: Global USA Lime Industry Volume Kiloton Forecast, by Country 2020 & 2033
- Table 13: United States USA Lime Industry Revenue (Million) Forecast, by Application 2020 & 2033
- Table 14: United States USA Lime Industry Volume (Kiloton) Forecast, by Application 2020 & 2033
- Table 15: Canada USA Lime Industry Revenue (Million) Forecast, by Application 2020 & 2033
- Table 16: Canada USA Lime Industry Volume (Kiloton) Forecast, by Application 2020 & 2033
- Table 17: Mexico USA Lime Industry Revenue (Million) Forecast, by Application 2020 & 2033
- Table 18: Mexico USA Lime Industry Volume (Kiloton) Forecast, by Application 2020 & 2033
- Table 19: Global USA Lime Industry Revenue Million Forecast, by United States 2020 & 2033
- Table 20: Global USA Lime Industry Volume Kiloton Forecast, by United States 2020 & 2033
- Table 21: Global USA Lime Industry Revenue Million Forecast, by United States 2020 & 2033
- Table 22: Global USA Lime Industry Volume Kiloton Forecast, by United States 2020 & 2033
- Table 23: Global USA Lime Industry Revenue Million Forecast, by Country 2020 & 2033
- Table 24: Global USA Lime Industry Volume Kiloton Forecast, by Country 2020 & 2033
- Table 25: Brazil USA Lime Industry Revenue (Million) Forecast, by Application 2020 & 2033
- Table 26: Brazil USA Lime Industry Volume (Kiloton) Forecast, by Application 2020 & 2033
- Table 27: Argentina USA Lime Industry Revenue (Million) Forecast, by Application 2020 & 2033
- Table 28: Argentina USA Lime Industry Volume (Kiloton) Forecast, by Application 2020 & 2033
- Table 29: Rest of South America USA Lime Industry Revenue (Million) Forecast, by Application 2020 & 2033
- Table 30: Rest of South America USA Lime Industry Volume (Kiloton) Forecast, by Application 2020 & 2033
- Table 31: Global USA Lime Industry Revenue Million Forecast, by United States 2020 & 2033
- Table 32: Global USA Lime Industry Volume Kiloton Forecast, by United States 2020 & 2033
- Table 33: Global USA Lime Industry Revenue Million Forecast, by United States 2020 & 2033
- Table 34: Global USA Lime Industry Volume Kiloton Forecast, by United States 2020 & 2033
- Table 35: Global USA Lime Industry Revenue Million Forecast, by Country 2020 & 2033
- Table 36: Global USA Lime Industry Volume Kiloton Forecast, by Country 2020 & 2033
- Table 37: United Kingdom USA Lime Industry Revenue (Million) Forecast, by Application 2020 & 2033
- Table 38: United Kingdom USA Lime Industry Volume (Kiloton) Forecast, by Application 2020 & 2033
- Table 39: Germany USA Lime Industry Revenue (Million) Forecast, by Application 2020 & 2033
- Table 40: Germany USA Lime Industry Volume (Kiloton) Forecast, by Application 2020 & 2033
- Table 41: France USA Lime Industry Revenue (Million) Forecast, by Application 2020 & 2033
- Table 42: France USA Lime Industry Volume (Kiloton) Forecast, by Application 2020 & 2033
- Table 43: Italy USA Lime Industry Revenue (Million) Forecast, by Application 2020 & 2033
- Table 44: Italy USA Lime Industry Volume (Kiloton) Forecast, by Application 2020 & 2033
- Table 45: Spain USA Lime Industry Revenue (Million) Forecast, by Application 2020 & 2033
- Table 46: Spain USA Lime Industry Volume (Kiloton) Forecast, by Application 2020 & 2033
- Table 47: Russia USA Lime Industry Revenue (Million) Forecast, by Application 2020 & 2033
- Table 48: Russia USA Lime Industry Volume (Kiloton) Forecast, by Application 2020 & 2033
- Table 49: Benelux USA Lime Industry Revenue (Million) Forecast, by Application 2020 & 2033
- Table 50: Benelux USA Lime Industry Volume (Kiloton) Forecast, by Application 2020 & 2033
- Table 51: Nordics USA Lime Industry Revenue (Million) Forecast, by Application 2020 & 2033
- Table 52: Nordics USA Lime Industry Volume (Kiloton) Forecast, by Application 2020 & 2033
- Table 53: Rest of Europe USA Lime Industry Revenue (Million) Forecast, by Application 2020 & 2033
- Table 54: Rest of Europe USA Lime Industry Volume (Kiloton) Forecast, by Application 2020 & 2033
- Table 55: Global USA Lime Industry Revenue Million Forecast, by United States 2020 & 2033
- Table 56: Global USA Lime Industry Volume Kiloton Forecast, by United States 2020 & 2033
- Table 57: Global USA Lime Industry Revenue Million Forecast, by United States 2020 & 2033
- Table 58: Global USA Lime Industry Volume Kiloton Forecast, by United States 2020 & 2033
- Table 59: Global USA Lime Industry Revenue Million Forecast, by Country 2020 & 2033
- Table 60: Global USA Lime Industry Volume Kiloton Forecast, by Country 2020 & 2033
- Table 61: Turkey USA Lime Industry Revenue (Million) Forecast, by Application 2020 & 2033
- Table 62: Turkey USA Lime Industry Volume (Kiloton) Forecast, by Application 2020 & 2033
- Table 63: Israel USA Lime Industry Revenue (Million) Forecast, by Application 2020 & 2033
- Table 64: Israel USA Lime Industry Volume (Kiloton) Forecast, by Application 2020 & 2033
- Table 65: GCC USA Lime Industry Revenue (Million) Forecast, by Application 2020 & 2033
- Table 66: GCC USA Lime Industry Volume (Kiloton) Forecast, by Application 2020 & 2033
- Table 67: North Africa USA Lime Industry Revenue (Million) Forecast, by Application 2020 & 2033
- Table 68: North Africa USA Lime Industry Volume (Kiloton) Forecast, by Application 2020 & 2033
- Table 69: South Africa USA Lime Industry Revenue (Million) Forecast, by Application 2020 & 2033
- Table 70: South Africa USA Lime Industry Volume (Kiloton) Forecast, by Application 2020 & 2033
- Table 71: Rest of Middle East & Africa USA Lime Industry Revenue (Million) Forecast, by Application 2020 & 2033
- Table 72: Rest of Middle East & Africa USA Lime Industry Volume (Kiloton) Forecast, by Application 2020 & 2033
- Table 73: Global USA Lime Industry Revenue Million Forecast, by United States 2020 & 2033
- Table 74: Global USA Lime Industry Volume Kiloton Forecast, by United States 2020 & 2033
- Table 75: Global USA Lime Industry Revenue Million Forecast, by United States 2020 & 2033
- Table 76: Global USA Lime Industry Volume Kiloton Forecast, by United States 2020 & 2033
- Table 77: Global USA Lime Industry Revenue Million Forecast, by Country 2020 & 2033
- Table 78: Global USA Lime Industry Volume Kiloton Forecast, by Country 2020 & 2033
- Table 79: China USA Lime Industry Revenue (Million) Forecast, by Application 2020 & 2033
- Table 80: China USA Lime Industry Volume (Kiloton) Forecast, by Application 2020 & 2033
- Table 81: India USA Lime Industry Revenue (Million) Forecast, by Application 2020 & 2033
- Table 82: India USA Lime Industry Volume (Kiloton) Forecast, by Application 2020 & 2033
- Table 83: Japan USA Lime Industry Revenue (Million) Forecast, by Application 2020 & 2033
- Table 84: Japan USA Lime Industry Volume (Kiloton) Forecast, by Application 2020 & 2033
- Table 85: South Korea USA Lime Industry Revenue (Million) Forecast, by Application 2020 & 2033
- Table 86: South Korea USA Lime Industry Volume (Kiloton) Forecast, by Application 2020 & 2033
- Table 87: ASEAN USA Lime Industry Revenue (Million) Forecast, by Application 2020 & 2033
- Table 88: ASEAN USA Lime Industry Volume (Kiloton) Forecast, by Application 2020 & 2033
- Table 89: Oceania USA Lime Industry Revenue (Million) Forecast, by Application 2020 & 2033
- Table 90: Oceania USA Lime Industry Volume (Kiloton) Forecast, by Application 2020 & 2033
- Table 91: Rest of Asia Pacific USA Lime Industry Revenue (Million) Forecast, by Application 2020 & 2033
- Table 92: Rest of Asia Pacific USA Lime Industry Volume (Kiloton) Forecast, by Application 2020 & 2033
Frequently Asked Questions
1. What is the projected Compound Annual Growth Rate (CAGR) of the USA Lime Industry?
The projected CAGR is approximately 3.80%.
2. Which companies are prominent players in the USA Lime Industry?
Key companies in the market include Limoneira Company , Grimmway Farms , Bee Sweet Citrus, Hardie's Fresh Foods (Pty) Ltd. , Florida Citrus Mutual , Sunkist Growers , Sunkist Growers , Wonderful Citrus, California Citrus Mutual .
3. What are the main segments of the USA Lime Industry?
The market segments include United States, United States.
4. Can you provide details about the market size?
The market size is estimated to be USD 2.42 Million as of 2022.
5. What are some drivers contributing to market growth?
Favorable Climatic Conditions; Blooming Export Opportunities.
6. What are the notable trends driving market growth?
Health Benefits to Increase the Lime Consumption.
7. Are there any restraints impacting market growth?
High Adoption Cost of Modern Technology; Increasing Insect Infestations.
8. Can you provide examples of recent developments in the market?
August 2022: Chicago-based Hazel Technologies Inc. slowed the yellowing process of limes for lime growers and wholesalers across the United States. Collaborators such as Pharr, Texas-based produce shipper London Fruit Inc. and Pittsburg, Kan.-based produce wholesaler Martinous Produce Co. are seeing extended freshness in their limes with Hazel Tech's flagship technology, Hazel 100, according to the release.
9. What pricing options are available for accessing the report?
Pricing options include single-user, multi-user, and enterprise licenses priced at USD 3800, USD 4500, and USD 5800 respectively.
10. Is the market size provided in terms of value or volume?
The market size is provided in terms of value, measured in Million and volume, measured in Kiloton.
11. Are there any specific market keywords associated with the report?
Yes, the market keyword associated with the report is "USA Lime Industry," which aids in identifying and referencing the specific market segment covered.
12. How do I determine which pricing option suits my needs best?
The pricing options vary based on user requirements and access needs. Individual users may opt for single-user licenses, while businesses requiring broader access may choose multi-user or enterprise licenses for cost-effective access to the report.
13. Are there any additional resources or data provided in the USA Lime Industry report?
While the report offers comprehensive insights, it's advisable to review the specific contents or supplementary materials provided to ascertain if additional resources or data are available.
14. How can I stay updated on further developments or reports in the USA Lime Industry?
To stay informed about further developments, trends, and reports in the USA Lime Industry, consider subscribing to industry newsletters, following relevant companies and organizations, or regularly checking reputable industry news sources and publications.
Methodology
Step 1 - Identification of Relevant Samples Size from Population Database


Step 2 - Approaches for Defining Global Market Size (Value, Volume* & Price*)

Note*: In applicable scenarios
Step 3 - Data Sources
Primary Research
- Web Analytics
- Survey Reports
- Research Institute
- Latest Research Reports
- Opinion Leaders
Secondary Research
- Annual Reports
- White Paper
- Latest Press Release
- Industry Association
- Paid Database
- Investor Presentations

Step 4 - Data Triangulation
Involves using different sources of information in order to increase the validity of a study
These sources are likely to be stakeholders in a program - participants, other researchers, program staff, other community members, and so on.
Then we put all data in single framework & apply various statistical tools to find out the dynamic on the market.
During the analysis stage, feedback from the stakeholder groups would be compared to determine areas of agreement as well as areas of divergence

