Key Insights
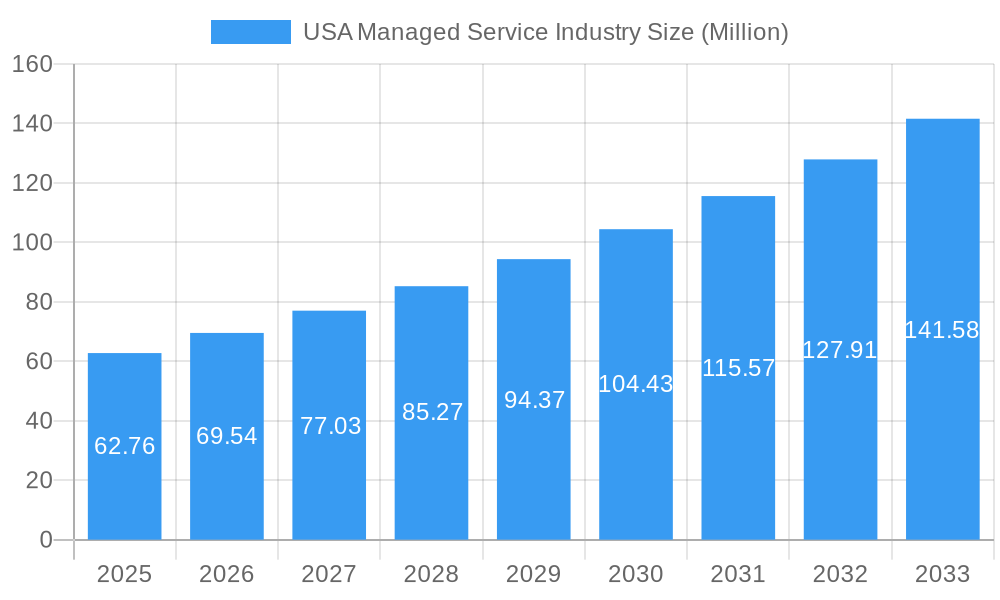
The United States managed services market is poised for significant expansion, projected to reach approximately $62.76 million by 2025, fueled by a robust compound annual growth rate (CAGR) of 10.82% during the forecast period of 2025-2033. This impressive trajectory is primarily driven by the increasing complexity of IT infrastructure, the growing demand for specialized IT expertise, and the persistent need for enhanced cybersecurity measures across all enterprise sizes and verticals. Small and medium-sized enterprises (SMEs), in particular, are increasingly leveraging managed services to gain access to enterprise-grade IT capabilities without the substantial capital investment required for in-house solutions. Similarly, large enterprises are adopting these services to streamline operations, optimize costs, and focus on core business strategies while offloading critical IT functions. The shift towards cloud-based solutions is a dominant trend, with businesses actively migrating their infrastructure and applications to the cloud to benefit from scalability, flexibility, and cost-efficiency. This trend is further amplified by the rise of hybrid and multi-cloud environments, demanding sophisticated managed services to ensure seamless integration and management.
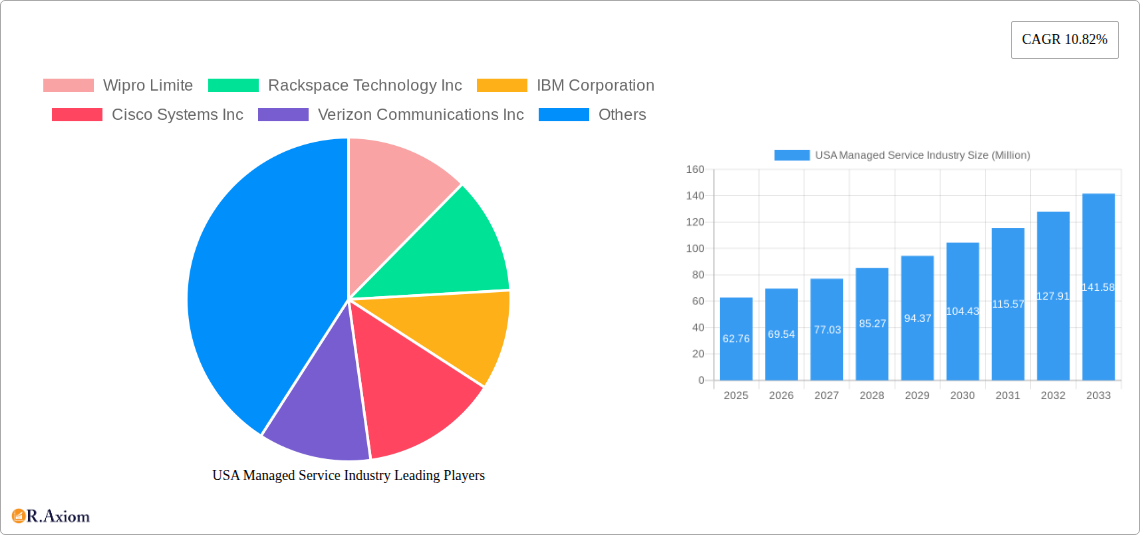
USA Managed Service Industry Market Size (In Million)
The market's growth is further bolstered by key trends such as the proliferation of managed security services, addressing the escalating threat landscape and stringent data privacy regulations. Managed network services are also seeing increased adoption as businesses strive for robust, high-performance connectivity. The evolving digital landscape also necessitates specialized managed communications and managed infrastructure services, enabling organizations to adapt to remote work models and the increasing reliance on digital platforms. While the market benefits from strong demand, potential restraints include concerns around data security and vendor lock-in, which managed service providers are actively addressing through enhanced security protocols and flexible service level agreements. The competitive landscape is populated by established players like IBM, Microsoft, and Wipro, alongside specialized providers, all vying to capture market share by offering comprehensive and tailored managed service solutions across diverse end-user verticals such as BFSI, IT and Telecom, and Healthcare.
USA Managed Service Industry Company Market Share
USA Managed Service Industry Market Concentration & Innovation
The USA Managed Service Industry exhibits a dynamic market concentration influenced by significant innovation and a complex regulatory landscape. Key players like IBM Corporation, Microsoft Corporation, and Dell Technologies Inc. hold substantial market shares, driving innovation through continuous investment in advanced technologies such as AI-powered automation, cybersecurity solutions, and cloud integration. The market concentration is further shaped by strategic mergers and acquisitions, with M&A deal values reaching xx Million annually, as companies seek to expand their service portfolios and geographical reach. For instance, the acquisition of specialized cloud management firms by larger entities aims to consolidate market power.
Innovation drivers are primarily focused on enhancing operational efficiency, bolstering security protocols, and enabling digital transformation for enterprises. The increasing adoption of cloud-native services and the demand for proactive threat detection are pushing service providers to develop cutting-edge solutions. Regulatory frameworks, particularly those concerning data privacy (e.g., GDPR, CCPA) and industry-specific compliance (e.g., HIPAA for healthcare), are crucial in shaping service offerings and ensuring adherence. Product substitutes, while evolving, often include in-house IT departments or specialized point solutions, but the comprehensive and integrated nature of managed services generally offers a stronger value proposition. End-user trends are strongly leaning towards scalable, flexible, and secure IT operations, prompting providers to offer hybrid and multi-cloud management.
- Market Share Concentration: Dominated by top-tier providers, with a gradual increase in specialized niche players.
- M&A Deal Value: Estimated at xx Million annually, indicating consolidation and strategic expansion.
- Innovation Drivers: AI/ML, advanced cybersecurity, cloud-native solutions, automation.
- Regulatory Impact: Data privacy and industry-specific compliance are paramount.
- End-User Demand: Scalability, flexibility, and robust security are key preferences.
USA Managed Service Industry Industry Trends & Insights
The USA Managed Service Industry is poised for substantial growth, propelled by a confluence of technological advancements, evolving business needs, and a shifting economic landscape. The market is projected to witness a Compound Annual Growth Rate (CAGR) of xx% during the forecast period of 2025–2033. This robust expansion is driven by the increasing reliance of businesses across all sectors on external expertise to manage their complex IT infrastructures, cybersecurity threats, and digital transformation initiatives. Market penetration is deepening, particularly among Small and Medium Enterprises (SMEs) that may lack the resources or in-house expertise to handle their IT requirements effectively. Large Enterprises, on the other hand, are leveraging managed services to optimize costs, improve efficiency, and focus on core business competencies.
Technological disruptions, such as the widespread adoption of cloud computing (public, private, and hybrid), the rise of Artificial Intelligence (AI) and Machine Learning (ML) for automation and analytics, and the ever-present threat landscape necessitating advanced managed security services, are fundamentally reshaping the industry. Companies are increasingly seeking managed solutions that offer proactive monitoring, predictive maintenance, and intelligent threat response. Consumer preferences are moving towards service providers that can offer end-to-end solutions, seamless integration across different platforms, and highly personalized support. The competitive dynamics are intense, with established giants like Wipro Limited, Rackspace Technology Inc., and IBM Corporation vying for market share against agile, specialized firms. This competition fosters innovation and drives service providers to continuously enhance their offerings and adopt new technologies to stay ahead.
- Projected CAGR: xx% (2025–2033)
- Market Penetration: Increasing across SME and Large Enterprise segments.
- Key Technological Disruptions: Cloud computing, AI/ML, advanced cybersecurity.
- Consumer Preferences: End-to-end solutions, seamless integration, personalized support.
- Competitive Landscape: Intense, characterized by innovation and strategic partnerships.
Dominant Markets & Segments in USA Managed Service Industry
The USA Managed Service Industry is characterized by several dominant segments and verticals, reflecting the diverse needs of the American economy. In terms of deployment, Cloud services are experiencing unparalleled growth, significantly outpacing on-premise solutions. This is driven by the inherent scalability, flexibility, and cost-efficiency that cloud environments offer, allowing businesses to adapt rapidly to changing market demands. Managed cloud infrastructure, including public, private, and hybrid cloud deployments, forms the backbone of many enterprise IT strategies.
Among the service types, Managed Security and Managed Network services are paramount. The escalating sophistication of cyber threats necessitates robust, outsourced security solutions, making managed security a critical offering for businesses of all sizes. Similarly, the complexity of modern networking infrastructure and the demand for reliable, high-speed connectivity make managed network services indispensable. The IT and Telecom sector, followed closely by BFSI (Banking, Financial Services, and Insurance) and Healthcare, represent the most significant end-user verticals. These industries deal with vast amounts of sensitive data, stringent regulatory requirements, and a continuous need for technological innovation, making them prime adopters of comprehensive managed services.
- Dominant Deployment: Cloud (public, private, hybrid) – offering scalability and cost-effectiveness.
- Key Drivers: Agility, reduced capital expenditure, access to advanced technologies.
- Dominant Service Types:
- Managed Security: Essential due to increasing cyber threats and data breach risks.
- Key Drivers: Compliance requirements, proactive threat detection, incident response.
- Managed Network: Crucial for ensuring connectivity, performance, and reliability.
- Key Drivers: Network complexity, demand for high bandwidth, remote work support.
- Managed Security: Essential due to increasing cyber threats and data breach risks.
- Dominant End-User Verticals:
- IT and Telecom: Early adopters and consistent demand for advanced IT solutions.
- Key Drivers: Rapid technological evolution, need for robust infrastructure.
- BFSI: Driven by stringent regulations, data security needs, and digital transformation.
- Key Drivers: Compliance, fraud prevention, customer experience enhancement.
- Healthcare: Emphasizing patient data security, regulatory adherence, and operational efficiency.
- Key Drivers: HIPAA compliance, data privacy, telemedicine integration.
- IT and Telecom: Early adopters and consistent demand for advanced IT solutions.
- Enterprise Size Dominance: Large Enterprises currently lead in adoption due to their extensive IT needs and budget allocations. However, Small and Medium Enterprises represent a rapidly growing segment, increasingly leveraging managed services for cost savings and access to expertise.
USA Managed Service Industry Product Developments
The USA Managed Service Industry is continually evolving with product developments focused on enhancing efficiency, security, and scalability. Providers are innovating with AI-driven automation for proactive issue detection and resolution, leading to reduced downtime and optimized performance. Advanced cloud management platforms are emerging, offering seamless integration and unified visibility across multi-cloud and hybrid environments. Managed security solutions are incorporating predictive analytics and behavioral threat detection to combat sophisticated cyberattacks. Furthermore, specialized services are being developed to support emerging technologies like IoT and edge computing, providing comprehensive management for distributed infrastructures. These innovations are crucial for maintaining competitive advantages and meeting the dynamic needs of businesses undergoing digital transformation.
Report Scope & Segmentation Analysis
This report provides a comprehensive analysis of the USA Managed Service Industry, segmented across various critical dimensions. The Deployment dimension includes On-premise and Cloud services, with Cloud deployment showing a significant market share and growth trajectory. In terms of Type, the market is analyzed through Managed Data Center, Managed Security, Managed Communications, Managed Network, Managed Infrastructure, and Managed Mobility. Managed Security and Managed Network services are anticipated to dominate, driven by critical business needs. The Enterprise Size segmentation covers Small and Medium Enterprises (SMEs) and Large Enterprises, with both segments showing strong adoption patterns, though Large Enterprises currently represent a larger market share. Finally, the End-user Vertical segmentation includes BFSI, IT and Telecom, Healthcare, Entertainment and Media, Retail, Manufacturing, Government, and Other End-user Verticals. IT and Telecom, BFSI, and Healthcare are expected to exhibit the highest growth and market penetration due to their inherent reliance on robust, secure, and scalable IT solutions.
Key Drivers of USA Managed Service Industry Growth
The growth of the USA Managed Service Industry is propelled by several interconnected factors. The escalating complexity and cost of managing in-house IT infrastructure compel businesses to seek external expertise. The increasing sophistication and frequency of cyber threats mandate robust, outsourced security solutions, driving demand for managed security services. Digital transformation initiatives across all sectors require specialized skills and advanced technologies, which managed service providers can readily offer. The growing adoption of cloud computing and the subsequent need for effective cloud management also contribute significantly. Furthermore, the desire to optimize operational efficiency, reduce capital expenditure, and allow internal IT teams to focus on strategic innovation are key economic drivers. Regulatory compliance requirements across various industries also necessitate specialized managed services.
Challenges in the USA Managed Service Industry Sector
Despite its robust growth, the USA Managed Service Industry faces several challenges. Intense competition among providers can lead to price wars and pressure on profit margins. Ensuring consistent service quality and customer satisfaction across a diverse client base can be demanding. Evolving regulatory landscapes, particularly concerning data privacy and cybersecurity, require continuous adaptation and investment in compliance measures, which can be a significant operational hurdle. Dependence on third-party vendors for certain technologies or infrastructure components can introduce supply chain risks. Furthermore, the talent shortage for highly skilled IT professionals, especially in specialized areas like cybersecurity and cloud architecture, poses a challenge for service providers aiming to scale their operations and offerings.
Emerging Opportunities in USA Managed Service Industry
The USA Managed Service Industry is ripe with emerging opportunities, driven by technological advancements and evolving business demands. The continued expansion of cloud computing, particularly multi-cloud and hybrid cloud environments, creates significant opportunities for specialized management and optimization services. The growing adoption of AI and ML in business operations fuels demand for managed services that can leverage these technologies for automation, predictive analytics, and enhanced decision-making. The increasing focus on cybersecurity across all industries presents a vast opportunity for advanced managed security solutions, including threat intelligence, incident response, and compliance management. Furthermore, the demand for managed services supporting the Internet of Things (IoT) and edge computing environments is on the rise, offering new avenues for growth and specialization.
Leading Players in the USA Managed Service Industry Market
- Wipro Limited
- Rackspace Technology Inc.
- IBM Corporation
- Cisco Systems Inc.
- Verizon Communications Inc.
- Microsoft Corporation
- HP Inc.
- Fujitsu Limited
- Tata Consultancy Services Limited
- Dell Technologies Inc.
- AT&T Inc.
- Citrix Systems Inc.
Key Developments in USA Managed Service Industry Industry
- October 2023: Rackspace Technology introduced Rackspace Managed Cloud (RMC), an all-inclusive service enabling customers to delegate their cloud environments' management and operations. This comprehensive solution is tailored for organizations utilizing platforms such as AWS, Azure, Google Cloud, Rackspace Private Cloud, and on-premises infrastructure.
- August 2023: Verizon Business forged a strategic global alliance, designating HCLTech as its key collaborator for Managed Network Services (MNS) in networking deployments for global enterprise clients. This collaboration united two prominent players in the enterprise networking arena. By leveraging Verizon's robust networking prowess and HCLTech's renowned Managed Service expertise, this partnership is set to redefine the landscape of wireline service delivery for large-scale enterprise customers.
Strategic Outlook for USA Managed Service Industry Market
The strategic outlook for the USA Managed Service Industry remains exceptionally positive, with continued robust growth anticipated. The increasing reliance on specialized IT expertise, the ongoing digital transformation efforts across industries, and the perpetual need for enhanced cybersecurity measures will serve as primary growth catalysts. Providers that can effectively integrate emerging technologies like AI and machine learning into their service offerings, deliver seamless multi-cloud management solutions, and offer comprehensive, proactive security postures will be well-positioned for success. The growing demand from Small and Medium Enterprises for cost-effective and scalable IT solutions presents a significant market expansion opportunity. Strategic partnerships, mergers, and acquisitions will continue to shape the competitive landscape, enabling companies to broaden their service portfolios and geographical reach, thereby ensuring sustained market relevance and profitability.
USA Managed Service Industry Segmentation
-
1. Deployment
- 1.1. On-premise
- 1.2. Cloud
-
2. Type
- 2.1. Managed Data Center
- 2.2. Managed Security
- 2.3. Managed Communications
- 2.4. Managed Network
- 2.5. Managed Infrastructure
- 2.6. Managed Mobility
-
3. Enterprise Size
- 3.1. Small and Medium Enterprises
- 3.2. Large Enterprises
-
4. End-user Vertical
- 4.1. BFSI
- 4.2. IT and Telecom
- 4.3. Healthcare
- 4.4. Entertainment and Media
- 4.5. Retail
- 4.6. Manufacturing
- 4.7. Government
- 4.8. Other End-user Verticals
USA Managed Service Industry Segmentation By Geography
-
1. North America
- 1.1. United States
- 1.2. Canada
- 1.3. Mexico
-
2. South America
- 2.1. Brazil
- 2.2. Argentina
- 2.3. Rest of South America
-
3. Europe
- 3.1. United Kingdom
- 3.2. Germany
- 3.3. France
- 3.4. Italy
- 3.5. Spain
- 3.6. Russia
- 3.7. Benelux
- 3.8. Nordics
- 3.9. Rest of Europe
-
4. Middle East & Africa
- 4.1. Turkey
- 4.2. Israel
- 4.3. GCC
- 4.4. North Africa
- 4.5. South Africa
- 4.6. Rest of Middle East & Africa
-
5. Asia Pacific
- 5.1. China
- 5.2. India
- 5.3. Japan
- 5.4. South Korea
- 5.5. ASEAN
- 5.6. Oceania
- 5.7. Rest of Asia Pacific
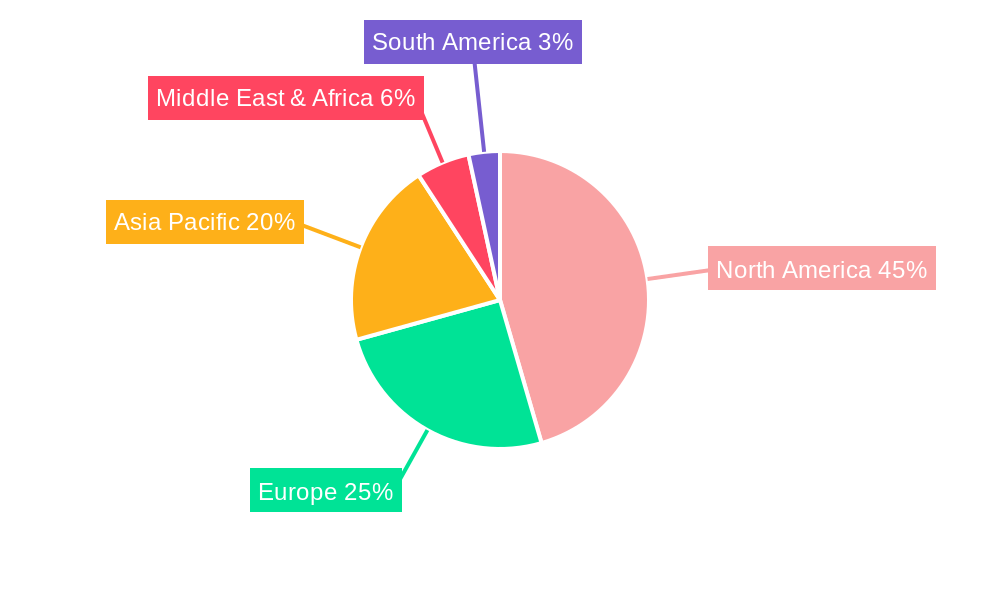
USA Managed Service Industry Regional Market Share
Geographic Coverage of USA Managed Service Industry
USA Managed Service Industry REPORT HIGHLIGHTS
| Aspects | Details |
|---|---|
| Study Period | 2020-2034 |
| Base Year | 2025 |
| Estimated Year | 2026 |
| Forecast Period | 2026-2034 |
| Historical Period | 2020-2025 |
| Growth Rate | CAGR of 10.82% from 2020-2034 |
| Segmentation |
|
Table of Contents
- 1. Introduction
- 1.1. Research Scope
- 1.2. Market Segmentation
- 1.3. Research Objective
- 1.4. Definitions and Assumptions
- 2. Executive Summary
- 2.1. Market Snapshot
- 3. Market Dynamics
- 3.1. Market Drivers
- 3.2. Market Restrains
- 3.3. Market Trends
- 3.4. Market Opportunities
- 4. Market Factor Analysis
- 4.1. Porters Five Forces
- 4.1.1. Bargaining Power of Suppliers
- 4.1.2. Bargaining Power of Buyers
- 4.1.3. Threat of New Entrants
- 4.1.4. Threat of Substitutes
- 4.1.5. Competitive Rivalry
- 4.2. PESTEL analysis
- 4.3. BCG Analysis
- 4.3.1. Stars (High Growth, High Market Share)
- 4.3.2. Cash Cows (Low Growth, High Market Share)
- 4.3.3. Question Mark (High Growth, Low Market Share)
- 4.3.4. Dogs (Low Growth, Low Market Share)
- 4.4. Ansoff Matrix Analysis
- 4.5. Supply Chain Analysis
- 4.6. Regulatory Landscape
- 4.7. Current Market Potential and Opportunity Assessment (TAM–SAM–SOM Framework)
- 4.8. RAX Analyst Note
- 4.1. Porters Five Forces
- 5. Market Analysis, Insights and Forecast 2021-2033
- 5.1. Market Analysis, Insights and Forecast - by Deployment
- 5.1.1. On-premise
- 5.1.2. Cloud
- 5.2. Market Analysis, Insights and Forecast - by Type
- 5.2.1. Managed Data Center
- 5.2.2. Managed Security
- 5.2.3. Managed Communications
- 5.2.4. Managed Network
- 5.2.5. Managed Infrastructure
- 5.2.6. Managed Mobility
- 5.3. Market Analysis, Insights and Forecast - by Enterprise Size
- 5.3.1. Small and Medium Enterprises
- 5.3.2. Large Enterprises
- 5.4. Market Analysis, Insights and Forecast - by End-user Vertical
- 5.4.1. BFSI
- 5.4.2. IT and Telecom
- 5.4.3. Healthcare
- 5.4.4. Entertainment and Media
- 5.4.5. Retail
- 5.4.6. Manufacturing
- 5.4.7. Government
- 5.4.8. Other End-user Verticals
- 5.5. Market Analysis, Insights and Forecast - by Region
- 5.5.1. North America
- 5.5.2. South America
- 5.5.3. Europe
- 5.5.4. Middle East & Africa
- 5.5.5. Asia Pacific
- 5.1. Market Analysis, Insights and Forecast - by Deployment
- 6. Global USA Managed Service Industry Analysis, Insights and Forecast, 2021-2033
- 6.1. Market Analysis, Insights and Forecast - by Deployment
- 6.1.1. On-premise
- 6.1.2. Cloud
- 6.2. Market Analysis, Insights and Forecast - by Type
- 6.2.1. Managed Data Center
- 6.2.2. Managed Security
- 6.2.3. Managed Communications
- 6.2.4. Managed Network
- 6.2.5. Managed Infrastructure
- 6.2.6. Managed Mobility
- 6.3. Market Analysis, Insights and Forecast - by Enterprise Size
- 6.3.1. Small and Medium Enterprises
- 6.3.2. Large Enterprises
- 6.4. Market Analysis, Insights and Forecast - by End-user Vertical
- 6.4.1. BFSI
- 6.4.2. IT and Telecom
- 6.4.3. Healthcare
- 6.4.4. Entertainment and Media
- 6.4.5. Retail
- 6.4.6. Manufacturing
- 6.4.7. Government
- 6.4.8. Other End-user Verticals
- 6.1. Market Analysis, Insights and Forecast - by Deployment
- 7. North America USA Managed Service Industry Analysis, Insights and Forecast, 2020-2032
- 7.1. Market Analysis, Insights and Forecast - by Deployment
- 7.1.1. On-premise
- 7.1.2. Cloud
- 7.2. Market Analysis, Insights and Forecast - by Type
- 7.2.1. Managed Data Center
- 7.2.2. Managed Security
- 7.2.3. Managed Communications
- 7.2.4. Managed Network
- 7.2.5. Managed Infrastructure
- 7.2.6. Managed Mobility
- 7.3. Market Analysis, Insights and Forecast - by Enterprise Size
- 7.3.1. Small and Medium Enterprises
- 7.3.2. Large Enterprises
- 7.4. Market Analysis, Insights and Forecast - by End-user Vertical
- 7.4.1. BFSI
- 7.4.2. IT and Telecom
- 7.4.3. Healthcare
- 7.4.4. Entertainment and Media
- 7.4.5. Retail
- 7.4.6. Manufacturing
- 7.4.7. Government
- 7.4.8. Other End-user Verticals
- 7.1. Market Analysis, Insights and Forecast - by Deployment
- 8. South America USA Managed Service Industry Analysis, Insights and Forecast, 2020-2032
- 8.1. Market Analysis, Insights and Forecast - by Deployment
- 8.1.1. On-premise
- 8.1.2. Cloud
- 8.2. Market Analysis, Insights and Forecast - by Type
- 8.2.1. Managed Data Center
- 8.2.2. Managed Security
- 8.2.3. Managed Communications
- 8.2.4. Managed Network
- 8.2.5. Managed Infrastructure
- 8.2.6. Managed Mobility
- 8.3. Market Analysis, Insights and Forecast - by Enterprise Size
- 8.3.1. Small and Medium Enterprises
- 8.3.2. Large Enterprises
- 8.4. Market Analysis, Insights and Forecast - by End-user Vertical
- 8.4.1. BFSI
- 8.4.2. IT and Telecom
- 8.4.3. Healthcare
- 8.4.4. Entertainment and Media
- 8.4.5. Retail
- 8.4.6. Manufacturing
- 8.4.7. Government
- 8.4.8. Other End-user Verticals
- 8.1. Market Analysis, Insights and Forecast - by Deployment
- 9. Europe USA Managed Service Industry Analysis, Insights and Forecast, 2020-2032
- 9.1. Market Analysis, Insights and Forecast - by Deployment
- 9.1.1. On-premise
- 9.1.2. Cloud
- 9.2. Market Analysis, Insights and Forecast - by Type
- 9.2.1. Managed Data Center
- 9.2.2. Managed Security
- 9.2.3. Managed Communications
- 9.2.4. Managed Network
- 9.2.5. Managed Infrastructure
- 9.2.6. Managed Mobility
- 9.3. Market Analysis, Insights and Forecast - by Enterprise Size
- 9.3.1. Small and Medium Enterprises
- 9.3.2. Large Enterprises
- 9.4. Market Analysis, Insights and Forecast - by End-user Vertical
- 9.4.1. BFSI
- 9.4.2. IT and Telecom
- 9.4.3. Healthcare
- 9.4.4. Entertainment and Media
- 9.4.5. Retail
- 9.4.6. Manufacturing
- 9.4.7. Government
- 9.4.8. Other End-user Verticals
- 9.1. Market Analysis, Insights and Forecast - by Deployment
- 10. Middle East & Africa USA Managed Service Industry Analysis, Insights and Forecast, 2020-2032
- 10.1. Market Analysis, Insights and Forecast - by Deployment
- 10.1.1. On-premise
- 10.1.2. Cloud
- 10.2. Market Analysis, Insights and Forecast - by Type
- 10.2.1. Managed Data Center
- 10.2.2. Managed Security
- 10.2.3. Managed Communications
- 10.2.4. Managed Network
- 10.2.5. Managed Infrastructure
- 10.2.6. Managed Mobility
- 10.3. Market Analysis, Insights and Forecast - by Enterprise Size
- 10.3.1. Small and Medium Enterprises
- 10.3.2. Large Enterprises
- 10.4. Market Analysis, Insights and Forecast - by End-user Vertical
- 10.4.1. BFSI
- 10.4.2. IT and Telecom
- 10.4.3. Healthcare
- 10.4.4. Entertainment and Media
- 10.4.5. Retail
- 10.4.6. Manufacturing
- 10.4.7. Government
- 10.4.8. Other End-user Verticals
- 10.1. Market Analysis, Insights and Forecast - by Deployment
- 11. Asia Pacific USA Managed Service Industry Analysis, Insights and Forecast, 2020-2032
- 11.1. Market Analysis, Insights and Forecast - by Deployment
- 11.1.1. On-premise
- 11.1.2. Cloud
- 11.2. Market Analysis, Insights and Forecast - by Type
- 11.2.1. Managed Data Center
- 11.2.2. Managed Security
- 11.2.3. Managed Communications
- 11.2.4. Managed Network
- 11.2.5. Managed Infrastructure
- 11.2.6. Managed Mobility
- 11.3. Market Analysis, Insights and Forecast - by Enterprise Size
- 11.3.1. Small and Medium Enterprises
- 11.3.2. Large Enterprises
- 11.4. Market Analysis, Insights and Forecast - by End-user Vertical
- 11.4.1. BFSI
- 11.4.2. IT and Telecom
- 11.4.3. Healthcare
- 11.4.4. Entertainment and Media
- 11.4.5. Retail
- 11.4.6. Manufacturing
- 11.4.7. Government
- 11.4.8. Other End-user Verticals
- 11.1. Market Analysis, Insights and Forecast - by Deployment
- 12. Competitive Analysis
- 12.1. Company Profiles
- 12.1.1 Wipro Limite
- 12.1.1.1. Company Overview
- 12.1.1.2. Products
- 12.1.1.3. Company Financials
- 12.1.1.4. SWOT Analysis
- 12.1.2 Rackspace Technology Inc
- 12.1.2.1. Company Overview
- 12.1.2.2. Products
- 12.1.2.3. Company Financials
- 12.1.2.4. SWOT Analysis
- 12.1.3 IBM Corporation
- 12.1.3.1. Company Overview
- 12.1.3.2. Products
- 12.1.3.3. Company Financials
- 12.1.3.4. SWOT Analysis
- 12.1.4 Cisco Systems Inc
- 12.1.4.1. Company Overview
- 12.1.4.2. Products
- 12.1.4.3. Company Financials
- 12.1.4.4. SWOT Analysis
- 12.1.5 Verizon Communications Inc
- 12.1.5.1. Company Overview
- 12.1.5.2. Products
- 12.1.5.3. Company Financials
- 12.1.5.4. SWOT Analysis
- 12.1.6 Microsoft Corporation
- 12.1.6.1. Company Overview
- 12.1.6.2. Products
- 12.1.6.3. Company Financials
- 12.1.6.4. SWOT Analysis
- 12.1.7 HP Inc
- 12.1.7.1. Company Overview
- 12.1.7.2. Products
- 12.1.7.3. Company Financials
- 12.1.7.4. SWOT Analysis
- 12.1.8 Fujitsu Limited
- 12.1.8.1. Company Overview
- 12.1.8.2. Products
- 12.1.8.3. Company Financials
- 12.1.8.4. SWOT Analysis
- 12.1.9 Tata Consultancy Services Limited
- 12.1.9.1. Company Overview
- 12.1.9.2. Products
- 12.1.9.3. Company Financials
- 12.1.9.4. SWOT Analysis
- 12.1.10 Dell Technologies Inc
- 12.1.10.1. Company Overview
- 12.1.10.2. Products
- 12.1.10.3. Company Financials
- 12.1.10.4. SWOT Analysis
- 12.1.11 AT&T Inc
- 12.1.11.1. Company Overview
- 12.1.11.2. Products
- 12.1.11.3. Company Financials
- 12.1.11.4. SWOT Analysis
- 12.1.12 Citrix Systems Inc
- 12.1.12.1. Company Overview
- 12.1.12.2. Products
- 12.1.12.3. Company Financials
- 12.1.12.4. SWOT Analysis
- 12.1.1 Wipro Limite
- 12.2. Market Entropy
- 12.2.1 Company's Key Areas Served
- 12.2.2 Recent Developments
- 12.3. Company Market Share Analysis 2025
- 12.3.1 Top 5 Companies Market Share Analysis
- 12.3.2 Top 3 Companies Market Share Analysis
- 12.4. List of Potential Customers
- 13. Research Methodology
List of Figures
- Figure 1: Global USA Managed Service Industry Revenue Breakdown (Million, %) by Region 2025 & 2033
- Figure 2: North America USA Managed Service Industry Revenue (Million), by Deployment 2025 & 2033
- Figure 3: North America USA Managed Service Industry Revenue Share (%), by Deployment 2025 & 2033
- Figure 4: North America USA Managed Service Industry Revenue (Million), by Type 2025 & 2033
- Figure 5: North America USA Managed Service Industry Revenue Share (%), by Type 2025 & 2033
- Figure 6: North America USA Managed Service Industry Revenue (Million), by Enterprise Size 2025 & 2033
- Figure 7: North America USA Managed Service Industry Revenue Share (%), by Enterprise Size 2025 & 2033
- Figure 8: North America USA Managed Service Industry Revenue (Million), by End-user Vertical 2025 & 2033
- Figure 9: North America USA Managed Service Industry Revenue Share (%), by End-user Vertical 2025 & 2033
- Figure 10: North America USA Managed Service Industry Revenue (Million), by Country 2025 & 2033
- Figure 11: North America USA Managed Service Industry Revenue Share (%), by Country 2025 & 2033
- Figure 12: South America USA Managed Service Industry Revenue (Million), by Deployment 2025 & 2033
- Figure 13: South America USA Managed Service Industry Revenue Share (%), by Deployment 2025 & 2033
- Figure 14: South America USA Managed Service Industry Revenue (Million), by Type 2025 & 2033
- Figure 15: South America USA Managed Service Industry Revenue Share (%), by Type 2025 & 2033
- Figure 16: South America USA Managed Service Industry Revenue (Million), by Enterprise Size 2025 & 2033
- Figure 17: South America USA Managed Service Industry Revenue Share (%), by Enterprise Size 2025 & 2033
- Figure 18: South America USA Managed Service Industry Revenue (Million), by End-user Vertical 2025 & 2033
- Figure 19: South America USA Managed Service Industry Revenue Share (%), by End-user Vertical 2025 & 2033
- Figure 20: South America USA Managed Service Industry Revenue (Million), by Country 2025 & 2033
- Figure 21: South America USA Managed Service Industry Revenue Share (%), by Country 2025 & 2033
- Figure 22: Europe USA Managed Service Industry Revenue (Million), by Deployment 2025 & 2033
- Figure 23: Europe USA Managed Service Industry Revenue Share (%), by Deployment 2025 & 2033
- Figure 24: Europe USA Managed Service Industry Revenue (Million), by Type 2025 & 2033
- Figure 25: Europe USA Managed Service Industry Revenue Share (%), by Type 2025 & 2033
- Figure 26: Europe USA Managed Service Industry Revenue (Million), by Enterprise Size 2025 & 2033
- Figure 27: Europe USA Managed Service Industry Revenue Share (%), by Enterprise Size 2025 & 2033
- Figure 28: Europe USA Managed Service Industry Revenue (Million), by End-user Vertical 2025 & 2033
- Figure 29: Europe USA Managed Service Industry Revenue Share (%), by End-user Vertical 2025 & 2033
- Figure 30: Europe USA Managed Service Industry Revenue (Million), by Country 2025 & 2033
- Figure 31: Europe USA Managed Service Industry Revenue Share (%), by Country 2025 & 2033
- Figure 32: Middle East & Africa USA Managed Service Industry Revenue (Million), by Deployment 2025 & 2033
- Figure 33: Middle East & Africa USA Managed Service Industry Revenue Share (%), by Deployment 2025 & 2033
- Figure 34: Middle East & Africa USA Managed Service Industry Revenue (Million), by Type 2025 & 2033
- Figure 35: Middle East & Africa USA Managed Service Industry Revenue Share (%), by Type 2025 & 2033
- Figure 36: Middle East & Africa USA Managed Service Industry Revenue (Million), by Enterprise Size 2025 & 2033
- Figure 37: Middle East & Africa USA Managed Service Industry Revenue Share (%), by Enterprise Size 2025 & 2033
- Figure 38: Middle East & Africa USA Managed Service Industry Revenue (Million), by End-user Vertical 2025 & 2033
- Figure 39: Middle East & Africa USA Managed Service Industry Revenue Share (%), by End-user Vertical 2025 & 2033
- Figure 40: Middle East & Africa USA Managed Service Industry Revenue (Million), by Country 2025 & 2033
- Figure 41: Middle East & Africa USA Managed Service Industry Revenue Share (%), by Country 2025 & 2033
- Figure 42: Asia Pacific USA Managed Service Industry Revenue (Million), by Deployment 2025 & 2033
- Figure 43: Asia Pacific USA Managed Service Industry Revenue Share (%), by Deployment 2025 & 2033
- Figure 44: Asia Pacific USA Managed Service Industry Revenue (Million), by Type 2025 & 2033
- Figure 45: Asia Pacific USA Managed Service Industry Revenue Share (%), by Type 2025 & 2033
- Figure 46: Asia Pacific USA Managed Service Industry Revenue (Million), by Enterprise Size 2025 & 2033
- Figure 47: Asia Pacific USA Managed Service Industry Revenue Share (%), by Enterprise Size 2025 & 2033
- Figure 48: Asia Pacific USA Managed Service Industry Revenue (Million), by End-user Vertical 2025 & 2033
- Figure 49: Asia Pacific USA Managed Service Industry Revenue Share (%), by End-user Vertical 2025 & 2033
- Figure 50: Asia Pacific USA Managed Service Industry Revenue (Million), by Country 2025 & 2033
- Figure 51: Asia Pacific USA Managed Service Industry Revenue Share (%), by Country 2025 & 2033
List of Tables
- Table 1: Global USA Managed Service Industry Revenue Million Forecast, by Deployment 2020 & 2033
- Table 2: Global USA Managed Service Industry Revenue Million Forecast, by Type 2020 & 2033
- Table 3: Global USA Managed Service Industry Revenue Million Forecast, by Enterprise Size 2020 & 2033
- Table 4: Global USA Managed Service Industry Revenue Million Forecast, by End-user Vertical 2020 & 2033
- Table 5: Global USA Managed Service Industry Revenue Million Forecast, by Region 2020 & 2033
- Table 6: Global USA Managed Service Industry Revenue Million Forecast, by Deployment 2020 & 2033
- Table 7: Global USA Managed Service Industry Revenue Million Forecast, by Type 2020 & 2033
- Table 8: Global USA Managed Service Industry Revenue Million Forecast, by Enterprise Size 2020 & 2033
- Table 9: Global USA Managed Service Industry Revenue Million Forecast, by End-user Vertical 2020 & 2033
- Table 10: Global USA Managed Service Industry Revenue Million Forecast, by Country 2020 & 2033
- Table 11: United States USA Managed Service Industry Revenue (Million) Forecast, by Application 2020 & 2033
- Table 12: Canada USA Managed Service Industry Revenue (Million) Forecast, by Application 2020 & 2033
- Table 13: Mexico USA Managed Service Industry Revenue (Million) Forecast, by Application 2020 & 2033
- Table 14: Global USA Managed Service Industry Revenue Million Forecast, by Deployment 2020 & 2033
- Table 15: Global USA Managed Service Industry Revenue Million Forecast, by Type 2020 & 2033
- Table 16: Global USA Managed Service Industry Revenue Million Forecast, by Enterprise Size 2020 & 2033
- Table 17: Global USA Managed Service Industry Revenue Million Forecast, by End-user Vertical 2020 & 2033
- Table 18: Global USA Managed Service Industry Revenue Million Forecast, by Country 2020 & 2033
- Table 19: Brazil USA Managed Service Industry Revenue (Million) Forecast, by Application 2020 & 2033
- Table 20: Argentina USA Managed Service Industry Revenue (Million) Forecast, by Application 2020 & 2033
- Table 21: Rest of South America USA Managed Service Industry Revenue (Million) Forecast, by Application 2020 & 2033
- Table 22: Global USA Managed Service Industry Revenue Million Forecast, by Deployment 2020 & 2033
- Table 23: Global USA Managed Service Industry Revenue Million Forecast, by Type 2020 & 2033
- Table 24: Global USA Managed Service Industry Revenue Million Forecast, by Enterprise Size 2020 & 2033
- Table 25: Global USA Managed Service Industry Revenue Million Forecast, by End-user Vertical 2020 & 2033
- Table 26: Global USA Managed Service Industry Revenue Million Forecast, by Country 2020 & 2033
- Table 27: United Kingdom USA Managed Service Industry Revenue (Million) Forecast, by Application 2020 & 2033
- Table 28: Germany USA Managed Service Industry Revenue (Million) Forecast, by Application 2020 & 2033
- Table 29: France USA Managed Service Industry Revenue (Million) Forecast, by Application 2020 & 2033
- Table 30: Italy USA Managed Service Industry Revenue (Million) Forecast, by Application 2020 & 2033
- Table 31: Spain USA Managed Service Industry Revenue (Million) Forecast, by Application 2020 & 2033
- Table 32: Russia USA Managed Service Industry Revenue (Million) Forecast, by Application 2020 & 2033
- Table 33: Benelux USA Managed Service Industry Revenue (Million) Forecast, by Application 2020 & 2033
- Table 34: Nordics USA Managed Service Industry Revenue (Million) Forecast, by Application 2020 & 2033
- Table 35: Rest of Europe USA Managed Service Industry Revenue (Million) Forecast, by Application 2020 & 2033
- Table 36: Global USA Managed Service Industry Revenue Million Forecast, by Deployment 2020 & 2033
- Table 37: Global USA Managed Service Industry Revenue Million Forecast, by Type 2020 & 2033
- Table 38: Global USA Managed Service Industry Revenue Million Forecast, by Enterprise Size 2020 & 2033
- Table 39: Global USA Managed Service Industry Revenue Million Forecast, by End-user Vertical 2020 & 2033
- Table 40: Global USA Managed Service Industry Revenue Million Forecast, by Country 2020 & 2033
- Table 41: Turkey USA Managed Service Industry Revenue (Million) Forecast, by Application 2020 & 2033
- Table 42: Israel USA Managed Service Industry Revenue (Million) Forecast, by Application 2020 & 2033
- Table 43: GCC USA Managed Service Industry Revenue (Million) Forecast, by Application 2020 & 2033
- Table 44: North Africa USA Managed Service Industry Revenue (Million) Forecast, by Application 2020 & 2033
- Table 45: South Africa USA Managed Service Industry Revenue (Million) Forecast, by Application 2020 & 2033
- Table 46: Rest of Middle East & Africa USA Managed Service Industry Revenue (Million) Forecast, by Application 2020 & 2033
- Table 47: Global USA Managed Service Industry Revenue Million Forecast, by Deployment 2020 & 2033
- Table 48: Global USA Managed Service Industry Revenue Million Forecast, by Type 2020 & 2033
- Table 49: Global USA Managed Service Industry Revenue Million Forecast, by Enterprise Size 2020 & 2033
- Table 50: Global USA Managed Service Industry Revenue Million Forecast, by End-user Vertical 2020 & 2033
- Table 51: Global USA Managed Service Industry Revenue Million Forecast, by Country 2020 & 2033
- Table 52: China USA Managed Service Industry Revenue (Million) Forecast, by Application 2020 & 2033
- Table 53: India USA Managed Service Industry Revenue (Million) Forecast, by Application 2020 & 2033
- Table 54: Japan USA Managed Service Industry Revenue (Million) Forecast, by Application 2020 & 2033
- Table 55: South Korea USA Managed Service Industry Revenue (Million) Forecast, by Application 2020 & 2033
- Table 56: ASEAN USA Managed Service Industry Revenue (Million) Forecast, by Application 2020 & 2033
- Table 57: Oceania USA Managed Service Industry Revenue (Million) Forecast, by Application 2020 & 2033
- Table 58: Rest of Asia Pacific USA Managed Service Industry Revenue (Million) Forecast, by Application 2020 & 2033
Frequently Asked Questions
1. What is the projected Compound Annual Growth Rate (CAGR) of the USA Managed Service Industry?
The projected CAGR is approximately 10.82%.
2. Which companies are prominent players in the USA Managed Service Industry?
Key companies in the market include Wipro Limite, Rackspace Technology Inc, IBM Corporation, Cisco Systems Inc, Verizon Communications Inc, Microsoft Corporation, HP Inc, Fujitsu Limited, Tata Consultancy Services Limited, Dell Technologies Inc, AT&T Inc, Citrix Systems Inc.
3. What are the main segments of the USA Managed Service Industry?
The market segments include Deployment, Type, Enterprise Size, End-user Vertical.
4. Can you provide details about the market size?
The market size is estimated to be USD 62.76 Million as of 2022.
5. What are some drivers contributing to market growth?
Increasing Shift to Hybrid IT; Improved Cost and Operational Efficiency.
6. What are the notable trends driving market growth?
Cloud to Witness Significant Growth.
7. Are there any restraints impacting market growth?
High Risk of Radiation Since it uses Gamma Rays. X-Rays; High Deployment Costs.
8. Can you provide examples of recent developments in the market?
October 2023 - Rackspace Technology introduced Rackspace Managed Cloud (RMC), an all-inclusive service enabling customers to delegate their cloud environments' management and operations. This comprehensive solution is tailored for organizations utilizing platforms such as AWS, Azure, Google Cloud, Rackspace Private Cloud, and on-premises infrastructure.
9. What pricing options are available for accessing the report?
Pricing options include single-user, multi-user, and enterprise licenses priced at USD 3800, USD 4500, and USD 5800 respectively.
10. Is the market size provided in terms of value or volume?
The market size is provided in terms of value, measured in Million.
11. Are there any specific market keywords associated with the report?
Yes, the market keyword associated with the report is "USA Managed Service Industry," which aids in identifying and referencing the specific market segment covered.
12. How do I determine which pricing option suits my needs best?
The pricing options vary based on user requirements and access needs. Individual users may opt for single-user licenses, while businesses requiring broader access may choose multi-user or enterprise licenses for cost-effective access to the report.
13. Are there any additional resources or data provided in the USA Managed Service Industry report?
While the report offers comprehensive insights, it's advisable to review the specific contents or supplementary materials provided to ascertain if additional resources or data are available.
14. How can I stay updated on further developments or reports in the USA Managed Service Industry?
To stay informed about further developments, trends, and reports in the USA Managed Service Industry, consider subscribing to industry newsletters, following relevant companies and organizations, or regularly checking reputable industry news sources and publications.
Methodology
Step 1 - Identification of Relevant Samples Size from Population Database


Step 2 - Approaches for Defining Global Market Size (Value, Volume* & Price*)

Note*: In applicable scenarios
Step 3 - Data Sources
Primary Research
- Web Analytics
- Survey Reports
- Research Institute
- Latest Research Reports
- Opinion Leaders
Secondary Research
- Annual Reports
- White Paper
- Latest Press Release
- Industry Association
- Paid Database
- Investor Presentations

Step 4 - Data Triangulation
Involves using different sources of information in order to increase the validity of a study
These sources are likely to be stakeholders in a program - participants, other researchers, program staff, other community members, and so on.
Then we put all data in single framework & apply various statistical tools to find out the dynamic on the market.
During the analysis stage, feedback from the stakeholder groups would be compared to determine areas of agreement as well as areas of divergence

