

Key Insights
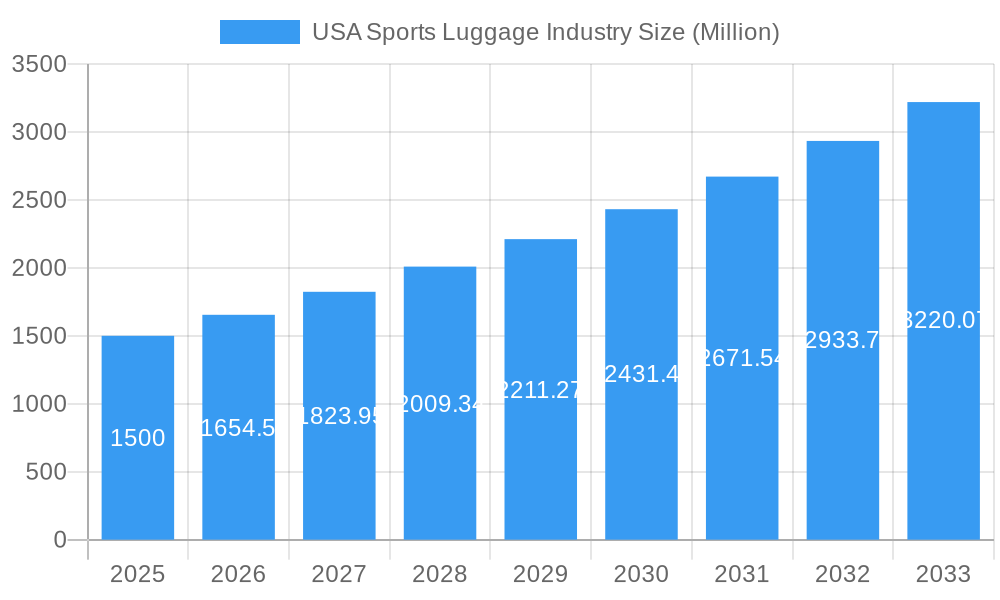
The U.S. Sports Luggage Market, estimated at $8.48 billion in 2025, is poised for significant expansion, projected to grow at a Compound Annual Growth Rate (CAGR) of 8.08% from 2025 to 2033. Key growth drivers include the increasing popularity of sports like golf, soccer, and baseball, stimulating demand for specialized equipment bags. The rise in participation in winter sports, supported by growing disposable incomes and a focus on outdoor recreation, also significantly contributes to market expansion. E-commerce continues to enhance accessibility to a broader product selection, further fueling market growth. Potential headwinds include raw material price volatility and economic downturns affecting discretionary spending. Online retail channels are notably gaining traction within the market's segmentation analysis. Leading brands such as Adidas, Nike, and Under Armour are actively investing in innovative designs and strategic marketing to meet diverse consumer needs across various sports and price segments. Higher growth is anticipated in regions like the Northeast and West, attributed to a concentration of affluent consumers and robust sports infrastructure.
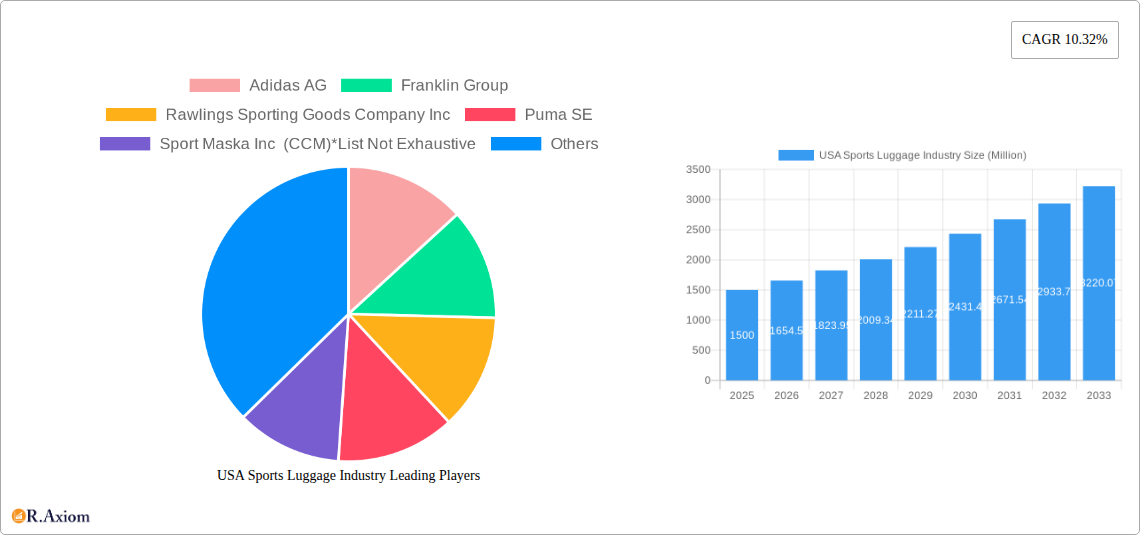
USA Sports Luggage Industry Market Size (In Billion)
The competitive environment features both established global brands and specialized niche players. Major companies maintain market dominance through strong brand equity and extensive distribution networks. Concurrently, emerging specialized firms are introducing innovative designs and sustainable materials, targeting specific sports segments. The forecast period (2025-2033) anticipates sustained growth driven by increased health consciousness, the e-commerce boom, and product innovation emphasizing durability, functionality, and aesthetics. Market segmentation by sport (e.g., golf, soccer, baseball) and distribution channel (e.g., online, specialty stores) provides critical insights for targeted marketing strategies. Future expansion will likely be influenced by the adoption of sustainable industry practices and the development of advanced luggage solutions.
USA Sports Luggage Industry Company Market Share
USA Sports Luggage Industry: A Comprehensive Market Report (2019-2033)
This comprehensive report provides a detailed analysis of the USA sports luggage industry, offering invaluable insights for industry stakeholders, investors, and strategic decision-makers. The report covers the period from 2019 to 2033, with 2025 serving as the base and estimated year. The forecast period spans from 2025 to 2033, while the historical period encompasses 2019-2024. The market size is expressed in Millions throughout the report.
USA Sports Luggage Industry Market Concentration & Innovation
This section analyzes the competitive landscape of the USA sports luggage industry, examining market concentration, innovation drivers, regulatory frameworks, product substitutes, end-user trends, and mergers & acquisitions (M&A) activities. The industry exhibits a moderately concentrated structure, with key players like Nike Inc, Adidas AG, and Under Armour Inc holding significant market share (estimated at xx% combined in 2025). Smaller players like Franklin Group, Rawlings Sporting Goods Company Inc, Puma SE, and Select Sport AS compete fiercely in niche segments.
- Market Share: Nike Inc holds the largest market share, estimated at xx% in 2025. Adidas AG and Under Armour Inc follow with xx% and xx%, respectively.
- Innovation Drivers: Lightweight materials, advanced durability features, and integrated technology (e.g., GPS tracking, smart sensors) are driving innovation.
- Regulatory Framework: Compliance with safety standards and environmental regulations influences product development and manufacturing.
- Product Substitutes: Backpacks, duffel bags, and other general-purpose luggage present some level of substitution.
- End-User Trends: Growing participation in sports, increasing disposable incomes, and a preference for specialized equipment are key end-user trends.
- M&A Activities: The past five years have seen xx M&A deals with a total value of approximately $xx Million, primarily focused on expanding product portfolios and market reach.
USA Sports Luggage Industry Industry Trends & Insights
The USA sports luggage market is experiencing robust growth, driven by several factors. The compound annual growth rate (CAGR) is projected to be xx% during the forecast period (2025-2033). Increased participation in various sports, particularly among younger demographics, is a significant driver. Technological advancements, such as the incorporation of smart features and sustainable materials, are also boosting market growth. Consumer preference for stylish and functional luggage is shaping product design and marketing strategies. Intense competition among established brands and emerging players is leading to product diversification and innovative marketing campaigns. Market penetration of specialized sports luggage is increasing, with golf, soccer, and baseball equipment showing particularly strong growth. The online retail channel is experiencing significant growth, exceeding xx% market penetration by 2025.
Dominant Markets & Segments in USA Sports Luggage Industry
The dominant segments within the USA sports luggage market are analyzed based on sports type and distribution channel.
Sports Type:
- Golf: High disposable income among golfers and the specialized nature of golf equipment drive the dominance of this segment. Economic factors, such as the growth of the golfing industry, play a crucial role.
- Soccer: High participation rates, especially among youth, drive strong demand for soccer-specific luggage.
- Baseball: Similar to soccer, high youth participation and specialized equipment needs contribute to market dominance.
- Other Sports: This segment showcases diverse growth opportunities and experiences fluctuations depending on overall sports participation trends.
Distribution Channel:
- Online Retailing: E-commerce platforms offer convenience and competitive pricing, leading to rapid growth in this segment.
- Specialty Stores: These stores provide expert advice and a curated selection of high-quality products, maintaining a significant market share despite online competition.
- Supermarkets/Hypermarkets: While offering convenience, this channel holds a smaller share compared to online and specialty stores due to limited specialized product offerings.
USA Sports Luggage Industry Product Developments
Recent product innovations focus on lightweight yet durable materials, enhanced storage solutions, and improved ergonomics. The integration of smart technologies, such as GPS trackers and RFID chips for asset management, is gaining traction. These developments cater to the increasing demand for high-performance and technologically advanced sports luggage. The market is witnessing a shift towards sustainable and eco-friendly manufacturing processes, utilizing recycled and biodegradable materials.
Report Scope & Segmentation Analysis
This report segments the USA sports luggage market by sports type (Golf, Soccer, Baseball, Snow/Winter Sports, Football, Other Sports) and distribution channel (Supermarkets/Hypermarkets, Specialty Stores, Online Retailing, Other Distribution Channels). Each segment's growth projection, market size, and competitive landscape are analyzed in detail. For example, the online retailing segment shows a projected CAGR of xx% over the forecast period due to increasing e-commerce penetration. Similarly, the Golf segment enjoys high growth due to the high spending power of its consumers. The detailed analysis provides insights into each sub-segment's market dynamics and growth trajectory.
Key Drivers of USA Sports Luggage Industry Growth
Several factors contribute to the growth of the USA sports luggage industry. Technological advancements in materials science and manufacturing processes lead to lighter, more durable, and feature-rich products. Rising disposable incomes and increased participation in sports, particularly among youth, fuel demand. Furthermore, favorable government policies promoting sports participation and healthy lifestyles support industry expansion.
Challenges in the USA Sports Luggage Industry Sector
The industry faces challenges such as fluctuating raw material prices, supply chain disruptions, and intense competition. Counterfeit products pose a threat to brand reputation and profitability. Environmental regulations related to material sourcing and manufacturing processes also present challenges. These factors can significantly impact production costs and market competitiveness. The estimated impact on profitability from these challenges is approximately xx% in 2025.
Emerging Opportunities in USA Sports Luggage Industry
Emerging opportunities include the growing demand for sustainable and eco-friendly luggage, the integration of smart technologies, and expansion into niche sports markets. The development of personalized and customizable luggage options offers further potential. Moreover, exploring untapped international markets and adopting innovative marketing strategies present promising avenues for growth.
Leading Players in the USA Sports Luggage Industry Market
- Adidas AG
- Franklin Group
- Rawlings Sporting Goods Company Inc
- Puma SE
- Sport Maska Inc (CCM)
- Under Armour Inc
- Nike Inc
- Select Sport AS
Key Developments in USA Sports Luggage Industry Industry
- 2022 Q3: Nike Inc. launched a new line of sustainable sports luggage.
- 2023 Q1: Adidas AG acquired a smaller luggage manufacturer, expanding its product portfolio.
- 2024 Q2: Under Armour Inc. partnered with a technology firm to integrate smart features into its luggage.
- Further developments will be detailed in the full report.
Strategic Outlook for USA Sports Luggage Industry Market
The future of the USA sports luggage industry is promising, with continued growth driven by technological innovation, increased sports participation, and evolving consumer preferences. The market is poised to benefit from the rising adoption of sustainable practices and the integration of smart technologies. Companies that successfully adapt to these trends and leverage emerging opportunities will maintain a competitive edge. The market is projected to reach $xx Million by 2033, representing significant growth potential.
USA Sports Luggage Industry Segmentation
-
1. Sports Type
- 1.1. Golf
- 1.2. Soccer
- 1.3. Baseball
- 1.4. Snow/Winter Sports
- 1.5. Football
- 1.6. Other Sports
-
2. Distribution Channel
- 2.1. Supermarkets/Hypermarkets
- 2.2. Specialty Stores
- 2.3. Online Retailing
- 2.4. Other Distribution Channels
USA Sports Luggage Industry Segmentation By Geography
-
1. North America
- 1.1. United States
- 1.2. Canada
- 1.3. Mexico
-
2. South America
- 2.1. Brazil
- 2.2. Argentina
- 2.3. Rest of South America
-
3. Europe
- 3.1. United Kingdom
- 3.2. Germany
- 3.3. France
- 3.4. Italy
- 3.5. Spain
- 3.6. Russia
- 3.7. Benelux
- 3.8. Nordics
- 3.9. Rest of Europe
-
4. Middle East & Africa
- 4.1. Turkey
- 4.2. Israel
- 4.3. GCC
- 4.4. North Africa
- 4.5. South Africa
- 4.6. Rest of Middle East & Africa
-
5. Asia Pacific
- 5.1. China
- 5.2. India
- 5.3. Japan
- 5.4. South Korea
- 5.5. ASEAN
- 5.6. Oceania
- 5.7. Rest of Asia Pacific
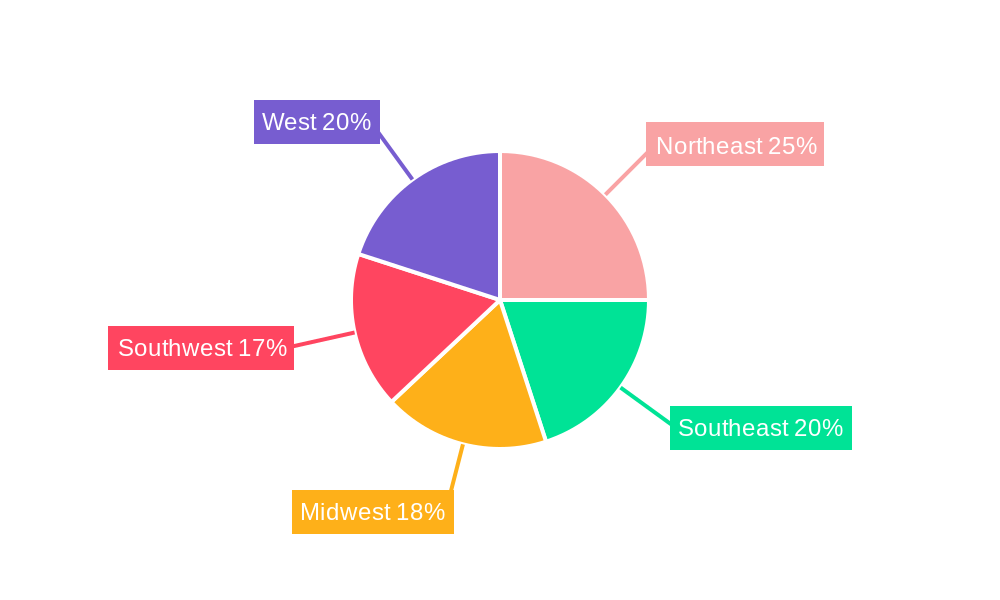
USA Sports Luggage Industry Regional Market Share
Geographic Coverage of USA Sports Luggage Industry
USA Sports Luggage Industry REPORT HIGHLIGHTS
| Aspects | Details |
|---|---|
| Study Period | 2020-2034 |
| Base Year | 2025 |
| Estimated Year | 2026 |
| Forecast Period | 2026-2034 |
| Historical Period | 2020-2025 |
| Growth Rate | CAGR of 8.08% from 2020-2034 |
| Segmentation |
|
Table of Contents
- 1. Introduction
- 1.1. Research Scope
- 1.2. Market Segmentation
- 1.3. Research Objective
- 1.4. Definitions and Assumptions
- 2. Executive Summary
- 2.1. Market Snapshot
- 3. Market Dynamics
- 3.1. Market Drivers
- 3.2. Market Restrains
- 3.3. Market Trends
- 3.4. Market Opportunities
- 4. Market Factor Analysis
- 4.1. Porters Five Forces
- 4.1.1. Bargaining Power of Suppliers
- 4.1.2. Bargaining Power of Buyers
- 4.1.3. Threat of New Entrants
- 4.1.4. Threat of Substitutes
- 4.1.5. Competitive Rivalry
- 4.2. PESTEL analysis
- 4.3. BCG Analysis
- 4.3.1. Stars (High Growth, High Market Share)
- 4.3.2. Cash Cows (Low Growth, High Market Share)
- 4.3.3. Question Mark (High Growth, Low Market Share)
- 4.3.4. Dogs (Low Growth, Low Market Share)
- 4.4. Ansoff Matrix Analysis
- 4.5. Supply Chain Analysis
- 4.6. Regulatory Landscape
- 4.7. Current Market Potential and Opportunity Assessment (TAM–SAM–SOM Framework)
- 4.8. RAX Analyst Note
- 4.1. Porters Five Forces
- 5. Market Analysis, Insights and Forecast 2021-2033
- 5.1. Market Analysis, Insights and Forecast - by Sports Type
- 5.1.1. Golf
- 5.1.2. Soccer
- 5.1.3. Baseball
- 5.1.4. Snow/Winter Sports
- 5.1.5. Football
- 5.1.6. Other Sports
- 5.2. Market Analysis, Insights and Forecast - by Distribution Channel
- 5.2.1. Supermarkets/Hypermarkets
- 5.2.2. Specialty Stores
- 5.2.3. Online Retailing
- 5.2.4. Other Distribution Channels
- 5.3. Market Analysis, Insights and Forecast - by Region
- 5.3.1. North America
- 5.3.2. South America
- 5.3.3. Europe
- 5.3.4. Middle East & Africa
- 5.3.5. Asia Pacific
- 5.1. Market Analysis, Insights and Forecast - by Sports Type
- 6. Global USA Sports Luggage Industry Analysis, Insights and Forecast, 2021-2033
- 6.1. Market Analysis, Insights and Forecast - by Sports Type
- 6.1.1. Golf
- 6.1.2. Soccer
- 6.1.3. Baseball
- 6.1.4. Snow/Winter Sports
- 6.1.5. Football
- 6.1.6. Other Sports
- 6.2. Market Analysis, Insights and Forecast - by Distribution Channel
- 6.2.1. Supermarkets/Hypermarkets
- 6.2.2. Specialty Stores
- 6.2.3. Online Retailing
- 6.2.4. Other Distribution Channels
- 6.1. Market Analysis, Insights and Forecast - by Sports Type
- 7. North America USA Sports Luggage Industry Analysis, Insights and Forecast, 2020-2032
- 7.1. Market Analysis, Insights and Forecast - by Sports Type
- 7.1.1. Golf
- 7.1.2. Soccer
- 7.1.3. Baseball
- 7.1.4. Snow/Winter Sports
- 7.1.5. Football
- 7.1.6. Other Sports
- 7.2. Market Analysis, Insights and Forecast - by Distribution Channel
- 7.2.1. Supermarkets/Hypermarkets
- 7.2.2. Specialty Stores
- 7.2.3. Online Retailing
- 7.2.4. Other Distribution Channels
- 7.1. Market Analysis, Insights and Forecast - by Sports Type
- 8. South America USA Sports Luggage Industry Analysis, Insights and Forecast, 2020-2032
- 8.1. Market Analysis, Insights and Forecast - by Sports Type
- 8.1.1. Golf
- 8.1.2. Soccer
- 8.1.3. Baseball
- 8.1.4. Snow/Winter Sports
- 8.1.5. Football
- 8.1.6. Other Sports
- 8.2. Market Analysis, Insights and Forecast - by Distribution Channel
- 8.2.1. Supermarkets/Hypermarkets
- 8.2.2. Specialty Stores
- 8.2.3. Online Retailing
- 8.2.4. Other Distribution Channels
- 8.1. Market Analysis, Insights and Forecast - by Sports Type
- 9. Europe USA Sports Luggage Industry Analysis, Insights and Forecast, 2020-2032
- 9.1. Market Analysis, Insights and Forecast - by Sports Type
- 9.1.1. Golf
- 9.1.2. Soccer
- 9.1.3. Baseball
- 9.1.4. Snow/Winter Sports
- 9.1.5. Football
- 9.1.6. Other Sports
- 9.2. Market Analysis, Insights and Forecast - by Distribution Channel
- 9.2.1. Supermarkets/Hypermarkets
- 9.2.2. Specialty Stores
- 9.2.3. Online Retailing
- 9.2.4. Other Distribution Channels
- 9.1. Market Analysis, Insights and Forecast - by Sports Type
- 10. Middle East & Africa USA Sports Luggage Industry Analysis, Insights and Forecast, 2020-2032
- 10.1. Market Analysis, Insights and Forecast - by Sports Type
- 10.1.1. Golf
- 10.1.2. Soccer
- 10.1.3. Baseball
- 10.1.4. Snow/Winter Sports
- 10.1.5. Football
- 10.1.6. Other Sports
- 10.2. Market Analysis, Insights and Forecast - by Distribution Channel
- 10.2.1. Supermarkets/Hypermarkets
- 10.2.2. Specialty Stores
- 10.2.3. Online Retailing
- 10.2.4. Other Distribution Channels
- 10.1. Market Analysis, Insights and Forecast - by Sports Type
- 11. Asia Pacific USA Sports Luggage Industry Analysis, Insights and Forecast, 2020-2032
- 11.1. Market Analysis, Insights and Forecast - by Sports Type
- 11.1.1. Golf
- 11.1.2. Soccer
- 11.1.3. Baseball
- 11.1.4. Snow/Winter Sports
- 11.1.5. Football
- 11.1.6. Other Sports
- 11.2. Market Analysis, Insights and Forecast - by Distribution Channel
- 11.2.1. Supermarkets/Hypermarkets
- 11.2.2. Specialty Stores
- 11.2.3. Online Retailing
- 11.2.4. Other Distribution Channels
- 11.1. Market Analysis, Insights and Forecast - by Sports Type
- 12. Competitive Analysis
- 12.1. Company Profiles
- 12.1.1 Adidas AG
- 12.1.1.1. Company Overview
- 12.1.1.2. Products
- 12.1.1.3. Company Financials
- 12.1.1.4. SWOT Analysis
- 12.1.2 Franklin Group
- 12.1.2.1. Company Overview
- 12.1.2.2. Products
- 12.1.2.3. Company Financials
- 12.1.2.4. SWOT Analysis
- 12.1.3 Rawlings Sporting Goods Company Inc
- 12.1.3.1. Company Overview
- 12.1.3.2. Products
- 12.1.3.3. Company Financials
- 12.1.3.4. SWOT Analysis
- 12.1.4 Puma SE
- 12.1.4.1. Company Overview
- 12.1.4.2. Products
- 12.1.4.3. Company Financials
- 12.1.4.4. SWOT Analysis
- 12.1.5 Sport Maska Inc (CCM)*List Not Exhaustive
- 12.1.5.1. Company Overview
- 12.1.5.2. Products
- 12.1.5.3. Company Financials
- 12.1.5.4. SWOT Analysis
- 12.1.6 Under Armour Inc
- 12.1.6.1. Company Overview
- 12.1.6.2. Products
- 12.1.6.3. Company Financials
- 12.1.6.4. SWOT Analysis
- 12.1.7 Nike Inc
- 12.1.7.1. Company Overview
- 12.1.7.2. Products
- 12.1.7.3. Company Financials
- 12.1.7.4. SWOT Analysis
- 12.1.8 Select Sport AS
- 12.1.8.1. Company Overview
- 12.1.8.2. Products
- 12.1.8.3. Company Financials
- 12.1.8.4. SWOT Analysis
- 12.1.1 Adidas AG
- 12.2. Market Entropy
- 12.2.1 Company's Key Areas Served
- 12.2.2 Recent Developments
- 12.3. Company Market Share Analysis 2025
- 12.3.1 Top 5 Companies Market Share Analysis
- 12.3.2 Top 3 Companies Market Share Analysis
- 12.4. List of Potential Customers
- 13. Research Methodology
List of Figures
- Figure 1: Global USA Sports Luggage Industry Revenue Breakdown (billion, %) by Region 2025 & 2033
- Figure 2: Global USA Sports Luggage Industry Volume Breakdown (K Units, %) by Region 2025 & 2033
- Figure 3: North America USA Sports Luggage Industry Revenue (billion), by Sports Type 2025 & 2033
- Figure 4: North America USA Sports Luggage Industry Volume (K Units), by Sports Type 2025 & 2033
- Figure 5: North America USA Sports Luggage Industry Revenue Share (%), by Sports Type 2025 & 2033
- Figure 6: North America USA Sports Luggage Industry Volume Share (%), by Sports Type 2025 & 2033
- Figure 7: North America USA Sports Luggage Industry Revenue (billion), by Distribution Channel 2025 & 2033
- Figure 8: North America USA Sports Luggage Industry Volume (K Units), by Distribution Channel 2025 & 2033
- Figure 9: North America USA Sports Luggage Industry Revenue Share (%), by Distribution Channel 2025 & 2033
- Figure 10: North America USA Sports Luggage Industry Volume Share (%), by Distribution Channel 2025 & 2033
- Figure 11: North America USA Sports Luggage Industry Revenue (billion), by Country 2025 & 2033
- Figure 12: North America USA Sports Luggage Industry Volume (K Units), by Country 2025 & 2033
- Figure 13: North America USA Sports Luggage Industry Revenue Share (%), by Country 2025 & 2033
- Figure 14: North America USA Sports Luggage Industry Volume Share (%), by Country 2025 & 2033
- Figure 15: South America USA Sports Luggage Industry Revenue (billion), by Sports Type 2025 & 2033
- Figure 16: South America USA Sports Luggage Industry Volume (K Units), by Sports Type 2025 & 2033
- Figure 17: South America USA Sports Luggage Industry Revenue Share (%), by Sports Type 2025 & 2033
- Figure 18: South America USA Sports Luggage Industry Volume Share (%), by Sports Type 2025 & 2033
- Figure 19: South America USA Sports Luggage Industry Revenue (billion), by Distribution Channel 2025 & 2033
- Figure 20: South America USA Sports Luggage Industry Volume (K Units), by Distribution Channel 2025 & 2033
- Figure 21: South America USA Sports Luggage Industry Revenue Share (%), by Distribution Channel 2025 & 2033
- Figure 22: South America USA Sports Luggage Industry Volume Share (%), by Distribution Channel 2025 & 2033
- Figure 23: South America USA Sports Luggage Industry Revenue (billion), by Country 2025 & 2033
- Figure 24: South America USA Sports Luggage Industry Volume (K Units), by Country 2025 & 2033
- Figure 25: South America USA Sports Luggage Industry Revenue Share (%), by Country 2025 & 2033
- Figure 26: South America USA Sports Luggage Industry Volume Share (%), by Country 2025 & 2033
- Figure 27: Europe USA Sports Luggage Industry Revenue (billion), by Sports Type 2025 & 2033
- Figure 28: Europe USA Sports Luggage Industry Volume (K Units), by Sports Type 2025 & 2033
- Figure 29: Europe USA Sports Luggage Industry Revenue Share (%), by Sports Type 2025 & 2033
- Figure 30: Europe USA Sports Luggage Industry Volume Share (%), by Sports Type 2025 & 2033
- Figure 31: Europe USA Sports Luggage Industry Revenue (billion), by Distribution Channel 2025 & 2033
- Figure 32: Europe USA Sports Luggage Industry Volume (K Units), by Distribution Channel 2025 & 2033
- Figure 33: Europe USA Sports Luggage Industry Revenue Share (%), by Distribution Channel 2025 & 2033
- Figure 34: Europe USA Sports Luggage Industry Volume Share (%), by Distribution Channel 2025 & 2033
- Figure 35: Europe USA Sports Luggage Industry Revenue (billion), by Country 2025 & 2033
- Figure 36: Europe USA Sports Luggage Industry Volume (K Units), by Country 2025 & 2033
- Figure 37: Europe USA Sports Luggage Industry Revenue Share (%), by Country 2025 & 2033
- Figure 38: Europe USA Sports Luggage Industry Volume Share (%), by Country 2025 & 2033
- Figure 39: Middle East & Africa USA Sports Luggage Industry Revenue (billion), by Sports Type 2025 & 2033
- Figure 40: Middle East & Africa USA Sports Luggage Industry Volume (K Units), by Sports Type 2025 & 2033
- Figure 41: Middle East & Africa USA Sports Luggage Industry Revenue Share (%), by Sports Type 2025 & 2033
- Figure 42: Middle East & Africa USA Sports Luggage Industry Volume Share (%), by Sports Type 2025 & 2033
- Figure 43: Middle East & Africa USA Sports Luggage Industry Revenue (billion), by Distribution Channel 2025 & 2033
- Figure 44: Middle East & Africa USA Sports Luggage Industry Volume (K Units), by Distribution Channel 2025 & 2033
- Figure 45: Middle East & Africa USA Sports Luggage Industry Revenue Share (%), by Distribution Channel 2025 & 2033
- Figure 46: Middle East & Africa USA Sports Luggage Industry Volume Share (%), by Distribution Channel 2025 & 2033
- Figure 47: Middle East & Africa USA Sports Luggage Industry Revenue (billion), by Country 2025 & 2033
- Figure 48: Middle East & Africa USA Sports Luggage Industry Volume (K Units), by Country 2025 & 2033
- Figure 49: Middle East & Africa USA Sports Luggage Industry Revenue Share (%), by Country 2025 & 2033
- Figure 50: Middle East & Africa USA Sports Luggage Industry Volume Share (%), by Country 2025 & 2033
- Figure 51: Asia Pacific USA Sports Luggage Industry Revenue (billion), by Sports Type 2025 & 2033
- Figure 52: Asia Pacific USA Sports Luggage Industry Volume (K Units), by Sports Type 2025 & 2033
- Figure 53: Asia Pacific USA Sports Luggage Industry Revenue Share (%), by Sports Type 2025 & 2033
- Figure 54: Asia Pacific USA Sports Luggage Industry Volume Share (%), by Sports Type 2025 & 2033
- Figure 55: Asia Pacific USA Sports Luggage Industry Revenue (billion), by Distribution Channel 2025 & 2033
- Figure 56: Asia Pacific USA Sports Luggage Industry Volume (K Units), by Distribution Channel 2025 & 2033
- Figure 57: Asia Pacific USA Sports Luggage Industry Revenue Share (%), by Distribution Channel 2025 & 2033
- Figure 58: Asia Pacific USA Sports Luggage Industry Volume Share (%), by Distribution Channel 2025 & 2033
- Figure 59: Asia Pacific USA Sports Luggage Industry Revenue (billion), by Country 2025 & 2033
- Figure 60: Asia Pacific USA Sports Luggage Industry Volume (K Units), by Country 2025 & 2033
- Figure 61: Asia Pacific USA Sports Luggage Industry Revenue Share (%), by Country 2025 & 2033
- Figure 62: Asia Pacific USA Sports Luggage Industry Volume Share (%), by Country 2025 & 2033
List of Tables
- Table 1: Global USA Sports Luggage Industry Revenue billion Forecast, by Sports Type 2020 & 2033
- Table 2: Global USA Sports Luggage Industry Volume K Units Forecast, by Sports Type 2020 & 2033
- Table 3: Global USA Sports Luggage Industry Revenue billion Forecast, by Distribution Channel 2020 & 2033
- Table 4: Global USA Sports Luggage Industry Volume K Units Forecast, by Distribution Channel 2020 & 2033
- Table 5: Global USA Sports Luggage Industry Revenue billion Forecast, by Region 2020 & 2033
- Table 6: Global USA Sports Luggage Industry Volume K Units Forecast, by Region 2020 & 2033
- Table 7: Global USA Sports Luggage Industry Revenue billion Forecast, by Sports Type 2020 & 2033
- Table 8: Global USA Sports Luggage Industry Volume K Units Forecast, by Sports Type 2020 & 2033
- Table 9: Global USA Sports Luggage Industry Revenue billion Forecast, by Distribution Channel 2020 & 2033
- Table 10: Global USA Sports Luggage Industry Volume K Units Forecast, by Distribution Channel 2020 & 2033
- Table 11: Global USA Sports Luggage Industry Revenue billion Forecast, by Country 2020 & 2033
- Table 12: Global USA Sports Luggage Industry Volume K Units Forecast, by Country 2020 & 2033
- Table 13: United States USA Sports Luggage Industry Revenue (billion) Forecast, by Application 2020 & 2033
- Table 14: United States USA Sports Luggage Industry Volume (K Units) Forecast, by Application 2020 & 2033
- Table 15: Canada USA Sports Luggage Industry Revenue (billion) Forecast, by Application 2020 & 2033
- Table 16: Canada USA Sports Luggage Industry Volume (K Units) Forecast, by Application 2020 & 2033
- Table 17: Mexico USA Sports Luggage Industry Revenue (billion) Forecast, by Application 2020 & 2033
- Table 18: Mexico USA Sports Luggage Industry Volume (K Units) Forecast, by Application 2020 & 2033
- Table 19: Global USA Sports Luggage Industry Revenue billion Forecast, by Sports Type 2020 & 2033
- Table 20: Global USA Sports Luggage Industry Volume K Units Forecast, by Sports Type 2020 & 2033
- Table 21: Global USA Sports Luggage Industry Revenue billion Forecast, by Distribution Channel 2020 & 2033
- Table 22: Global USA Sports Luggage Industry Volume K Units Forecast, by Distribution Channel 2020 & 2033
- Table 23: Global USA Sports Luggage Industry Revenue billion Forecast, by Country 2020 & 2033
- Table 24: Global USA Sports Luggage Industry Volume K Units Forecast, by Country 2020 & 2033
- Table 25: Brazil USA Sports Luggage Industry Revenue (billion) Forecast, by Application 2020 & 2033
- Table 26: Brazil USA Sports Luggage Industry Volume (K Units) Forecast, by Application 2020 & 2033
- Table 27: Argentina USA Sports Luggage Industry Revenue (billion) Forecast, by Application 2020 & 2033
- Table 28: Argentina USA Sports Luggage Industry Volume (K Units) Forecast, by Application 2020 & 2033
- Table 29: Rest of South America USA Sports Luggage Industry Revenue (billion) Forecast, by Application 2020 & 2033
- Table 30: Rest of South America USA Sports Luggage Industry Volume (K Units) Forecast, by Application 2020 & 2033
- Table 31: Global USA Sports Luggage Industry Revenue billion Forecast, by Sports Type 2020 & 2033
- Table 32: Global USA Sports Luggage Industry Volume K Units Forecast, by Sports Type 2020 & 2033
- Table 33: Global USA Sports Luggage Industry Revenue billion Forecast, by Distribution Channel 2020 & 2033
- Table 34: Global USA Sports Luggage Industry Volume K Units Forecast, by Distribution Channel 2020 & 2033
- Table 35: Global USA Sports Luggage Industry Revenue billion Forecast, by Country 2020 & 2033
- Table 36: Global USA Sports Luggage Industry Volume K Units Forecast, by Country 2020 & 2033
- Table 37: United Kingdom USA Sports Luggage Industry Revenue (billion) Forecast, by Application 2020 & 2033
- Table 38: United Kingdom USA Sports Luggage Industry Volume (K Units) Forecast, by Application 2020 & 2033
- Table 39: Germany USA Sports Luggage Industry Revenue (billion) Forecast, by Application 2020 & 2033
- Table 40: Germany USA Sports Luggage Industry Volume (K Units) Forecast, by Application 2020 & 2033
- Table 41: France USA Sports Luggage Industry Revenue (billion) Forecast, by Application 2020 & 2033
- Table 42: France USA Sports Luggage Industry Volume (K Units) Forecast, by Application 2020 & 2033
- Table 43: Italy USA Sports Luggage Industry Revenue (billion) Forecast, by Application 2020 & 2033
- Table 44: Italy USA Sports Luggage Industry Volume (K Units) Forecast, by Application 2020 & 2033
- Table 45: Spain USA Sports Luggage Industry Revenue (billion) Forecast, by Application 2020 & 2033
- Table 46: Spain USA Sports Luggage Industry Volume (K Units) Forecast, by Application 2020 & 2033
- Table 47: Russia USA Sports Luggage Industry Revenue (billion) Forecast, by Application 2020 & 2033
- Table 48: Russia USA Sports Luggage Industry Volume (K Units) Forecast, by Application 2020 & 2033
- Table 49: Benelux USA Sports Luggage Industry Revenue (billion) Forecast, by Application 2020 & 2033
- Table 50: Benelux USA Sports Luggage Industry Volume (K Units) Forecast, by Application 2020 & 2033
- Table 51: Nordics USA Sports Luggage Industry Revenue (billion) Forecast, by Application 2020 & 2033
- Table 52: Nordics USA Sports Luggage Industry Volume (K Units) Forecast, by Application 2020 & 2033
- Table 53: Rest of Europe USA Sports Luggage Industry Revenue (billion) Forecast, by Application 2020 & 2033
- Table 54: Rest of Europe USA Sports Luggage Industry Volume (K Units) Forecast, by Application 2020 & 2033
- Table 55: Global USA Sports Luggage Industry Revenue billion Forecast, by Sports Type 2020 & 2033
- Table 56: Global USA Sports Luggage Industry Volume K Units Forecast, by Sports Type 2020 & 2033
- Table 57: Global USA Sports Luggage Industry Revenue billion Forecast, by Distribution Channel 2020 & 2033
- Table 58: Global USA Sports Luggage Industry Volume K Units Forecast, by Distribution Channel 2020 & 2033
- Table 59: Global USA Sports Luggage Industry Revenue billion Forecast, by Country 2020 & 2033
- Table 60: Global USA Sports Luggage Industry Volume K Units Forecast, by Country 2020 & 2033
- Table 61: Turkey USA Sports Luggage Industry Revenue (billion) Forecast, by Application 2020 & 2033
- Table 62: Turkey USA Sports Luggage Industry Volume (K Units) Forecast, by Application 2020 & 2033
- Table 63: Israel USA Sports Luggage Industry Revenue (billion) Forecast, by Application 2020 & 2033
- Table 64: Israel USA Sports Luggage Industry Volume (K Units) Forecast, by Application 2020 & 2033
- Table 65: GCC USA Sports Luggage Industry Revenue (billion) Forecast, by Application 2020 & 2033
- Table 66: GCC USA Sports Luggage Industry Volume (K Units) Forecast, by Application 2020 & 2033
- Table 67: North Africa USA Sports Luggage Industry Revenue (billion) Forecast, by Application 2020 & 2033
- Table 68: North Africa USA Sports Luggage Industry Volume (K Units) Forecast, by Application 2020 & 2033
- Table 69: South Africa USA Sports Luggage Industry Revenue (billion) Forecast, by Application 2020 & 2033
- Table 70: South Africa USA Sports Luggage Industry Volume (K Units) Forecast, by Application 2020 & 2033
- Table 71: Rest of Middle East & Africa USA Sports Luggage Industry Revenue (billion) Forecast, by Application 2020 & 2033
- Table 72: Rest of Middle East & Africa USA Sports Luggage Industry Volume (K Units) Forecast, by Application 2020 & 2033
- Table 73: Global USA Sports Luggage Industry Revenue billion Forecast, by Sports Type 2020 & 2033
- Table 74: Global USA Sports Luggage Industry Volume K Units Forecast, by Sports Type 2020 & 2033
- Table 75: Global USA Sports Luggage Industry Revenue billion Forecast, by Distribution Channel 2020 & 2033
- Table 76: Global USA Sports Luggage Industry Volume K Units Forecast, by Distribution Channel 2020 & 2033
- Table 77: Global USA Sports Luggage Industry Revenue billion Forecast, by Country 2020 & 2033
- Table 78: Global USA Sports Luggage Industry Volume K Units Forecast, by Country 2020 & 2033
- Table 79: China USA Sports Luggage Industry Revenue (billion) Forecast, by Application 2020 & 2033
- Table 80: China USA Sports Luggage Industry Volume (K Units) Forecast, by Application 2020 & 2033
- Table 81: India USA Sports Luggage Industry Revenue (billion) Forecast, by Application 2020 & 2033
- Table 82: India USA Sports Luggage Industry Volume (K Units) Forecast, by Application 2020 & 2033
- Table 83: Japan USA Sports Luggage Industry Revenue (billion) Forecast, by Application 2020 & 2033
- Table 84: Japan USA Sports Luggage Industry Volume (K Units) Forecast, by Application 2020 & 2033
- Table 85: South Korea USA Sports Luggage Industry Revenue (billion) Forecast, by Application 2020 & 2033
- Table 86: South Korea USA Sports Luggage Industry Volume (K Units) Forecast, by Application 2020 & 2033
- Table 87: ASEAN USA Sports Luggage Industry Revenue (billion) Forecast, by Application 2020 & 2033
- Table 88: ASEAN USA Sports Luggage Industry Volume (K Units) Forecast, by Application 2020 & 2033
- Table 89: Oceania USA Sports Luggage Industry Revenue (billion) Forecast, by Application 2020 & 2033
- Table 90: Oceania USA Sports Luggage Industry Volume (K Units) Forecast, by Application 2020 & 2033
- Table 91: Rest of Asia Pacific USA Sports Luggage Industry Revenue (billion) Forecast, by Application 2020 & 2033
- Table 92: Rest of Asia Pacific USA Sports Luggage Industry Volume (K Units) Forecast, by Application 2020 & 2033
Frequently Asked Questions
1. What is the projected Compound Annual Growth Rate (CAGR) of the USA Sports Luggage Industry?
The projected CAGR is approximately 8.08%.
2. Which companies are prominent players in the USA Sports Luggage Industry?
Key companies in the market include Adidas AG, Franklin Group, Rawlings Sporting Goods Company Inc, Puma SE, Sport Maska Inc (CCM)*List Not Exhaustive, Under Armour Inc, Nike Inc, Select Sport AS.
3. What are the main segments of the USA Sports Luggage Industry?
The market segments include Sports Type, Distribution Channel.
4. Can you provide details about the market size?
The market size is estimated to be USD 8.48 billion as of 2022.
5. What are some drivers contributing to market growth?
Surging Demand for Athleisure Footwear; Aggressive Marketing by Brands.
6. What are the notable trends driving market growth?
Growing Influence of Athleisure and Health Wellness Trends.
7. Are there any restraints impacting market growth?
Extensive Availability of Counterfeit Products.
8. Can you provide examples of recent developments in the market?
N/A
9. What pricing options are available for accessing the report?
Pricing options include single-user, multi-user, and enterprise licenses priced at USD 3800, USD 4500, and USD 5800 respectively.
10. Is the market size provided in terms of value or volume?
The market size is provided in terms of value, measured in billion and volume, measured in K Units.
11. Are there any specific market keywords associated with the report?
Yes, the market keyword associated with the report is "USA Sports Luggage Industry," which aids in identifying and referencing the specific market segment covered.
12. How do I determine which pricing option suits my needs best?
The pricing options vary based on user requirements and access needs. Individual users may opt for single-user licenses, while businesses requiring broader access may choose multi-user or enterprise licenses for cost-effective access to the report.
13. Are there any additional resources or data provided in the USA Sports Luggage Industry report?
While the report offers comprehensive insights, it's advisable to review the specific contents or supplementary materials provided to ascertain if additional resources or data are available.
14. How can I stay updated on further developments or reports in the USA Sports Luggage Industry?
To stay informed about further developments, trends, and reports in the USA Sports Luggage Industry, consider subscribing to industry newsletters, following relevant companies and organizations, or regularly checking reputable industry news sources and publications.
Methodology
Step 1 - Identification of Relevant Samples Size from Population Database


Step 2 - Approaches for Defining Global Market Size (Value, Volume* & Price*)

Note*: In applicable scenarios
Step 3 - Data Sources
Primary Research
- Web Analytics
- Survey Reports
- Research Institute
- Latest Research Reports
- Opinion Leaders
Secondary Research
- Annual Reports
- White Paper
- Latest Press Release
- Industry Association
- Paid Database
- Investor Presentations

Step 4 - Data Triangulation
Involves using different sources of information in order to increase the validity of a study
These sources are likely to be stakeholders in a program - participants, other researchers, program staff, other community members, and so on.
Then we put all data in single framework & apply various statistical tools to find out the dynamic on the market.
During the analysis stage, feedback from the stakeholder groups would be compared to determine areas of agreement as well as areas of divergence