

Key Insights
The global used smartphone market, projected at $42.33 billion in 2025, is set for substantial expansion with a compound annual growth rate (CAGR) of 22.6% from 2025 to 2033. This growth is fueled by increasing environmental consciousness among consumers and the demand for more affordable mobile devices. The convenience and accessibility of purchasing refurbished and pre-owned smartphones through leading e-commerce platforms and reputable retailers are significant market drivers. Advances in refurbishment technology enhance the quality and lifespan of used devices, fostering greater consumer confidence. The market is segmented by price, with the $200-$500 range anticipated to capture the largest share due to its optimal balance of cost and performance. Android devices maintain dominance in the operating system segment, largely due to the availability of a wider selection of budget-friendly used options. Geographically, North America and the Asia-Pacific region, particularly China and India, are key markets, driven by high smartphone penetration and large consumer bases. Persistent challenges, such as concerns regarding battery life and potential software vulnerabilities in older models, are being actively addressed through improved refurbishment standards and warranty programs.
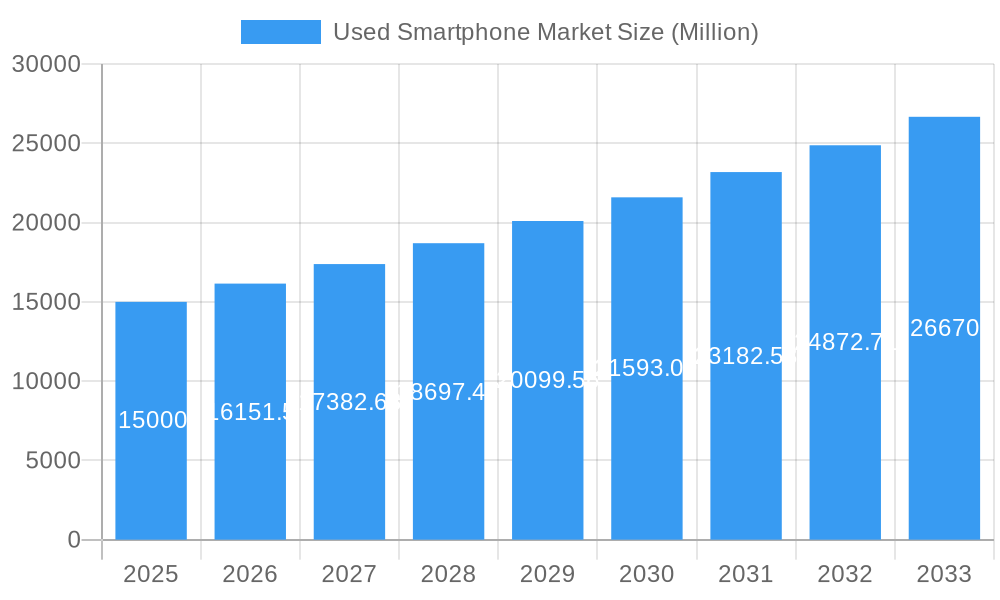
Used Smartphone Market Market Size (In Billion)
The competitive arena features major technology companies like Apple and Samsung alongside specialized refurbished device retailers such as Back Market. Key competitive factors include pricing, warranty provisions, and the quality of refurbishment services. Future market growth depends on effectively mitigating consumer concerns about device reliability and security through stringent quality control and transparent refurbishment processes. Continuous innovation in refurbishment technologies and enhanced customer support are crucial for sustained market expansion. Emerging markets present significant growth opportunities due to increasing smartphone adoption. The used smartphone sector is poised for considerable growth over the next decade, reflecting a global trend towards sustainable and economical consumer purchasing decisions.
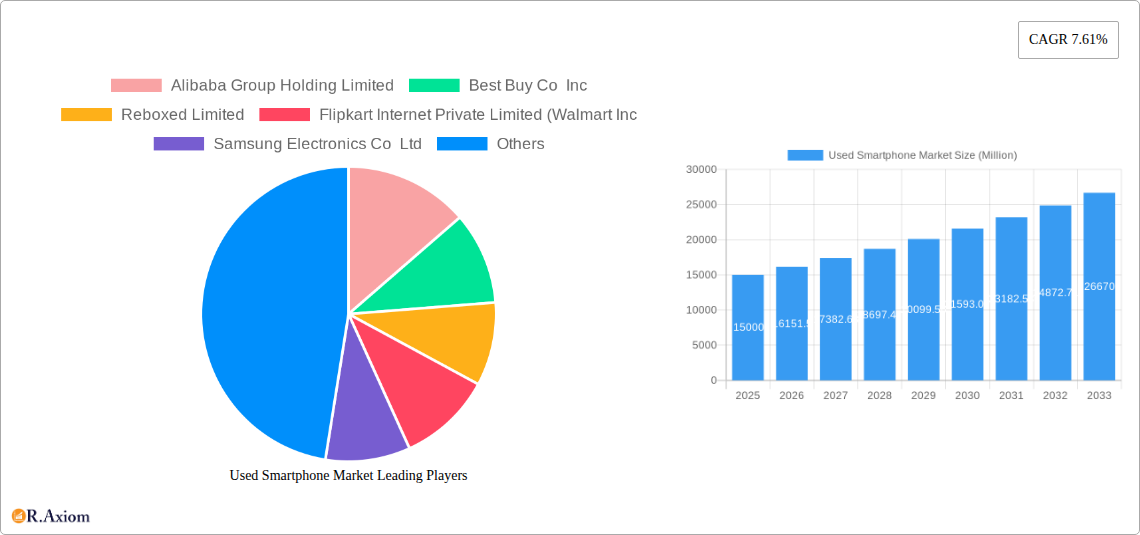
Used Smartphone Market Company Market Share
This report offers a detailed analysis of the global used smartphone market, providing critical insights for stakeholders, investors, and businesses. The analysis spans the period from 2019 to 2033, with a specific focus on the 2025-2033 forecast. Key market segments examined include device condition (Refurbished, Used-Like New, Used-Good), sales channel (Online, Offline), price tiers (Below $200, $200-$500, Above $500), and operating system (Android, iOS). Prominent market players, including Alibaba Group Holding Limited, Best Buy Co. Inc., and Apple Inc., are profiled to provide a comprehensive understanding of the competitive landscape.
Used Smartphone Market Market Concentration & Innovation
The used smartphone market exhibits a moderately concentrated landscape, with a few major players commanding significant market share. However, the market is also characterized by a high degree of innovation, driven by advancements in refurbishment technologies, improved quality control processes, and the increasing popularity of sustainable consumption. The market share of the top 5 players is estimated at xx% in 2025, with Alibaba Group Holding Limited holding the largest share at approximately xx%. Regulatory frameworks concerning data security and e-waste management significantly influence market dynamics, shaping both opportunities and challenges. The rise of certified refurbished smartphones addresses consumer concerns, while increasing competition fosters innovation in areas such as extended warranties and value-added services. M&A activity is significant, with recent deals like REFURBED’s Series C funding round exceeding USD 57 Million, indicating investor confidence in the sector's growth potential. These deals drive consolidation and the expansion of market players.
Used Smartphone Market Industry Trends & Insights
The used smartphone market is experiencing robust growth, projected to achieve a CAGR of xx% during the forecast period (2025-2033). Several factors contribute to this growth, including increasing consumer preference for budget-friendly options, rising environmental awareness promoting the circular economy, and the rapid technological advancements that render previously top-of-the-line smartphones more affordable in the used market. Market penetration of used smartphones is estimated at xx% in 2025, with significant potential for further expansion. Technological disruptions, such as the introduction of faster and more efficient refurbishment processes, are further accelerating market growth. Consumer preferences are shifting towards premium used smartphones, driving up average selling prices. Competitive dynamics are characterized by both intense competition among established players and the emergence of new entrants, leading to innovation in pricing strategies, warranties, and value-added services.
Dominant Markets & Segments in Used Smartphone Market
- Leading Region/Country: The North American and Asian markets currently dominate, with xx Million units sold in 2025. Key drivers include high smartphone penetration, strong e-commerce infrastructure, and growing environmental awareness.
- Condition: The 'Refurbished' segment holds the largest market share due to its balance of affordability and quality assurance. 'Used-like New' follows, catering to consumers seeking near-mint condition devices.
- Channel: Online channels account for the majority of sales, driven by e-commerce platforms’ convenience and reach.
- Price Range: The $200-$500 price bracket boasts the highest volume of sales, appealing to a wide range of budget-conscious consumers.
- Operating System: Android remains the dominant operating system, benefiting from its wider device range in the used market.
The dominance of these segments stems from a confluence of factors including consumer affordability, technological maturity, and established distribution networks. Government policies promoting sustainable consumption further bolster the growth of used smartphone segments.
Used Smartphone Market Product Developments
Technological advancements are continually improving the quality and reliability of refurbished smartphones. Innovations include enhanced diagnostics and repair processes, leading to higher quality control and extended warranties. This is boosting consumer trust and driving market growth. The expansion of certified refurbishment programs and warranties are key competitive advantages, mitigating consumer risks associated with purchasing used smartphones.
Report Scope & Segmentation Analysis
This report analyzes the used smartphone market across various segments:
- Condition: Refurbished, Used-like New, Used-Good (Growth projections and market sizes for each are detailed within the full report).
- Channel: Online, Offline (Market share and competitive landscape analysis are provided for each).
- Price Range: Below $200, $200-$500, Above $500 (Detailed sales volume and pricing dynamics for each are included).
- Operating System: Android, iOS (Market share and future growth forecasts are elaborated for each OS).
Key Drivers of Used Smartphone Market Growth
Several factors fuel the used smartphone market’s growth. Economical pricing offers access to smartphones for price-sensitive consumers. Growing environmental awareness promotes sustainable consumption choices. Technological advancements refine the refurbishment process, improving quality and reliability. Furthermore, supportive government policies encourage the circular economy and responsible e-waste management, further driving the market's expansion.
Challenges in the Used Smartphone Market Sector
Challenges include concerns regarding data security and device authenticity, demanding stringent quality control and data erasure processes. Supply chain disruptions can impact the availability of parts and devices, affecting refurbishment operations. Intense competition and price pressure require efficient operations and innovative strategies to maintain profitability. Regulatory hurdles related to e-waste management and data privacy also pose significant challenges, requiring compliance and adaptability.
Emerging Opportunities in Used Smartphone Market
Expanding into emerging markets with growing smartphone penetration presents significant opportunities. The development of innovative refurbishment technologies and extended warranty programs can enhance customer trust and drive market growth. Leveraging the circular economy principles can attract environmentally conscious consumers and unlock new market segments.
Leading Players in the Used Smartphone Market Market
- Alibaba Group Holding Limited
- Best Buy Co Inc
- Reboxed Limited
- Flipkart Internet Private Limited (Walmart Inc)
- Samsung Electronics Co Ltd
- Verizon Communications Inc
- FoneGiant
- Paytm (One97 Communications Limited)
- Amazon com Inc
- Nippon Telephone Inc
- Back Market
- AT&T Inc
- Apple Inc
Key Developments in Used Smartphone Market Industry
- September 2023: REFURBED secures USD 57 Million in Series C funding, highlighting investor confidence in the sustainable tech market.
- December 2023: ControlZ plans a USD 2 Million investment in its Gurugram repair facility, aiming to significantly expand its refurbishment capacity.
Strategic Outlook for Used Smartphone Market Market
The used smartphone market is poised for continued expansion, driven by increasing consumer demand for affordable devices, growing environmental consciousness, and ongoing technological advancements in refurbishment techniques. Strategic partnerships and investments in technology and logistics will be crucial for companies to succeed in this dynamic market. The market exhibits significant potential for growth across various segments, presenting lucrative opportunities for established players and new entrants alike.
Used Smartphone Market Segmentation
- 1. Production Analysis
- 2. Consumption Analysis
- 3. Import Market Analysis (Value & Volume)
- 4. Export Market Analysis (Value & Volume)
- 5. Price Trend Analysis
Used Smartphone Market Segmentation By Geography
- 1. North America
- 2. Europe
- 3. Asia Pacific
- 4. Rest of the World
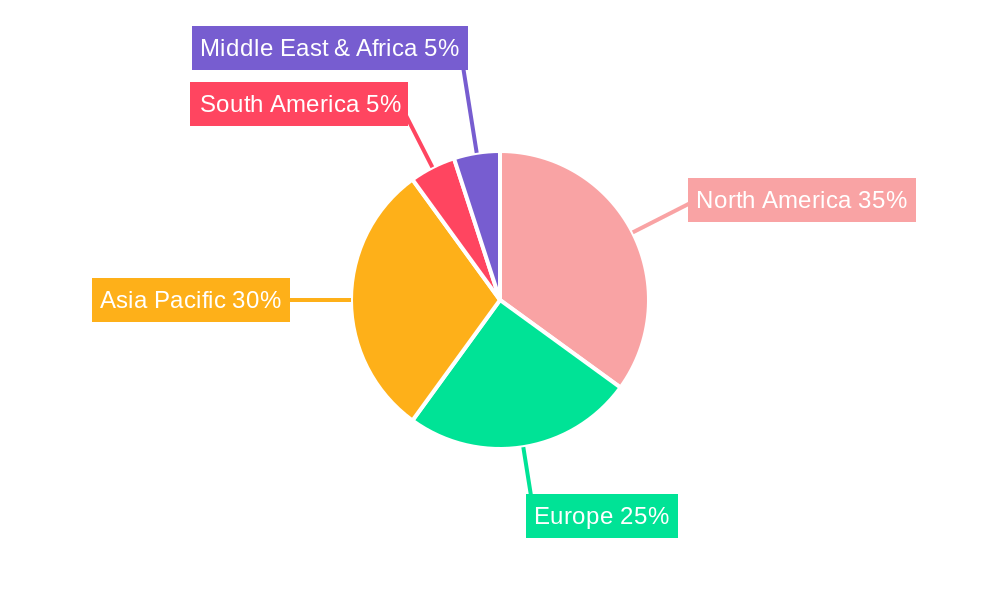
Used Smartphone Market Regional Market Share
Geographic Coverage of Used Smartphone Market
Used Smartphone Market REPORT HIGHLIGHTS
| Aspects | Details |
|---|---|
| Study Period | 2020-2034 |
| Base Year | 2025 |
| Estimated Year | 2026 |
| Forecast Period | 2026-2034 |
| Historical Period | 2020-2025 |
| Growth Rate | CAGR of 22.6% from 2020-2034 |
| Segmentation |
|
Table of Contents
- 1. Introduction
- 1.1. Research Scope
- 1.2. Market Segmentation
- 1.3. Research Objective
- 1.4. Definitions and Assumptions
- 2. Executive Summary
- 2.1. Market Snapshot
- 3. Market Dynamics
- 3.1. Market Drivers
- 3.2. Market Restrains
- 3.3. Market Trends
- 3.4. Market Opportunities
- 4. Market Factor Analysis
- 4.1. Porters Five Forces
- 4.1.1. Bargaining Power of Suppliers
- 4.1.2. Bargaining Power of Buyers
- 4.1.3. Threat of New Entrants
- 4.1.4. Threat of Substitutes
- 4.1.5. Competitive Rivalry
- 4.2. PESTEL analysis
- 4.3. BCG Analysis
- 4.3.1. Stars (High Growth, High Market Share)
- 4.3.2. Cash Cows (Low Growth, High Market Share)
- 4.3.3. Question Mark (High Growth, Low Market Share)
- 4.3.4. Dogs (Low Growth, Low Market Share)
- 4.4. Ansoff Matrix Analysis
- 4.5. Supply Chain Analysis
- 4.6. Regulatory Landscape
- 4.7. Current Market Potential and Opportunity Assessment (TAM–SAM–SOM Framework)
- 4.8. RAX Analyst Note
- 4.1. Porters Five Forces
- 5. Market Analysis, Insights and Forecast 2021-2033
- 5.1. Market Analysis, Insights and Forecast - by Production Analysis
- 5.2. Market Analysis, Insights and Forecast - by Consumption Analysis
- 5.3. Market Analysis, Insights and Forecast - by Import Market Analysis (Value & Volume)
- 5.4. Market Analysis, Insights and Forecast - by Export Market Analysis (Value & Volume)
- 5.5. Market Analysis, Insights and Forecast - by Price Trend Analysis
- 5.6. Market Analysis, Insights and Forecast - by Region
- 5.6.1. North America
- 5.6.2. Europe
- 5.6.3. Asia Pacific
- 5.6.4. Rest of the World
- 6. Global Used Smartphone Market Analysis, Insights and Forecast, 2021-2033
- 6.1. Market Analysis, Insights and Forecast - by Production Analysis
- 6.2. Market Analysis, Insights and Forecast - by Consumption Analysis
- 6.3. Market Analysis, Insights and Forecast - by Import Market Analysis (Value & Volume)
- 6.4. Market Analysis, Insights and Forecast - by Export Market Analysis (Value & Volume)
- 6.5. Market Analysis, Insights and Forecast - by Price Trend Analysis
- 7. North America Used Smartphone Market Analysis, Insights and Forecast, 2020-2032
- 7.1. Market Analysis, Insights and Forecast - by Production Analysis
- 7.2. Market Analysis, Insights and Forecast - by Consumption Analysis
- 7.3. Market Analysis, Insights and Forecast - by Import Market Analysis (Value & Volume)
- 7.4. Market Analysis, Insights and Forecast - by Export Market Analysis (Value & Volume)
- 7.5. Market Analysis, Insights and Forecast - by Price Trend Analysis
- 8. Europe Used Smartphone Market Analysis, Insights and Forecast, 2020-2032
- 8.1. Market Analysis, Insights and Forecast - by Production Analysis
- 8.2. Market Analysis, Insights and Forecast - by Consumption Analysis
- 8.3. Market Analysis, Insights and Forecast - by Import Market Analysis (Value & Volume)
- 8.4. Market Analysis, Insights and Forecast - by Export Market Analysis (Value & Volume)
- 8.5. Market Analysis, Insights and Forecast - by Price Trend Analysis
- 9. Asia Pacific Used Smartphone Market Analysis, Insights and Forecast, 2020-2032
- 9.1. Market Analysis, Insights and Forecast - by Production Analysis
- 9.2. Market Analysis, Insights and Forecast - by Consumption Analysis
- 9.3. Market Analysis, Insights and Forecast - by Import Market Analysis (Value & Volume)
- 9.4. Market Analysis, Insights and Forecast - by Export Market Analysis (Value & Volume)
- 9.5. Market Analysis, Insights and Forecast - by Price Trend Analysis
- 10. Rest of the World Used Smartphone Market Analysis, Insights and Forecast, 2020-2032
- 10.1. Market Analysis, Insights and Forecast - by Production Analysis
- 10.2. Market Analysis, Insights and Forecast - by Consumption Analysis
- 10.3. Market Analysis, Insights and Forecast - by Import Market Analysis (Value & Volume)
- 10.4. Market Analysis, Insights and Forecast - by Export Market Analysis (Value & Volume)
- 10.5. Market Analysis, Insights and Forecast - by Price Trend Analysis
- 11. Competitive Analysis
- 11.1. Company Profiles
- 11.1.1 Alibaba Group Holding Limited
- 11.1.1.1. Company Overview
- 11.1.1.2. Products
- 11.1.1.3. Company Financials
- 11.1.1.4. SWOT Analysis
- 11.1.2 Best Buy Co Inc
- 11.1.2.1. Company Overview
- 11.1.2.2. Products
- 11.1.2.3. Company Financials
- 11.1.2.4. SWOT Analysis
- 11.1.3 Reboxed Limited
- 11.1.3.1. Company Overview
- 11.1.3.2. Products
- 11.1.3.3. Company Financials
- 11.1.3.4. SWOT Analysis
- 11.1.4 Flipkart Internet Private Limited (Walmart Inc
- 11.1.4.1. Company Overview
- 11.1.4.2. Products
- 11.1.4.3. Company Financials
- 11.1.4.4. SWOT Analysis
- 11.1.5 Samsung Electronics Co Ltd
- 11.1.5.1. Company Overview
- 11.1.5.2. Products
- 11.1.5.3. Company Financials
- 11.1.5.4. SWOT Analysis
- 11.1.6 Verizon Communications Inc
- 11.1.6.1. Company Overview
- 11.1.6.2. Products
- 11.1.6.3. Company Financials
- 11.1.6.4. SWOT Analysis
- 11.1.7 FoneGiant
- 11.1.7.1. Company Overview
- 11.1.7.2. Products
- 11.1.7.3. Company Financials
- 11.1.7.4. SWOT Analysis
- 11.1.8 Paytm (One97 Communications Limited)
- 11.1.8.1. Company Overview
- 11.1.8.2. Products
- 11.1.8.3. Company Financials
- 11.1.8.4. SWOT Analysis
- 11.1.9 Amazon com Inc
- 11.1.9.1. Company Overview
- 11.1.9.2. Products
- 11.1.9.3. Company Financials
- 11.1.9.4. SWOT Analysis
- 11.1.10 Nippon Telephone Inc
- 11.1.10.1. Company Overview
- 11.1.10.2. Products
- 11.1.10.3. Company Financials
- 11.1.10.4. SWOT Analysis
- 11.1.11 Back Market
- 11.1.11.1. Company Overview
- 11.1.11.2. Products
- 11.1.11.3. Company Financials
- 11.1.11.4. SWOT Analysis
- 11.1.12 AT&T Inc
- 11.1.12.1. Company Overview
- 11.1.12.2. Products
- 11.1.12.3. Company Financials
- 11.1.12.4. SWOT Analysis
- 11.1.13 Apple Inc
- 11.1.13.1. Company Overview
- 11.1.13.2. Products
- 11.1.13.3. Company Financials
- 11.1.13.4. SWOT Analysis
- 11.1.1 Alibaba Group Holding Limited
- 11.2. Market Entropy
- 11.2.1 Company's Key Areas Served
- 11.2.2 Recent Developments
- 11.3. Company Market Share Analysis 2025
- 11.3.1 Top 5 Companies Market Share Analysis
- 11.3.2 Top 3 Companies Market Share Analysis
- 11.4. List of Potential Customers
- 12. Research Methodology
List of Figures
- Figure 1: Global Used Smartphone Market Revenue Breakdown (billion, %) by Region 2025 & 2033
- Figure 2: Global Used Smartphone Market Volume Breakdown (Million, %) by Region 2025 & 2033
- Figure 3: North America Used Smartphone Market Revenue (billion), by Production Analysis 2025 & 2033
- Figure 4: North America Used Smartphone Market Volume (Million), by Production Analysis 2025 & 2033
- Figure 5: North America Used Smartphone Market Revenue Share (%), by Production Analysis 2025 & 2033
- Figure 6: North America Used Smartphone Market Volume Share (%), by Production Analysis 2025 & 2033
- Figure 7: North America Used Smartphone Market Revenue (billion), by Consumption Analysis 2025 & 2033
- Figure 8: North America Used Smartphone Market Volume (Million), by Consumption Analysis 2025 & 2033
- Figure 9: North America Used Smartphone Market Revenue Share (%), by Consumption Analysis 2025 & 2033
- Figure 10: North America Used Smartphone Market Volume Share (%), by Consumption Analysis 2025 & 2033
- Figure 11: North America Used Smartphone Market Revenue (billion), by Import Market Analysis (Value & Volume) 2025 & 2033
- Figure 12: North America Used Smartphone Market Volume (Million), by Import Market Analysis (Value & Volume) 2025 & 2033
- Figure 13: North America Used Smartphone Market Revenue Share (%), by Import Market Analysis (Value & Volume) 2025 & 2033
- Figure 14: North America Used Smartphone Market Volume Share (%), by Import Market Analysis (Value & Volume) 2025 & 2033
- Figure 15: North America Used Smartphone Market Revenue (billion), by Export Market Analysis (Value & Volume) 2025 & 2033
- Figure 16: North America Used Smartphone Market Volume (Million), by Export Market Analysis (Value & Volume) 2025 & 2033
- Figure 17: North America Used Smartphone Market Revenue Share (%), by Export Market Analysis (Value & Volume) 2025 & 2033
- Figure 18: North America Used Smartphone Market Volume Share (%), by Export Market Analysis (Value & Volume) 2025 & 2033
- Figure 19: North America Used Smartphone Market Revenue (billion), by Price Trend Analysis 2025 & 2033
- Figure 20: North America Used Smartphone Market Volume (Million), by Price Trend Analysis 2025 & 2033
- Figure 21: North America Used Smartphone Market Revenue Share (%), by Price Trend Analysis 2025 & 2033
- Figure 22: North America Used Smartphone Market Volume Share (%), by Price Trend Analysis 2025 & 2033
- Figure 23: North America Used Smartphone Market Revenue (billion), by Country 2025 & 2033
- Figure 24: North America Used Smartphone Market Volume (Million), by Country 2025 & 2033
- Figure 25: North America Used Smartphone Market Revenue Share (%), by Country 2025 & 2033
- Figure 26: North America Used Smartphone Market Volume Share (%), by Country 2025 & 2033
- Figure 27: Europe Used Smartphone Market Revenue (billion), by Production Analysis 2025 & 2033
- Figure 28: Europe Used Smartphone Market Volume (Million), by Production Analysis 2025 & 2033
- Figure 29: Europe Used Smartphone Market Revenue Share (%), by Production Analysis 2025 & 2033
- Figure 30: Europe Used Smartphone Market Volume Share (%), by Production Analysis 2025 & 2033
- Figure 31: Europe Used Smartphone Market Revenue (billion), by Consumption Analysis 2025 & 2033
- Figure 32: Europe Used Smartphone Market Volume (Million), by Consumption Analysis 2025 & 2033
- Figure 33: Europe Used Smartphone Market Revenue Share (%), by Consumption Analysis 2025 & 2033
- Figure 34: Europe Used Smartphone Market Volume Share (%), by Consumption Analysis 2025 & 2033
- Figure 35: Europe Used Smartphone Market Revenue (billion), by Import Market Analysis (Value & Volume) 2025 & 2033
- Figure 36: Europe Used Smartphone Market Volume (Million), by Import Market Analysis (Value & Volume) 2025 & 2033
- Figure 37: Europe Used Smartphone Market Revenue Share (%), by Import Market Analysis (Value & Volume) 2025 & 2033
- Figure 38: Europe Used Smartphone Market Volume Share (%), by Import Market Analysis (Value & Volume) 2025 & 2033
- Figure 39: Europe Used Smartphone Market Revenue (billion), by Export Market Analysis (Value & Volume) 2025 & 2033
- Figure 40: Europe Used Smartphone Market Volume (Million), by Export Market Analysis (Value & Volume) 2025 & 2033
- Figure 41: Europe Used Smartphone Market Revenue Share (%), by Export Market Analysis (Value & Volume) 2025 & 2033
- Figure 42: Europe Used Smartphone Market Volume Share (%), by Export Market Analysis (Value & Volume) 2025 & 2033
- Figure 43: Europe Used Smartphone Market Revenue (billion), by Price Trend Analysis 2025 & 2033
- Figure 44: Europe Used Smartphone Market Volume (Million), by Price Trend Analysis 2025 & 2033
- Figure 45: Europe Used Smartphone Market Revenue Share (%), by Price Trend Analysis 2025 & 2033
- Figure 46: Europe Used Smartphone Market Volume Share (%), by Price Trend Analysis 2025 & 2033
- Figure 47: Europe Used Smartphone Market Revenue (billion), by Country 2025 & 2033
- Figure 48: Europe Used Smartphone Market Volume (Million), by Country 2025 & 2033
- Figure 49: Europe Used Smartphone Market Revenue Share (%), by Country 2025 & 2033
- Figure 50: Europe Used Smartphone Market Volume Share (%), by Country 2025 & 2033
- Figure 51: Asia Pacific Used Smartphone Market Revenue (billion), by Production Analysis 2025 & 2033
- Figure 52: Asia Pacific Used Smartphone Market Volume (Million), by Production Analysis 2025 & 2033
- Figure 53: Asia Pacific Used Smartphone Market Revenue Share (%), by Production Analysis 2025 & 2033
- Figure 54: Asia Pacific Used Smartphone Market Volume Share (%), by Production Analysis 2025 & 2033
- Figure 55: Asia Pacific Used Smartphone Market Revenue (billion), by Consumption Analysis 2025 & 2033
- Figure 56: Asia Pacific Used Smartphone Market Volume (Million), by Consumption Analysis 2025 & 2033
- Figure 57: Asia Pacific Used Smartphone Market Revenue Share (%), by Consumption Analysis 2025 & 2033
- Figure 58: Asia Pacific Used Smartphone Market Volume Share (%), by Consumption Analysis 2025 & 2033
- Figure 59: Asia Pacific Used Smartphone Market Revenue (billion), by Import Market Analysis (Value & Volume) 2025 & 2033
- Figure 60: Asia Pacific Used Smartphone Market Volume (Million), by Import Market Analysis (Value & Volume) 2025 & 2033
- Figure 61: Asia Pacific Used Smartphone Market Revenue Share (%), by Import Market Analysis (Value & Volume) 2025 & 2033
- Figure 62: Asia Pacific Used Smartphone Market Volume Share (%), by Import Market Analysis (Value & Volume) 2025 & 2033
- Figure 63: Asia Pacific Used Smartphone Market Revenue (billion), by Export Market Analysis (Value & Volume) 2025 & 2033
- Figure 64: Asia Pacific Used Smartphone Market Volume (Million), by Export Market Analysis (Value & Volume) 2025 & 2033
- Figure 65: Asia Pacific Used Smartphone Market Revenue Share (%), by Export Market Analysis (Value & Volume) 2025 & 2033
- Figure 66: Asia Pacific Used Smartphone Market Volume Share (%), by Export Market Analysis (Value & Volume) 2025 & 2033
- Figure 67: Asia Pacific Used Smartphone Market Revenue (billion), by Price Trend Analysis 2025 & 2033
- Figure 68: Asia Pacific Used Smartphone Market Volume (Million), by Price Trend Analysis 2025 & 2033
- Figure 69: Asia Pacific Used Smartphone Market Revenue Share (%), by Price Trend Analysis 2025 & 2033
- Figure 70: Asia Pacific Used Smartphone Market Volume Share (%), by Price Trend Analysis 2025 & 2033
- Figure 71: Asia Pacific Used Smartphone Market Revenue (billion), by Country 2025 & 2033
- Figure 72: Asia Pacific Used Smartphone Market Volume (Million), by Country 2025 & 2033
- Figure 73: Asia Pacific Used Smartphone Market Revenue Share (%), by Country 2025 & 2033
- Figure 74: Asia Pacific Used Smartphone Market Volume Share (%), by Country 2025 & 2033
- Figure 75: Rest of the World Used Smartphone Market Revenue (billion), by Production Analysis 2025 & 2033
- Figure 76: Rest of the World Used Smartphone Market Volume (Million), by Production Analysis 2025 & 2033
- Figure 77: Rest of the World Used Smartphone Market Revenue Share (%), by Production Analysis 2025 & 2033
- Figure 78: Rest of the World Used Smartphone Market Volume Share (%), by Production Analysis 2025 & 2033
- Figure 79: Rest of the World Used Smartphone Market Revenue (billion), by Consumption Analysis 2025 & 2033
- Figure 80: Rest of the World Used Smartphone Market Volume (Million), by Consumption Analysis 2025 & 2033
- Figure 81: Rest of the World Used Smartphone Market Revenue Share (%), by Consumption Analysis 2025 & 2033
- Figure 82: Rest of the World Used Smartphone Market Volume Share (%), by Consumption Analysis 2025 & 2033
- Figure 83: Rest of the World Used Smartphone Market Revenue (billion), by Import Market Analysis (Value & Volume) 2025 & 2033
- Figure 84: Rest of the World Used Smartphone Market Volume (Million), by Import Market Analysis (Value & Volume) 2025 & 2033
- Figure 85: Rest of the World Used Smartphone Market Revenue Share (%), by Import Market Analysis (Value & Volume) 2025 & 2033
- Figure 86: Rest of the World Used Smartphone Market Volume Share (%), by Import Market Analysis (Value & Volume) 2025 & 2033
- Figure 87: Rest of the World Used Smartphone Market Revenue (billion), by Export Market Analysis (Value & Volume) 2025 & 2033
- Figure 88: Rest of the World Used Smartphone Market Volume (Million), by Export Market Analysis (Value & Volume) 2025 & 2033
- Figure 89: Rest of the World Used Smartphone Market Revenue Share (%), by Export Market Analysis (Value & Volume) 2025 & 2033
- Figure 90: Rest of the World Used Smartphone Market Volume Share (%), by Export Market Analysis (Value & Volume) 2025 & 2033
- Figure 91: Rest of the World Used Smartphone Market Revenue (billion), by Price Trend Analysis 2025 & 2033
- Figure 92: Rest of the World Used Smartphone Market Volume (Million), by Price Trend Analysis 2025 & 2033
- Figure 93: Rest of the World Used Smartphone Market Revenue Share (%), by Price Trend Analysis 2025 & 2033
- Figure 94: Rest of the World Used Smartphone Market Volume Share (%), by Price Trend Analysis 2025 & 2033
- Figure 95: Rest of the World Used Smartphone Market Revenue (billion), by Country 2025 & 2033
- Figure 96: Rest of the World Used Smartphone Market Volume (Million), by Country 2025 & 2033
- Figure 97: Rest of the World Used Smartphone Market Revenue Share (%), by Country 2025 & 2033
- Figure 98: Rest of the World Used Smartphone Market Volume Share (%), by Country 2025 & 2033
List of Tables
- Table 1: Global Used Smartphone Market Revenue billion Forecast, by Production Analysis 2020 & 2033
- Table 2: Global Used Smartphone Market Volume Million Forecast, by Production Analysis 2020 & 2033
- Table 3: Global Used Smartphone Market Revenue billion Forecast, by Consumption Analysis 2020 & 2033
- Table 4: Global Used Smartphone Market Volume Million Forecast, by Consumption Analysis 2020 & 2033
- Table 5: Global Used Smartphone Market Revenue billion Forecast, by Import Market Analysis (Value & Volume) 2020 & 2033
- Table 6: Global Used Smartphone Market Volume Million Forecast, by Import Market Analysis (Value & Volume) 2020 & 2033
- Table 7: Global Used Smartphone Market Revenue billion Forecast, by Export Market Analysis (Value & Volume) 2020 & 2033
- Table 8: Global Used Smartphone Market Volume Million Forecast, by Export Market Analysis (Value & Volume) 2020 & 2033
- Table 9: Global Used Smartphone Market Revenue billion Forecast, by Price Trend Analysis 2020 & 2033
- Table 10: Global Used Smartphone Market Volume Million Forecast, by Price Trend Analysis 2020 & 2033
- Table 11: Global Used Smartphone Market Revenue billion Forecast, by Region 2020 & 2033
- Table 12: Global Used Smartphone Market Volume Million Forecast, by Region 2020 & 2033
- Table 13: Global Used Smartphone Market Revenue billion Forecast, by Production Analysis 2020 & 2033
- Table 14: Global Used Smartphone Market Volume Million Forecast, by Production Analysis 2020 & 2033
- Table 15: Global Used Smartphone Market Revenue billion Forecast, by Consumption Analysis 2020 & 2033
- Table 16: Global Used Smartphone Market Volume Million Forecast, by Consumption Analysis 2020 & 2033
- Table 17: Global Used Smartphone Market Revenue billion Forecast, by Import Market Analysis (Value & Volume) 2020 & 2033
- Table 18: Global Used Smartphone Market Volume Million Forecast, by Import Market Analysis (Value & Volume) 2020 & 2033
- Table 19: Global Used Smartphone Market Revenue billion Forecast, by Export Market Analysis (Value & Volume) 2020 & 2033
- Table 20: Global Used Smartphone Market Volume Million Forecast, by Export Market Analysis (Value & Volume) 2020 & 2033
- Table 21: Global Used Smartphone Market Revenue billion Forecast, by Price Trend Analysis 2020 & 2033
- Table 22: Global Used Smartphone Market Volume Million Forecast, by Price Trend Analysis 2020 & 2033
- Table 23: Global Used Smartphone Market Revenue billion Forecast, by Country 2020 & 2033
- Table 24: Global Used Smartphone Market Volume Million Forecast, by Country 2020 & 2033
- Table 25: Global Used Smartphone Market Revenue billion Forecast, by Production Analysis 2020 & 2033
- Table 26: Global Used Smartphone Market Volume Million Forecast, by Production Analysis 2020 & 2033
- Table 27: Global Used Smartphone Market Revenue billion Forecast, by Consumption Analysis 2020 & 2033
- Table 28: Global Used Smartphone Market Volume Million Forecast, by Consumption Analysis 2020 & 2033
- Table 29: Global Used Smartphone Market Revenue billion Forecast, by Import Market Analysis (Value & Volume) 2020 & 2033
- Table 30: Global Used Smartphone Market Volume Million Forecast, by Import Market Analysis (Value & Volume) 2020 & 2033
- Table 31: Global Used Smartphone Market Revenue billion Forecast, by Export Market Analysis (Value & Volume) 2020 & 2033
- Table 32: Global Used Smartphone Market Volume Million Forecast, by Export Market Analysis (Value & Volume) 2020 & 2033
- Table 33: Global Used Smartphone Market Revenue billion Forecast, by Price Trend Analysis 2020 & 2033
- Table 34: Global Used Smartphone Market Volume Million Forecast, by Price Trend Analysis 2020 & 2033
- Table 35: Global Used Smartphone Market Revenue billion Forecast, by Country 2020 & 2033
- Table 36: Global Used Smartphone Market Volume Million Forecast, by Country 2020 & 2033
- Table 37: Global Used Smartphone Market Revenue billion Forecast, by Production Analysis 2020 & 2033
- Table 38: Global Used Smartphone Market Volume Million Forecast, by Production Analysis 2020 & 2033
- Table 39: Global Used Smartphone Market Revenue billion Forecast, by Consumption Analysis 2020 & 2033
- Table 40: Global Used Smartphone Market Volume Million Forecast, by Consumption Analysis 2020 & 2033
- Table 41: Global Used Smartphone Market Revenue billion Forecast, by Import Market Analysis (Value & Volume) 2020 & 2033
- Table 42: Global Used Smartphone Market Volume Million Forecast, by Import Market Analysis (Value & Volume) 2020 & 2033
- Table 43: Global Used Smartphone Market Revenue billion Forecast, by Export Market Analysis (Value & Volume) 2020 & 2033
- Table 44: Global Used Smartphone Market Volume Million Forecast, by Export Market Analysis (Value & Volume) 2020 & 2033
- Table 45: Global Used Smartphone Market Revenue billion Forecast, by Price Trend Analysis 2020 & 2033
- Table 46: Global Used Smartphone Market Volume Million Forecast, by Price Trend Analysis 2020 & 2033
- Table 47: Global Used Smartphone Market Revenue billion Forecast, by Country 2020 & 2033
- Table 48: Global Used Smartphone Market Volume Million Forecast, by Country 2020 & 2033
- Table 49: Global Used Smartphone Market Revenue billion Forecast, by Production Analysis 2020 & 2033
- Table 50: Global Used Smartphone Market Volume Million Forecast, by Production Analysis 2020 & 2033
- Table 51: Global Used Smartphone Market Revenue billion Forecast, by Consumption Analysis 2020 & 2033
- Table 52: Global Used Smartphone Market Volume Million Forecast, by Consumption Analysis 2020 & 2033
- Table 53: Global Used Smartphone Market Revenue billion Forecast, by Import Market Analysis (Value & Volume) 2020 & 2033
- Table 54: Global Used Smartphone Market Volume Million Forecast, by Import Market Analysis (Value & Volume) 2020 & 2033
- Table 55: Global Used Smartphone Market Revenue billion Forecast, by Export Market Analysis (Value & Volume) 2020 & 2033
- Table 56: Global Used Smartphone Market Volume Million Forecast, by Export Market Analysis (Value & Volume) 2020 & 2033
- Table 57: Global Used Smartphone Market Revenue billion Forecast, by Price Trend Analysis 2020 & 2033
- Table 58: Global Used Smartphone Market Volume Million Forecast, by Price Trend Analysis 2020 & 2033
- Table 59: Global Used Smartphone Market Revenue billion Forecast, by Country 2020 & 2033
- Table 60: Global Used Smartphone Market Volume Million Forecast, by Country 2020 & 2033
Frequently Asked Questions
1. What is the projected Compound Annual Growth Rate (CAGR) of the Used Smartphone Market?
The projected CAGR is approximately 22.6%.
2. Which companies are prominent players in the Used Smartphone Market?
Key companies in the market include Alibaba Group Holding Limited, Best Buy Co Inc, Reboxed Limited, Flipkart Internet Private Limited (Walmart Inc, Samsung Electronics Co Ltd, Verizon Communications Inc, FoneGiant, Paytm (One97 Communications Limited), Amazon com Inc, Nippon Telephone Inc, Back Market, AT&T Inc, Apple Inc.
3. What are the main segments of the Used Smartphone Market?
The market segments include Production Analysis, Consumption Analysis, Import Market Analysis (Value & Volume), Export Market Analysis (Value & Volume), Price Trend Analysis.
4. Can you provide details about the market size?
The market size is estimated to be USD 42.33 billion as of 2022.
5. What are some drivers contributing to market growth?
Trend Toward Premium Phones (Rise in Upgrade Costs); Growing Popularity of E-commerce Platforms for Used and Refurbished Smartphones; Telecom Operators Focusing on Used Phones with Attractive Plans.
6. What are the notable trends driving market growth?
Growing Popularity of E-commerce Platforms for Used and Refurbished Smartphones to Drive the Market.
7. Are there any restraints impacting market growth?
Short term supply chain challenges due to the pandemic scenario and the US-China Trade war scenario.
8. Can you provide examples of recent developments in the market?
December 2023 - Smartphone refurbishing startup ControlZ aims to invest nearly USD 2 million in its Gurugram repair facility again in 2024. The company aims to repair 1 lakh units at the facility in 2024 and scale it to 5 lakh units by 2025.
9. What pricing options are available for accessing the report?
Pricing options include single-user, multi-user, and enterprise licenses priced at USD 4750, USD 5250, and USD 8750 respectively.
10. Is the market size provided in terms of value or volume?
The market size is provided in terms of value, measured in billion and volume, measured in Million.
11. Are there any specific market keywords associated with the report?
Yes, the market keyword associated with the report is "Used Smartphone Market," which aids in identifying and referencing the specific market segment covered.
12. How do I determine which pricing option suits my needs best?
The pricing options vary based on user requirements and access needs. Individual users may opt for single-user licenses, while businesses requiring broader access may choose multi-user or enterprise licenses for cost-effective access to the report.
13. Are there any additional resources or data provided in the Used Smartphone Market report?
While the report offers comprehensive insights, it's advisable to review the specific contents or supplementary materials provided to ascertain if additional resources or data are available.
14. How can I stay updated on further developments or reports in the Used Smartphone Market?
To stay informed about further developments, trends, and reports in the Used Smartphone Market, consider subscribing to industry newsletters, following relevant companies and organizations, or regularly checking reputable industry news sources and publications.
Methodology
Step 1 - Identification of Relevant Samples Size from Population Database


Step 2 - Approaches for Defining Global Market Size (Value, Volume* & Price*)

Note*: In applicable scenarios
Step 3 - Data Sources
Primary Research
- Web Analytics
- Survey Reports
- Research Institute
- Latest Research Reports
- Opinion Leaders
Secondary Research
- Annual Reports
- White Paper
- Latest Press Release
- Industry Association
- Paid Database
- Investor Presentations

Step 4 - Data Triangulation
Involves using different sources of information in order to increase the validity of a study
These sources are likely to be stakeholders in a program - participants, other researchers, program staff, other community members, and so on.
Then we put all data in single framework & apply various statistical tools to find out the dynamic on the market.
During the analysis stage, feedback from the stakeholder groups would be compared to determine areas of agreement as well as areas of divergence