


Key Insights
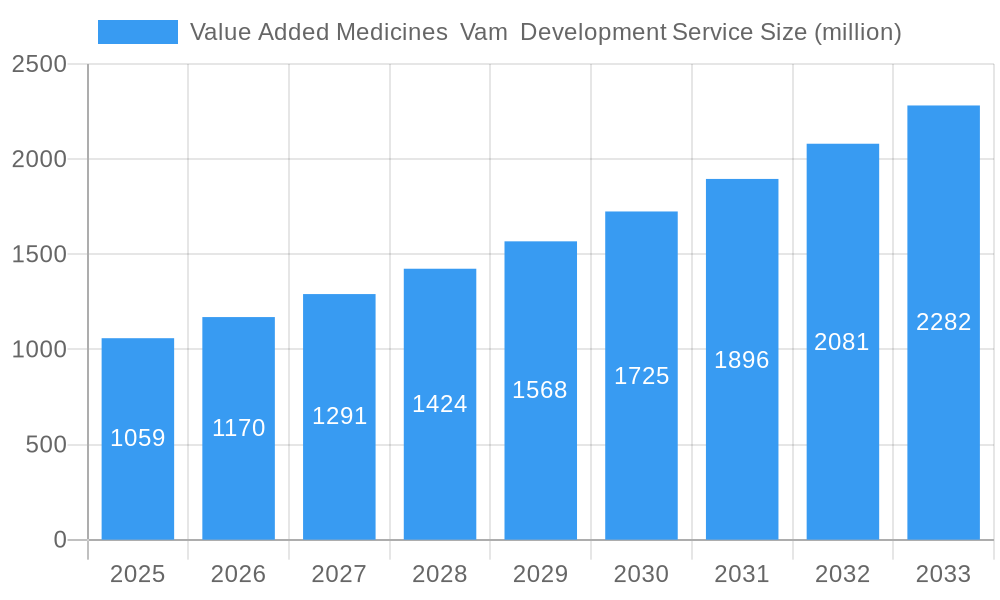
The Value Added Medicines (VAM) Development Services market, currently valued at approximately $1059 million in 2025, exhibits robust growth potential, projected to expand at a Compound Annual Growth Rate (CAGR) of 10.5% from 2025 to 2033. This growth is driven by several key factors. Increasing demand for specialized pharmaceutical formulations to enhance drug efficacy and patient compliance fuels market expansion. The rising prevalence of chronic diseases necessitates innovative VAMs, stimulating demand for development services. Furthermore, the ongoing evolution of drug delivery technologies, such as targeted drug delivery systems and controlled-release formulations, creates opportunities for specialized VAM development services. Stringent regulatory requirements for VAMs necessitate collaboration with experienced development partners, contributing to market growth. Key players like Altus Drug Development, Tiefenbacher Group, and Sandoz AG are actively shaping market dynamics through innovation and strategic partnerships. The market's competitive landscape is characterized by a mix of large multinational pharmaceutical companies and smaller specialized service providers.
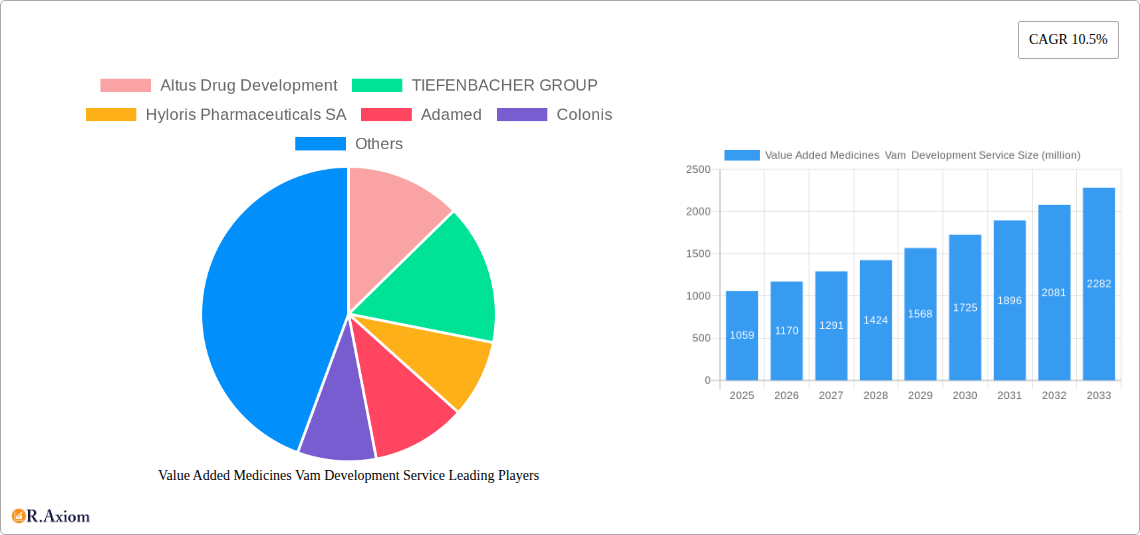
Value Added Medicines Vam Development Service Market Size (In Billion)

The market segmentation within VAM development services likely comprises various service types, such as formulation development, analytical testing, stability studies, and regulatory affairs support. Geographical distribution is expected to be diverse, with mature markets like North America and Europe experiencing steady growth, while emerging economies in Asia and Latin America present significant untapped potential. Despite the positive outlook, market expansion may face challenges including increasing research and development costs, stringent regulatory hurdles, and the need for substantial investments in advanced technologies. However, continued innovation and strategic collaborations within the industry are anticipated to mitigate these constraints and drive further growth in the VAM development services market over the forecast period.
Value Added Medicines Vam Development Service Company Market Share
This comprehensive report provides a detailed analysis of the Value Added Medicines (VAM) Development Service market, offering invaluable insights for stakeholders seeking to understand market dynamics, growth opportunities, and competitive landscapes. The study covers the period from 2019 to 2033, with a base year of 2025 and a forecast period spanning 2025-2033. The historical period analyzed is 2019-2024. The report is enriched with data on market size (in millions), CAGR, market share, and M&A activities, providing actionable intelligence for strategic decision-making.
Value Added Medicines VAM Development Service Market Concentration & Innovation
This section analyzes the market concentration, innovation drivers, regulatory frameworks, product substitutes, end-user trends, and mergers and acquisitions (M&A) activities within the VAM development service market. The market is characterized by a moderately concentrated structure with a few major players holding significant market share. The top 5 companies (Altus Drug Development, TIEFENBACHER GROUP, Hyloris Pharmaceuticals SA, Adamed, and Sandoz AG) collectively hold an estimated xx% market share in 2025, with Sandoz AG leading the pack at approximately xx%. Smaller players focus on niche areas, leveraging specialized expertise.
Innovation is driven by advancements in formulation technologies, such as controlled-release and targeted drug delivery systems, alongside the increasing demand for personalized medicine. Stringent regulatory frameworks, including those from the FDA and EMA, influence the development and approval process, necessitating substantial investment in research and compliance. Generic competition and the emergence of biosimilars act as significant substitutes, impacting pricing and market share dynamics. The end-user trends lean towards higher efficacy, improved safety profiles, and patient-centric formulations.
M&A activity has been significant, with deal values exceeding $xx million in the last five years. These activities are primarily driven by expansion into new therapeutic areas, access to advanced technologies, and broader geographical reach. Specific examples include (but are not limited to): the acquisition of X company by Y company in 2023 for $xx million, strengthening Y’s portfolio in oncology; and the merger of A and B companies in 2022 resulting in improved market reach.
Value Added Medicines VAM Development Service Industry Trends & Insights
The VAM development services market is expected to witness robust growth, with a projected CAGR of xx% during the forecast period (2025-2033). This growth is primarily fueled by the rising prevalence of chronic diseases globally, the increasing demand for specialized drug formulations, and significant investments in research and development by pharmaceutical companies. Technological advancements such as AI-driven drug discovery and personalized medicine are further driving market expansion.
Consumer preferences are shifting towards more convenient and effective drug delivery systems, such as inhalers, patches, and implants. This trend has influenced the development of innovative VAM formulations. The competitive landscape is characterized by intense rivalry among established players and emerging companies, leading to product innovation and price competition. Market penetration of novel VAM delivery systems is gradually increasing, reaching approximately xx% in 2025 and expected to rise to xx% by 2033. The market dynamics reflect a blend of established players focusing on consolidation and emerging players trying to create niches. Challenges include regulatory hurdles, pricing pressures, and patent expirations, impacting growth trajectories.
Dominant Markets & Segments in Value Added Medicines VAM Development Service
North America holds the leading position in the VAM development service market, driven by high R&D investments, a well-established healthcare infrastructure, and a favorable regulatory environment. Europe follows closely, with a growing demand for advanced therapies and increasing government initiatives supporting pharmaceutical innovation. Asia-Pacific presents significant growth opportunities due to increasing healthcare spending, rising prevalence of chronic diseases, and an expanding pharmaceutical industry.
Key Drivers for North America's Dominance:
- Robust healthcare infrastructure and high R&D spending.
- Favorable regulatory environment facilitating approvals.
- Strong presence of major pharmaceutical companies and CROs.
- High disposable income and better healthcare accessibility.
The dominance of North America is expected to continue throughout the forecast period, although other regions will experience faster growth rates. The specific segments driving growth are currently under analysis and more information will be included in the full report.
Value Added Medicines VAM Development Service Product Developments
Recent product innovations in VAM development services focus on developing targeted delivery systems, personalized formulations, and improved bioavailability. Advances in nanotechnology, microfluidics, and 3D printing are leading to the creation of more efficient and precise drug delivery mechanisms, addressing the challenges of conventional formulations. These advancements provide a competitive advantage by enhancing efficacy, reducing side effects, and improving patient compliance. The market fit for these innovative products is strong, driven by the increasing demand for personalized and targeted therapies.
Report Scope & Segmentation Analysis
This report segments the VAM development service market based on various factors, including drug type (e.g., small molecules, biologics), delivery route (e.g., oral, injectable, topical), therapeutic area (e.g., oncology, cardiovascular, CNS), and geography. Each segment offers unique growth projections and competitive dynamics. Growth projections vary widely depending on the segment, with oral delivery systems maintaining a larger market share due to their convenience but injectable experiencing a higher CAGR due to increasing demand for specialized therapies. The competitive landscape is also varied by the segment.
Key Drivers of Value Added Medicines Vam Development Service Growth
The growth of the VAM development service market is driven by several key factors:
- Technological Advancements: Innovations in drug delivery systems, such as nanoparticles and liposomes, are leading to more effective and targeted therapies.
- Economic Factors: Increased healthcare spending and growing disposable incomes in many regions are fueling demand for advanced pharmaceutical products.
- Regulatory Support: Government initiatives and regulatory frameworks incentivizing the development of VAMs are boosting market growth.
- Rise in Chronic Diseases: The increasing prevalence of chronic diseases, such as diabetes and cancer, is driving the demand for more effective treatment options.
Challenges in the Value Added Medicines Vam Development Service Sector
The VAM development service sector faces several challenges:
- High R&D Costs: The development of VAMs is expensive, requiring substantial investments in research and clinical trials. This limits entry for many players.
- Stringent Regulatory Requirements: Navigating the complex regulatory landscape adds to development costs and timeframes, slowing market entry.
- Generic Competition: Generic versions of VAMs could reduce profitability for innovators.
- Supply Chain Disruptions: Global supply chain issues can affect the availability of raw materials and manufacturing capacity.
Emerging Opportunities in Value Added Medicines Vam Development Service
Emerging opportunities for VAM development services include:
- Personalized Medicine: Tailoring treatments to individual patients' genetic profiles and other characteristics creates demand for customized formulations.
- Biosimilars: The growing market for biosimilars presents opportunities for VAM development services focused on these products.
- Expansion into Emerging Markets: Untapped markets in developing countries offer substantial potential for growth.
- Advanced Drug Delivery Systems: The continued development of sophisticated drug delivery technologies provides ongoing innovation opportunities.
Leading Players in the Value Added Medicines Vam Development Service Market
- Altus Drug Development
- TIEFENBACHER GROUP (Website unavailable)
- Hyloris Pharmaceuticals SA
- Adamed (Website unavailable)
- Colonis (Website unavailable)
- Towa International (Website unavailable)
- Galenicap (Website unavailable)
- Sandoz AG
- Adragos Pharma (Website unavailable)
Key Developments in Value Added Medicines Vam Development Service Industry
- 2023 Q3: Sandoz AG launched a new VAM formulation for a specific treatment area.
- 2022 Q4: Altus Drug Development announced a partnership to advance a novel drug delivery system.
- 2021 Q1: A significant M&A deal involving two leading players reshaped the market landscape. Further details to be provided in full report.
- (Further details on key developments with specific dates and impacts will be included in the final report)
Strategic Outlook for Value Added Medicines Vam Development Service Market
The future of the VAM development service market looks promising, driven by sustained growth in the pharmaceutical industry and a strong focus on innovation. The increasing prevalence of chronic diseases, rising healthcare spending, and advancements in technology will continue to drive demand for advanced drug delivery systems and customized therapies. Strategic partnerships, M&A activities, and investments in R&D will be crucial for companies seeking to maintain a competitive edge in this dynamic market. The market is poised for continued expansion, providing numerous opportunities for both established and emerging players.
Value Added Medicines Vam Development Service Segmentation
-
1. Application
- 1.1. Pharmaceutical Companies
- 1.2. Biotech Companies
- 1.3. Hospitals and Medical Institutions
-
2. Type
- 2.1. Chronic Disease Treatment Drugs
- 2.2. Infectious Disease Treatment Drugs
- 2.3. Tumor Treatment Drugs
- 2.4. Other
Value Added Medicines Vam Development Service Segmentation By Geography
-
1. North America
- 1.1. United States
- 1.2. Canada
- 1.3. Mexico
-
2. South America
- 2.1. Brazil
- 2.2. Argentina
- 2.3. Rest of South America
-
3. Europe
- 3.1. United Kingdom
- 3.2. Germany
- 3.3. France
- 3.4. Italy
- 3.5. Spain
- 3.6. Russia
- 3.7. Benelux
- 3.8. Nordics
- 3.9. Rest of Europe
-
4. Middle East & Africa
- 4.1. Turkey
- 4.2. Israel
- 4.3. GCC
- 4.4. North Africa
- 4.5. South Africa
- 4.6. Rest of Middle East & Africa
-
5. Asia Pacific
- 5.1. China
- 5.2. India
- 5.3. Japan
- 5.4. South Korea
- 5.5. ASEAN
- 5.6. Oceania
- 5.7. Rest of Asia Pacific

Value Added Medicines Vam Development Service Regional Market Share
Geographic Coverage of Value Added Medicines Vam Development Service
Value Added Medicines Vam Development Service REPORT HIGHLIGHTS
| Aspects | Details |
|---|---|
| Study Period | 2020-2034 |
| Base Year | 2025 |
| Estimated Year | 2026 |
| Forecast Period | 2026-2034 |
| Historical Period | 2020-2025 |
| Growth Rate | CAGR of 10.5% from 2020-2034 |
| Segmentation |
|
Table of Contents
- 1. Introduction
- 1.1. Research Scope
- 1.2. Market Segmentation
- 1.3. Research Methodology
- 1.4. Definitions and Assumptions
- 2. Executive Summary
- 2.1. Introduction
- 3. Market Dynamics
- 3.1. Introduction
- 3.2. Market Drivers
- 3.3. Market Restrains
- 3.4. Market Trends
- 4. Market Factor Analysis
- 4.1. Porters Five Forces
- 4.2. Supply/Value Chain
- 4.3. PESTEL analysis
- 4.4. Market Entropy
- 4.5. Patent/Trademark Analysis
- 5. Global Value Added Medicines Vam Development Service Analysis, Insights and Forecast, 2020-2032
- 5.1. Market Analysis, Insights and Forecast - by Application
- 5.1.1. Pharmaceutical Companies
- 5.1.2. Biotech Companies
- 5.1.3. Hospitals and Medical Institutions
- 5.2. Market Analysis, Insights and Forecast - by Type
- 5.2.1. Chronic Disease Treatment Drugs
- 5.2.2. Infectious Disease Treatment Drugs
- 5.2.3. Tumor Treatment Drugs
- 5.2.4. Other
- 5.3. Market Analysis, Insights and Forecast - by Region
- 5.3.1. North America
- 5.3.2. South America
- 5.3.3. Europe
- 5.3.4. Middle East & Africa
- 5.3.5. Asia Pacific
- 5.1. Market Analysis, Insights and Forecast - by Application
- 6. North America Value Added Medicines Vam Development Service Analysis, Insights and Forecast, 2020-2032
- 6.1. Market Analysis, Insights and Forecast - by Application
- 6.1.1. Pharmaceutical Companies
- 6.1.2. Biotech Companies
- 6.1.3. Hospitals and Medical Institutions
- 6.2. Market Analysis, Insights and Forecast - by Type
- 6.2.1. Chronic Disease Treatment Drugs
- 6.2.2. Infectious Disease Treatment Drugs
- 6.2.3. Tumor Treatment Drugs
- 6.2.4. Other
- 6.1. Market Analysis, Insights and Forecast - by Application
- 7. South America Value Added Medicines Vam Development Service Analysis, Insights and Forecast, 2020-2032
- 7.1. Market Analysis, Insights and Forecast - by Application
- 7.1.1. Pharmaceutical Companies
- 7.1.2. Biotech Companies
- 7.1.3. Hospitals and Medical Institutions
- 7.2. Market Analysis, Insights and Forecast - by Type
- 7.2.1. Chronic Disease Treatment Drugs
- 7.2.2. Infectious Disease Treatment Drugs
- 7.2.3. Tumor Treatment Drugs
- 7.2.4. Other
- 7.1. Market Analysis, Insights and Forecast - by Application
- 8. Europe Value Added Medicines Vam Development Service Analysis, Insights and Forecast, 2020-2032
- 8.1. Market Analysis, Insights and Forecast - by Application
- 8.1.1. Pharmaceutical Companies
- 8.1.2. Biotech Companies
- 8.1.3. Hospitals and Medical Institutions
- 8.2. Market Analysis, Insights and Forecast - by Type
- 8.2.1. Chronic Disease Treatment Drugs
- 8.2.2. Infectious Disease Treatment Drugs
- 8.2.3. Tumor Treatment Drugs
- 8.2.4. Other
- 8.1. Market Analysis, Insights and Forecast - by Application
- 9. Middle East & Africa Value Added Medicines Vam Development Service Analysis, Insights and Forecast, 2020-2032
- 9.1. Market Analysis, Insights and Forecast - by Application
- 9.1.1. Pharmaceutical Companies
- 9.1.2. Biotech Companies
- 9.1.3. Hospitals and Medical Institutions
- 9.2. Market Analysis, Insights and Forecast - by Type
- 9.2.1. Chronic Disease Treatment Drugs
- 9.2.2. Infectious Disease Treatment Drugs
- 9.2.3. Tumor Treatment Drugs
- 9.2.4. Other
- 9.1. Market Analysis, Insights and Forecast - by Application
- 10. Asia Pacific Value Added Medicines Vam Development Service Analysis, Insights and Forecast, 2020-2032
- 10.1. Market Analysis, Insights and Forecast - by Application
- 10.1.1. Pharmaceutical Companies
- 10.1.2. Biotech Companies
- 10.1.3. Hospitals and Medical Institutions
- 10.2. Market Analysis, Insights and Forecast - by Type
- 10.2.1. Chronic Disease Treatment Drugs
- 10.2.2. Infectious Disease Treatment Drugs
- 10.2.3. Tumor Treatment Drugs
- 10.2.4. Other
- 10.1. Market Analysis, Insights and Forecast - by Application
- 11. Competitive Analysis
- 11.1. Global Market Share Analysis 2025
- 11.2. Company Profiles
- 11.2.1 Altus Drug Development
- 11.2.1.1. Overview
- 11.2.1.2. Products
- 11.2.1.3. SWOT Analysis
- 11.2.1.4. Recent Developments
- 11.2.1.5. Financials (Based on Availability)
- 11.2.2 TIEFENBACHER GROUP
- 11.2.2.1. Overview
- 11.2.2.2. Products
- 11.2.2.3. SWOT Analysis
- 11.2.2.4. Recent Developments
- 11.2.2.5. Financials (Based on Availability)
- 11.2.3 Hyloris Pharmaceuticals SA
- 11.2.3.1. Overview
- 11.2.3.2. Products
- 11.2.3.3. SWOT Analysis
- 11.2.3.4. Recent Developments
- 11.2.3.5. Financials (Based on Availability)
- 11.2.4 Adamed
- 11.2.4.1. Overview
- 11.2.4.2. Products
- 11.2.4.3. SWOT Analysis
- 11.2.4.4. Recent Developments
- 11.2.4.5. Financials (Based on Availability)
- 11.2.5 Colonis
- 11.2.5.1. Overview
- 11.2.5.2. Products
- 11.2.5.3. SWOT Analysis
- 11.2.5.4. Recent Developments
- 11.2.5.5. Financials (Based on Availability)
- 11.2.6 Towa International
- 11.2.6.1. Overview
- 11.2.6.2. Products
- 11.2.6.3. SWOT Analysis
- 11.2.6.4. Recent Developments
- 11.2.6.5. Financials (Based on Availability)
- 11.2.7 Galenicap
- 11.2.7.1. Overview
- 11.2.7.2. Products
- 11.2.7.3. SWOT Analysis
- 11.2.7.4. Recent Developments
- 11.2.7.5. Financials (Based on Availability)
- 11.2.8 Sandoz AG
- 11.2.8.1. Overview
- 11.2.8.2. Products
- 11.2.8.3. SWOT Analysis
- 11.2.8.4. Recent Developments
- 11.2.8.5. Financials (Based on Availability)
- 11.2.9 Adragos Pharma
- 11.2.9.1. Overview
- 11.2.9.2. Products
- 11.2.9.3. SWOT Analysis
- 11.2.9.4. Recent Developments
- 11.2.9.5. Financials (Based on Availability)
- 11.2.1 Altus Drug Development
List of Figures
- Figure 1: Global Value Added Medicines Vam Development Service Revenue Breakdown (million, %) by Region 2025 & 2033
- Figure 2: North America Value Added Medicines Vam Development Service Revenue (million), by Application 2025 & 2033
- Figure 3: North America Value Added Medicines Vam Development Service Revenue Share (%), by Application 2025 & 2033
- Figure 4: North America Value Added Medicines Vam Development Service Revenue (million), by Type 2025 & 2033
- Figure 5: North America Value Added Medicines Vam Development Service Revenue Share (%), by Type 2025 & 2033
- Figure 6: North America Value Added Medicines Vam Development Service Revenue (million), by Country 2025 & 2033
- Figure 7: North America Value Added Medicines Vam Development Service Revenue Share (%), by Country 2025 & 2033
- Figure 8: South America Value Added Medicines Vam Development Service Revenue (million), by Application 2025 & 2033
- Figure 9: South America Value Added Medicines Vam Development Service Revenue Share (%), by Application 2025 & 2033
- Figure 10: South America Value Added Medicines Vam Development Service Revenue (million), by Type 2025 & 2033
- Figure 11: South America Value Added Medicines Vam Development Service Revenue Share (%), by Type 2025 & 2033
- Figure 12: South America Value Added Medicines Vam Development Service Revenue (million), by Country 2025 & 2033
- Figure 13: South America Value Added Medicines Vam Development Service Revenue Share (%), by Country 2025 & 2033
- Figure 14: Europe Value Added Medicines Vam Development Service Revenue (million), by Application 2025 & 2033
- Figure 15: Europe Value Added Medicines Vam Development Service Revenue Share (%), by Application 2025 & 2033
- Figure 16: Europe Value Added Medicines Vam Development Service Revenue (million), by Type 2025 & 2033
- Figure 17: Europe Value Added Medicines Vam Development Service Revenue Share (%), by Type 2025 & 2033
- Figure 18: Europe Value Added Medicines Vam Development Service Revenue (million), by Country 2025 & 2033
- Figure 19: Europe Value Added Medicines Vam Development Service Revenue Share (%), by Country 2025 & 2033
- Figure 20: Middle East & Africa Value Added Medicines Vam Development Service Revenue (million), by Application 2025 & 2033
- Figure 21: Middle East & Africa Value Added Medicines Vam Development Service Revenue Share (%), by Application 2025 & 2033
- Figure 22: Middle East & Africa Value Added Medicines Vam Development Service Revenue (million), by Type 2025 & 2033
- Figure 23: Middle East & Africa Value Added Medicines Vam Development Service Revenue Share (%), by Type 2025 & 2033
- Figure 24: Middle East & Africa Value Added Medicines Vam Development Service Revenue (million), by Country 2025 & 2033
- Figure 25: Middle East & Africa Value Added Medicines Vam Development Service Revenue Share (%), by Country 2025 & 2033
- Figure 26: Asia Pacific Value Added Medicines Vam Development Service Revenue (million), by Application 2025 & 2033
- Figure 27: Asia Pacific Value Added Medicines Vam Development Service Revenue Share (%), by Application 2025 & 2033
- Figure 28: Asia Pacific Value Added Medicines Vam Development Service Revenue (million), by Type 2025 & 2033
- Figure 29: Asia Pacific Value Added Medicines Vam Development Service Revenue Share (%), by Type 2025 & 2033
- Figure 30: Asia Pacific Value Added Medicines Vam Development Service Revenue (million), by Country 2025 & 2033
- Figure 31: Asia Pacific Value Added Medicines Vam Development Service Revenue Share (%), by Country 2025 & 2033
List of Tables
- Table 1: Global Value Added Medicines Vam Development Service Revenue million Forecast, by Application 2020 & 2033
- Table 2: Global Value Added Medicines Vam Development Service Revenue million Forecast, by Type 2020 & 2033
- Table 3: Global Value Added Medicines Vam Development Service Revenue million Forecast, by Region 2020 & 2033
- Table 4: Global Value Added Medicines Vam Development Service Revenue million Forecast, by Application 2020 & 2033
- Table 5: Global Value Added Medicines Vam Development Service Revenue million Forecast, by Type 2020 & 2033
- Table 6: Global Value Added Medicines Vam Development Service Revenue million Forecast, by Country 2020 & 2033
- Table 7: United States Value Added Medicines Vam Development Service Revenue (million) Forecast, by Application 2020 & 2033
- Table 8: Canada Value Added Medicines Vam Development Service Revenue (million) Forecast, by Application 2020 & 2033
- Table 9: Mexico Value Added Medicines Vam Development Service Revenue (million) Forecast, by Application 2020 & 2033
- Table 10: Global Value Added Medicines Vam Development Service Revenue million Forecast, by Application 2020 & 2033
- Table 11: Global Value Added Medicines Vam Development Service Revenue million Forecast, by Type 2020 & 2033
- Table 12: Global Value Added Medicines Vam Development Service Revenue million Forecast, by Country 2020 & 2033
- Table 13: Brazil Value Added Medicines Vam Development Service Revenue (million) Forecast, by Application 2020 & 2033
- Table 14: Argentina Value Added Medicines Vam Development Service Revenue (million) Forecast, by Application 2020 & 2033
- Table 15: Rest of South America Value Added Medicines Vam Development Service Revenue (million) Forecast, by Application 2020 & 2033
- Table 16: Global Value Added Medicines Vam Development Service Revenue million Forecast, by Application 2020 & 2033
- Table 17: Global Value Added Medicines Vam Development Service Revenue million Forecast, by Type 2020 & 2033
- Table 18: Global Value Added Medicines Vam Development Service Revenue million Forecast, by Country 2020 & 2033
- Table 19: United Kingdom Value Added Medicines Vam Development Service Revenue (million) Forecast, by Application 2020 & 2033
- Table 20: Germany Value Added Medicines Vam Development Service Revenue (million) Forecast, by Application 2020 & 2033
- Table 21: France Value Added Medicines Vam Development Service Revenue (million) Forecast, by Application 2020 & 2033
- Table 22: Italy Value Added Medicines Vam Development Service Revenue (million) Forecast, by Application 2020 & 2033
- Table 23: Spain Value Added Medicines Vam Development Service Revenue (million) Forecast, by Application 2020 & 2033
- Table 24: Russia Value Added Medicines Vam Development Service Revenue (million) Forecast, by Application 2020 & 2033
- Table 25: Benelux Value Added Medicines Vam Development Service Revenue (million) Forecast, by Application 2020 & 2033
- Table 26: Nordics Value Added Medicines Vam Development Service Revenue (million) Forecast, by Application 2020 & 2033
- Table 27: Rest of Europe Value Added Medicines Vam Development Service Revenue (million) Forecast, by Application 2020 & 2033
- Table 28: Global Value Added Medicines Vam Development Service Revenue million Forecast, by Application 2020 & 2033
- Table 29: Global Value Added Medicines Vam Development Service Revenue million Forecast, by Type 2020 & 2033
- Table 30: Global Value Added Medicines Vam Development Service Revenue million Forecast, by Country 2020 & 2033
- Table 31: Turkey Value Added Medicines Vam Development Service Revenue (million) Forecast, by Application 2020 & 2033
- Table 32: Israel Value Added Medicines Vam Development Service Revenue (million) Forecast, by Application 2020 & 2033
- Table 33: GCC Value Added Medicines Vam Development Service Revenue (million) Forecast, by Application 2020 & 2033
- Table 34: North Africa Value Added Medicines Vam Development Service Revenue (million) Forecast, by Application 2020 & 2033
- Table 35: South Africa Value Added Medicines Vam Development Service Revenue (million) Forecast, by Application 2020 & 2033
- Table 36: Rest of Middle East & Africa Value Added Medicines Vam Development Service Revenue (million) Forecast, by Application 2020 & 2033
- Table 37: Global Value Added Medicines Vam Development Service Revenue million Forecast, by Application 2020 & 2033
- Table 38: Global Value Added Medicines Vam Development Service Revenue million Forecast, by Type 2020 & 2033
- Table 39: Global Value Added Medicines Vam Development Service Revenue million Forecast, by Country 2020 & 2033
- Table 40: China Value Added Medicines Vam Development Service Revenue (million) Forecast, by Application 2020 & 2033
- Table 41: India Value Added Medicines Vam Development Service Revenue (million) Forecast, by Application 2020 & 2033
- Table 42: Japan Value Added Medicines Vam Development Service Revenue (million) Forecast, by Application 2020 & 2033
- Table 43: South Korea Value Added Medicines Vam Development Service Revenue (million) Forecast, by Application 2020 & 2033
- Table 44: ASEAN Value Added Medicines Vam Development Service Revenue (million) Forecast, by Application 2020 & 2033
- Table 45: Oceania Value Added Medicines Vam Development Service Revenue (million) Forecast, by Application 2020 & 2033
- Table 46: Rest of Asia Pacific Value Added Medicines Vam Development Service Revenue (million) Forecast, by Application 2020 & 2033
Frequently Asked Questions
1. What is the projected Compound Annual Growth Rate (CAGR) of the Value Added Medicines Vam Development Service?
The projected CAGR is approximately 10.5%.
2. Which companies are prominent players in the Value Added Medicines Vam Development Service?
Key companies in the market include Altus Drug Development, TIEFENBACHER GROUP, Hyloris Pharmaceuticals SA, Adamed, Colonis, Towa International, Galenicap, Sandoz AG, Adragos Pharma.
3. What are the main segments of the Value Added Medicines Vam Development Service?
The market segments include Application, Type.
4. Can you provide details about the market size?
The market size is estimated to be USD 1059 million as of 2022.
5. What are some drivers contributing to market growth?
N/A
6. What are the notable trends driving market growth?
N/A
7. Are there any restraints impacting market growth?
N/A
8. Can you provide examples of recent developments in the market?
N/A
9. What pricing options are available for accessing the report?
Pricing options include single-user, multi-user, and enterprise licenses priced at USD 3950.00, USD 5925.00, and USD 7900.00 respectively.
10. Is the market size provided in terms of value or volume?
The market size is provided in terms of value, measured in million.
11. Are there any specific market keywords associated with the report?
Yes, the market keyword associated with the report is "Value Added Medicines Vam Development Service," which aids in identifying and referencing the specific market segment covered.
12. How do I determine which pricing option suits my needs best?
The pricing options vary based on user requirements and access needs. Individual users may opt for single-user licenses, while businesses requiring broader access may choose multi-user or enterprise licenses for cost-effective access to the report.
13. Are there any additional resources or data provided in the Value Added Medicines Vam Development Service report?
While the report offers comprehensive insights, it's advisable to review the specific contents or supplementary materials provided to ascertain if additional resources or data are available.
14. How can I stay updated on further developments or reports in the Value Added Medicines Vam Development Service?
To stay informed about further developments, trends, and reports in the Value Added Medicines Vam Development Service, consider subscribing to industry newsletters, following relevant companies and organizations, or regularly checking reputable industry news sources and publications.
Methodology
Step 1 - Identification of Relevant Samples Size from Population Database


Step 2 - Approaches for Defining Global Market Size (Value, Volume* & Price*)

Note*: In applicable scenarios
Step 3 - Data Sources
Primary Research
- Web Analytics
- Survey Reports
- Research Institute
- Latest Research Reports
- Opinion Leaders
Secondary Research
- Annual Reports
- White Paper
- Latest Press Release
- Industry Association
- Paid Database
- Investor Presentations

Step 4 - Data Triangulation
Involves using different sources of information in order to increase the validity of a study
These sources are likely to be stakeholders in a program - participants, other researchers, program staff, other community members, and so on.
Then we put all data in single framework & apply various statistical tools to find out the dynamic on the market.
During the analysis stage, feedback from the stakeholder groups would be compared to determine areas of agreement as well as areas of divergence