

Key Insights
The Vanadium Redox Battery (VRB) market is poised for significant expansion, driven by the escalating need for advanced, long-duration energy storage solutions. The market is projected to grow at a Compound Annual Growth Rate (CAGR) of 54.94%. With a current market size estimated at 262.45 million in the base year 2025, the VRB industry is set for substantial growth in the coming decade. This growth is propelled by the increasing integration of renewable energy sources such as solar and wind, which necessitate dependable energy storage to counteract intermittency. VRBs, celebrated for their extended lifespan, operational efficiency, and deep discharge capabilities, are ideally suited to meet these demands. Furthermore, global efforts toward decarbonization and climate change mitigation are accelerating investments in sustainable energy storage, thereby bolstering the VRB market. Supportive government initiatives and policies across North America, Europe, and Asia-Pacific are also key catalysts for this expansion. Key end-user segments, including utilities, commercial enterprises, and others, are demonstrating robust demand, with utilities likely to lead due to the requirement for grid-scale storage.
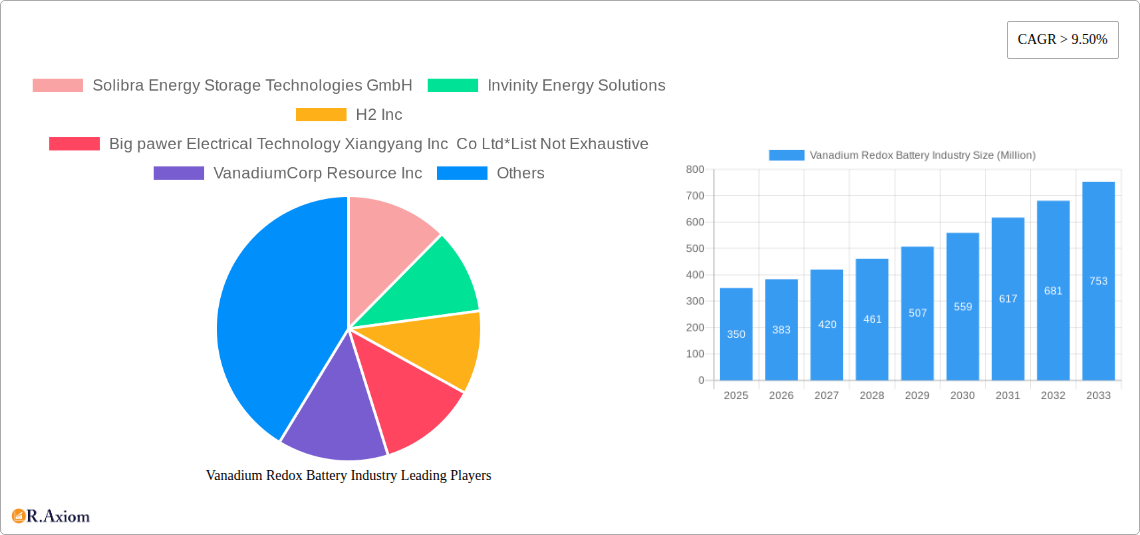
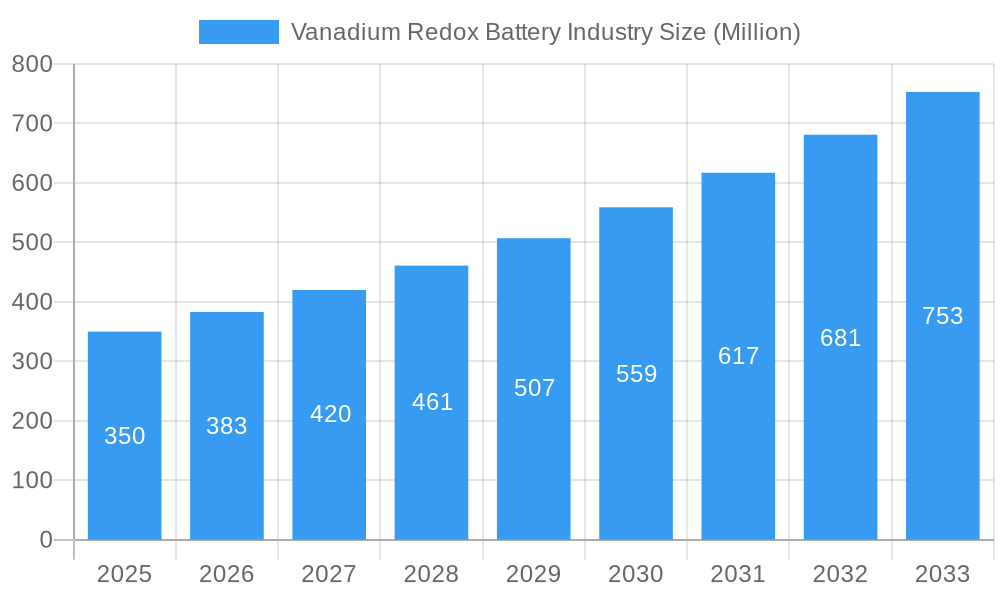
Vanadium Redox Battery Industry Market Size (In Million)
Despite the promising outlook, certain challenges persist. High upfront capital expenditure for VRB systems can present an adoption hurdle, particularly for smaller entities. The availability and cost of vanadium, a critical raw material, may also impact future market dynamics. Continuous technological innovation aimed at reducing costs and enhancing efficiency is vital to overcome these restraints and fully realize the potential of VRB technology. Leading industry participants, including Solibra Energy Storage Technologies GmbH and Invinity Energy Solutions, are actively pursuing innovation and scaling production to address these challenges and secure market share. The sustained growth of the renewable energy sector and favorable governmental frameworks are expected to mitigate these challenges, ensuring a positive long-term trajectory for the VRB industry. Market activity is anticipated to be geographically diverse, reflecting the global imperative for renewable energy integration.
Vanadium Redox Battery Industry Company Market Share
This comprehensive market research report offers an in-depth analysis of the Vanadium Redox Battery (VRB) industry. It covers critical aspects including market size, key growth drivers, prevailing challenges, and significant market players. The report encompasses a study period from 2019 to 2033, with 2025 serving as the base year and 2025-2033 as the forecast period, providing essential insights for stakeholders, investors, and researchers. Utilizing historical data from 2019-2024, the report forecasts future market trends. We project a market value of 262.45 million in 2025, with a CAGR of 54.94% anticipated for the 2025-2033 forecast period.
Vanadium Redox Battery Industry Market Concentration & Innovation
This section analyzes the competitive landscape of the VRB industry, examining market concentration, innovation drivers, regulatory frameworks, substitute products, end-user trends, and merger & acquisition (M&A) activities. The industry is currently characterized by a moderately concentrated market, with several key players vying for market share. However, the entry of new players and technological advancements could lead to increased competition in the coming years. Estimated market share data for 2025 is unavailable (xx%) for Solibra Energy Storage Technologies GmbH, xx% for Invinity Energy Solutions, xx% for H2 Inc, xx% for Big Power Electrical Technology Xiangyang Inc. Co Ltd, xx% for VanadiumCorp Resource Inc, xx% for UniEnergy Technologies, and xx% for VRB Energy. The total M&A deal value in the VRB industry between 2019 and 2024 is estimated at xx Million. Innovation is driven by the need for improved energy storage solutions, particularly for long-duration applications. Regulatory frameworks supporting renewable energy integration are crucial for VRB market growth. Lithium-ion batteries are the main substitute product, but VRBs offer advantages in terms of longevity and safety. End-user trends show a growing demand for long-duration energy storage solutions from the utility sector.
- Key Factors:
- Market concentration analysis (2025)
- Innovation drivers (e.g., improved efficiency, cost reduction)
- Regulatory landscape and its impact
- Analysis of substitute products (e.g., lithium-ion batteries)
- End-user trends and their implications for VRB demand
- M&A activity analysis (deal values and rationale)
Vanadium Redox Battery Industry Industry Trends & Insights
The global Vanadium Redox Battery (VRB) industry is experiencing robust growth, propelled by several key factors. The increasing adoption of renewable energy sources like solar and wind power is a major driver, as VRBs provide reliable and long-duration energy storage solutions to address intermittency issues. Technological advancements, including improvements in cell design, materials science, and manufacturing processes, are further enhancing the performance and reducing the cost of VRB systems. Consumer preference for sustainable and environmentally friendly energy storage solutions is also contributing to market expansion. The competitive landscape is dynamic, with both established players and new entrants vying for market share, resulting in innovation and cost reductions. These factors combine to create a favorable environment for sustained market growth, with a projected compound annual growth rate (CAGR) of xx% during the forecast period (2025-2033), and a market penetration rate of xx% by 2033.
Dominant Markets & Segments in Vanadium Redox Battery Industry
The Utility sector currently dominates the VRB market, driven by the need for large-scale energy storage solutions to support grid stability and integrate renewable energy sources. The Commercial sector is also experiencing significant growth, with VRBs being deployed for backup power and load leveling applications in commercial buildings and industrial facilities. The "Others" segment includes niche applications such as microgrids and off-grid power systems, which are expected to experience moderate growth.
- Key Drivers for Utility Sector Dominance:
- Growing need for grid-scale energy storage.
- Government policies and incentives supporting renewable energy integration.
- Increasing investment in smart grid technologies.
- Key Drivers for Commercial Sector Growth:
- Rising demand for reliable backup power.
- Cost reductions in VRB systems.
- Growing awareness of environmental benefits.
The leading regions for VRB adoption are expected to be North America, Europe, and Asia-Pacific. The dominance of specific countries within these regions is influenced by factors such as government support for renewable energy, the availability of vanadium resources, and the level of technological advancement.
Vanadium Redox Battery Industry Product Developments
Recent product innovations focus on improving energy density, reducing costs, and enhancing system durability. These advancements are expanding the range of applications for VRBs, including grid-scale energy storage, microgrids, and backup power solutions. The competitive advantage lies in offering high-efficiency, long-life, and safe energy storage solutions. Technological trends point towards further improvements in materials science, system integration, and cost optimization, leading to wider market penetration and increased competition.
Report Scope & Segmentation Analysis
This report segments the VRB market based on end-user applications: Utility, Commercial, and Others.
Utility: This segment includes grid-scale energy storage systems deployed by utilities to support grid stability and integrate renewable energy. We project xx Million market value in 2025 for this segment, growing at a CAGR of xx% from 2025-2033. Competition is intense due to the large-scale projects involved.
Commercial: This includes commercial and industrial applications, such as backup power and load leveling. The 2025 market value for this segment is projected at xx Million, with a CAGR of xx% during 2025-2033.
Others: This category encompasses niche applications, such as microgrids and off-grid power systems. This segment represents xx Million in 2025 and a projected CAGR of xx% from 2025-2033.
Key Drivers of Vanadium Redox Battery Industry Growth
Several factors are driving the growth of the VRB industry: the increasing demand for long-duration energy storage solutions to integrate renewable energy sources, ongoing technological advancements leading to improved performance and reduced costs, and supportive government policies and incentives promoting the adoption of renewable energy and energy storage technologies. The growing awareness of environmental concerns and the need for sustainable energy solutions further enhance the appeal of VRBs.
Challenges in the Vanadium Redox Battery Industry Sector
The VRB industry faces challenges, including the relatively high initial capital cost of VRB systems compared to other energy storage technologies, the limited availability of vanadium resources, and the need for further advancements in reducing the cost and improving the efficiency of VRB systems. Supply chain disruptions can also impact production and delivery. Competition from other energy storage technologies like lithium-ion batteries presents another challenge. These factors can lead to slow adoption or limit market growth to a certain extent.
Emerging Opportunities in Vanadium Redox Battery Industry
Emerging opportunities include expanding into new markets such as developing countries with growing renewable energy capacity, the development of hybrid energy storage systems combining VRBs with other technologies, and the exploration of new applications for VRBs, such as grid services and microgrids. Further advancements in materials science, manufacturing processes, and cost reduction strategies will unlock significant growth potential.
Leading Players in the Vanadium Redox Battery Industry Market
- Solibra Energy Storage Technologies GmbH
- Invinity Energy Solutions
- H2 Inc
- Big Power Electrical Technology Xiangyang Inc Co Ltd
- VanadiumCorp Resource Inc
- UniEnergy Technologies
- VRB Energy
Key Developments in Vanadium Redox Battery Industry Industry
November 2022: North Harbour Clean Energy PTY Ltd. and CellCube signed a strategic manufacturing cooperation agreement to build an assembly and manufacturing line in Eastern Australia, targeting an initial production capacity of 40-160 megawatt hours per year, ultimately aiming for up to 8,000 megawatt hours. They also plan to build Australia's largest vanadium flow battery (4-16 megawatt-hours). This significantly expands manufacturing capacity and demonstrates market confidence.
November 2022: The Viejas Tribe of Kumeyaay Indians secured a USD 31 Million grant from the California Energy Commission for a 60 MWh long-duration energy storage system, incorporating a 10 MWh vanadium redox flow battery from Infinity Energy Systems. This project highlights the increasing adoption of VRBs for large-scale energy storage projects and demonstrates the value proposition of VRBs in specific applications.
Strategic Outlook for Vanadium Redox Battery Industry Market
The VRB market is poised for significant growth driven by increasing demand for long-duration energy storage, technological advancements leading to improved performance and cost reductions, and supportive government policies. Further development of vanadium resources, improved efficiency, and cost reductions will make VRBs a more competitive and attractive solution compared to other storage technologies. This will open up new opportunities and drive market expansion across various sectors and geographical regions.
Vanadium Redox Battery Industry Segmentation
-
1. End-User
- 1.1. Utility
- 1.2. Commercial
- 1.3. Others
Vanadium Redox Battery Industry Segmentation By Geography
- 1. North America
- 2. Europe
- 3. Asia Pacific
- 4. South America
- 5. Middle East and Africa
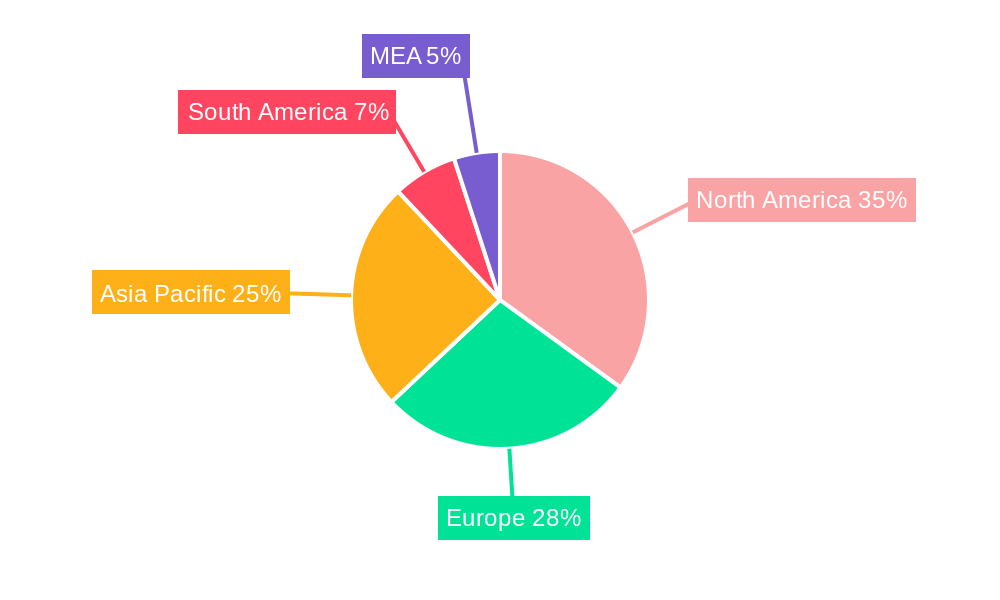
Vanadium Redox Battery Industry Regional Market Share
Geographic Coverage of Vanadium Redox Battery Industry
Vanadium Redox Battery Industry REPORT HIGHLIGHTS
| Aspects | Details |
|---|---|
| Study Period | 2020-2034 |
| Base Year | 2025 |
| Estimated Year | 2026 |
| Forecast Period | 2026-2034 |
| Historical Period | 2020-2025 |
| Growth Rate | CAGR of 54.94% from 2020-2034 |
| Segmentation |
|
Table of Contents
- 1. Introduction
- 1.1. Research Scope
- 1.2. Market Segmentation
- 1.3. Research Objective
- 1.4. Definitions and Assumptions
- 2. Executive Summary
- 2.1. Market Snapshot
- 3. Market Dynamics
- 3.1. Market Drivers
- 3.2. Market Restrains
- 3.3. Market Trends
- 3.4. Market Opportunities
- 4. Market Factor Analysis
- 4.1. Porters Five Forces
- 4.1.1. Bargaining Power of Suppliers
- 4.1.2. Bargaining Power of Buyers
- 4.1.3. Threat of New Entrants
- 4.1.4. Threat of Substitutes
- 4.1.5. Competitive Rivalry
- 4.2. PESTEL analysis
- 4.3. BCG Analysis
- 4.3.1. Stars (High Growth, High Market Share)
- 4.3.2. Cash Cows (Low Growth, High Market Share)
- 4.3.3. Question Mark (High Growth, Low Market Share)
- 4.3.4. Dogs (Low Growth, Low Market Share)
- 4.4. Ansoff Matrix Analysis
- 4.5. Supply Chain Analysis
- 4.6. Regulatory Landscape
- 4.7. Current Market Potential and Opportunity Assessment (TAM–SAM–SOM Framework)
- 4.8. RAX Analyst Note
- 4.1. Porters Five Forces
- 5. Market Analysis, Insights and Forecast 2021-2033
- 5.1. Market Analysis, Insights and Forecast - by End-User
- 5.1.1. Utility
- 5.1.2. Commercial
- 5.1.3. Others
- 5.2. Market Analysis, Insights and Forecast - by Region
- 5.2.1. North America
- 5.2.2. Europe
- 5.2.3. Asia Pacific
- 5.2.4. South America
- 5.2.5. Middle East and Africa
- 5.1. Market Analysis, Insights and Forecast - by End-User
- 6. Global Vanadium Redox Battery Industry Analysis, Insights and Forecast, 2021-2033
- 6.1. Market Analysis, Insights and Forecast - by End-User
- 6.1.1. Utility
- 6.1.2. Commercial
- 6.1.3. Others
- 6.1. Market Analysis, Insights and Forecast - by End-User
- 7. North America Vanadium Redox Battery Industry Analysis, Insights and Forecast, 2020-2032
- 7.1. Market Analysis, Insights and Forecast - by End-User
- 7.1.1. Utility
- 7.1.2. Commercial
- 7.1.3. Others
- 7.1. Market Analysis, Insights and Forecast - by End-User
- 8. Europe Vanadium Redox Battery Industry Analysis, Insights and Forecast, 2020-2032
- 8.1. Market Analysis, Insights and Forecast - by End-User
- 8.1.1. Utility
- 8.1.2. Commercial
- 8.1.3. Others
- 8.1. Market Analysis, Insights and Forecast - by End-User
- 9. Asia Pacific Vanadium Redox Battery Industry Analysis, Insights and Forecast, 2020-2032
- 9.1. Market Analysis, Insights and Forecast - by End-User
- 9.1.1. Utility
- 9.1.2. Commercial
- 9.1.3. Others
- 9.1. Market Analysis, Insights and Forecast - by End-User
- 10. South America Vanadium Redox Battery Industry Analysis, Insights and Forecast, 2020-2032
- 10.1. Market Analysis, Insights and Forecast - by End-User
- 10.1.1. Utility
- 10.1.2. Commercial
- 10.1.3. Others
- 10.1. Market Analysis, Insights and Forecast - by End-User
- 11. Middle East and Africa Vanadium Redox Battery Industry Analysis, Insights and Forecast, 2020-2032
- 11.1. Market Analysis, Insights and Forecast - by End-User
- 11.1.1. Utility
- 11.1.2. Commercial
- 11.1.3. Others
- 11.1. Market Analysis, Insights and Forecast - by End-User
- 12. Competitive Analysis
- 12.1. Company Profiles
- 12.1.1 Solibra Energy Storage Technologies GmbH
- 12.1.1.1. Company Overview
- 12.1.1.2. Products
- 12.1.1.3. Company Financials
- 12.1.1.4. SWOT Analysis
- 12.1.2 Invinity Energy Solutions
- 12.1.2.1. Company Overview
- 12.1.2.2. Products
- 12.1.2.3. Company Financials
- 12.1.2.4. SWOT Analysis
- 12.1.3 H2 Inc
- 12.1.3.1. Company Overview
- 12.1.3.2. Products
- 12.1.3.3. Company Financials
- 12.1.3.4. SWOT Analysis
- 12.1.4 Big pawer Electrical Technology Xiangyang Inc Co Ltd*List Not Exhaustive
- 12.1.4.1. Company Overview
- 12.1.4.2. Products
- 12.1.4.3. Company Financials
- 12.1.4.4. SWOT Analysis
- 12.1.5 VanadiumCorp Resource Inc
- 12.1.5.1. Company Overview
- 12.1.5.2. Products
- 12.1.5.3. Company Financials
- 12.1.5.4. SWOT Analysis
- 12.1.6 UniEnergy Technologies
- 12.1.6.1. Company Overview
- 12.1.6.2. Products
- 12.1.6.3. Company Financials
- 12.1.6.4. SWOT Analysis
- 12.1.7 VRB Energy
- 12.1.7.1. Company Overview
- 12.1.7.2. Products
- 12.1.7.3. Company Financials
- 12.1.7.4. SWOT Analysis
- 12.1.1 Solibra Energy Storage Technologies GmbH
- 12.2. Market Entropy
- 12.2.1 Company's Key Areas Served
- 12.2.2 Recent Developments
- 12.3. Company Market Share Analysis 2025
- 12.3.1 Top 5 Companies Market Share Analysis
- 12.3.2 Top 3 Companies Market Share Analysis
- 12.4. List of Potential Customers
- 13. Research Methodology
List of Figures
- Figure 1: Global Vanadium Redox Battery Industry Revenue Breakdown (million, %) by Region 2025 & 2033
- Figure 2: Global Vanadium Redox Battery Industry Volume Breakdown (K Units, %) by Region 2025 & 2033
- Figure 3: North America Vanadium Redox Battery Industry Revenue (million), by End-User 2025 & 2033
- Figure 4: North America Vanadium Redox Battery Industry Volume (K Units), by End-User 2025 & 2033
- Figure 5: North America Vanadium Redox Battery Industry Revenue Share (%), by End-User 2025 & 2033
- Figure 6: North America Vanadium Redox Battery Industry Volume Share (%), by End-User 2025 & 2033
- Figure 7: North America Vanadium Redox Battery Industry Revenue (million), by Country 2025 & 2033
- Figure 8: North America Vanadium Redox Battery Industry Volume (K Units), by Country 2025 & 2033
- Figure 9: North America Vanadium Redox Battery Industry Revenue Share (%), by Country 2025 & 2033
- Figure 10: North America Vanadium Redox Battery Industry Volume Share (%), by Country 2025 & 2033
- Figure 11: Europe Vanadium Redox Battery Industry Revenue (million), by End-User 2025 & 2033
- Figure 12: Europe Vanadium Redox Battery Industry Volume (K Units), by End-User 2025 & 2033
- Figure 13: Europe Vanadium Redox Battery Industry Revenue Share (%), by End-User 2025 & 2033
- Figure 14: Europe Vanadium Redox Battery Industry Volume Share (%), by End-User 2025 & 2033
- Figure 15: Europe Vanadium Redox Battery Industry Revenue (million), by Country 2025 & 2033
- Figure 16: Europe Vanadium Redox Battery Industry Volume (K Units), by Country 2025 & 2033
- Figure 17: Europe Vanadium Redox Battery Industry Revenue Share (%), by Country 2025 & 2033
- Figure 18: Europe Vanadium Redox Battery Industry Volume Share (%), by Country 2025 & 2033
- Figure 19: Asia Pacific Vanadium Redox Battery Industry Revenue (million), by End-User 2025 & 2033
- Figure 20: Asia Pacific Vanadium Redox Battery Industry Volume (K Units), by End-User 2025 & 2033
- Figure 21: Asia Pacific Vanadium Redox Battery Industry Revenue Share (%), by End-User 2025 & 2033
- Figure 22: Asia Pacific Vanadium Redox Battery Industry Volume Share (%), by End-User 2025 & 2033
- Figure 23: Asia Pacific Vanadium Redox Battery Industry Revenue (million), by Country 2025 & 2033
- Figure 24: Asia Pacific Vanadium Redox Battery Industry Volume (K Units), by Country 2025 & 2033
- Figure 25: Asia Pacific Vanadium Redox Battery Industry Revenue Share (%), by Country 2025 & 2033
- Figure 26: Asia Pacific Vanadium Redox Battery Industry Volume Share (%), by Country 2025 & 2033
- Figure 27: South America Vanadium Redox Battery Industry Revenue (million), by End-User 2025 & 2033
- Figure 28: South America Vanadium Redox Battery Industry Volume (K Units), by End-User 2025 & 2033
- Figure 29: South America Vanadium Redox Battery Industry Revenue Share (%), by End-User 2025 & 2033
- Figure 30: South America Vanadium Redox Battery Industry Volume Share (%), by End-User 2025 & 2033
- Figure 31: South America Vanadium Redox Battery Industry Revenue (million), by Country 2025 & 2033
- Figure 32: South America Vanadium Redox Battery Industry Volume (K Units), by Country 2025 & 2033
- Figure 33: South America Vanadium Redox Battery Industry Revenue Share (%), by Country 2025 & 2033
- Figure 34: South America Vanadium Redox Battery Industry Volume Share (%), by Country 2025 & 2033
- Figure 35: Middle East and Africa Vanadium Redox Battery Industry Revenue (million), by End-User 2025 & 2033
- Figure 36: Middle East and Africa Vanadium Redox Battery Industry Volume (K Units), by End-User 2025 & 2033
- Figure 37: Middle East and Africa Vanadium Redox Battery Industry Revenue Share (%), by End-User 2025 & 2033
- Figure 38: Middle East and Africa Vanadium Redox Battery Industry Volume Share (%), by End-User 2025 & 2033
- Figure 39: Middle East and Africa Vanadium Redox Battery Industry Revenue (million), by Country 2025 & 2033
- Figure 40: Middle East and Africa Vanadium Redox Battery Industry Volume (K Units), by Country 2025 & 2033
- Figure 41: Middle East and Africa Vanadium Redox Battery Industry Revenue Share (%), by Country 2025 & 2033
- Figure 42: Middle East and Africa Vanadium Redox Battery Industry Volume Share (%), by Country 2025 & 2033
List of Tables
- Table 1: Global Vanadium Redox Battery Industry Revenue million Forecast, by End-User 2020 & 2033
- Table 2: Global Vanadium Redox Battery Industry Volume K Units Forecast, by End-User 2020 & 2033
- Table 3: Global Vanadium Redox Battery Industry Revenue million Forecast, by Region 2020 & 2033
- Table 4: Global Vanadium Redox Battery Industry Volume K Units Forecast, by Region 2020 & 2033
- Table 5: Global Vanadium Redox Battery Industry Revenue million Forecast, by End-User 2020 & 2033
- Table 6: Global Vanadium Redox Battery Industry Volume K Units Forecast, by End-User 2020 & 2033
- Table 7: Global Vanadium Redox Battery Industry Revenue million Forecast, by Country 2020 & 2033
- Table 8: Global Vanadium Redox Battery Industry Volume K Units Forecast, by Country 2020 & 2033
- Table 9: Global Vanadium Redox Battery Industry Revenue million Forecast, by End-User 2020 & 2033
- Table 10: Global Vanadium Redox Battery Industry Volume K Units Forecast, by End-User 2020 & 2033
- Table 11: Global Vanadium Redox Battery Industry Revenue million Forecast, by Country 2020 & 2033
- Table 12: Global Vanadium Redox Battery Industry Volume K Units Forecast, by Country 2020 & 2033
- Table 13: Global Vanadium Redox Battery Industry Revenue million Forecast, by End-User 2020 & 2033
- Table 14: Global Vanadium Redox Battery Industry Volume K Units Forecast, by End-User 2020 & 2033
- Table 15: Global Vanadium Redox Battery Industry Revenue million Forecast, by Country 2020 & 2033
- Table 16: Global Vanadium Redox Battery Industry Volume K Units Forecast, by Country 2020 & 2033
- Table 17: Global Vanadium Redox Battery Industry Revenue million Forecast, by End-User 2020 & 2033
- Table 18: Global Vanadium Redox Battery Industry Volume K Units Forecast, by End-User 2020 & 2033
- Table 19: Global Vanadium Redox Battery Industry Revenue million Forecast, by Country 2020 & 2033
- Table 20: Global Vanadium Redox Battery Industry Volume K Units Forecast, by Country 2020 & 2033
- Table 21: Global Vanadium Redox Battery Industry Revenue million Forecast, by End-User 2020 & 2033
- Table 22: Global Vanadium Redox Battery Industry Volume K Units Forecast, by End-User 2020 & 2033
- Table 23: Global Vanadium Redox Battery Industry Revenue million Forecast, by Country 2020 & 2033
- Table 24: Global Vanadium Redox Battery Industry Volume K Units Forecast, by Country 2020 & 2033
Frequently Asked Questions
1. What is the projected Compound Annual Growth Rate (CAGR) of the Vanadium Redox Battery Industry?
The projected CAGR is approximately 54.94%.
2. Which companies are prominent players in the Vanadium Redox Battery Industry?
Key companies in the market include Solibra Energy Storage Technologies GmbH, Invinity Energy Solutions, H2 Inc, Big pawer Electrical Technology Xiangyang Inc Co Ltd*List Not Exhaustive, VanadiumCorp Resource Inc, UniEnergy Technologies, VRB Energy.
3. What are the main segments of the Vanadium Redox Battery Industry?
The market segments include End-User.
4. Can you provide details about the market size?
The market size is estimated to be USD 262.45 million as of 2022.
5. What are some drivers contributing to market growth?
4.; Growing Penetration of the Technology in Long-Duration Energy Storage Applications4.; Increasing Adoption of Renewable Energy.
6. What are the notable trends driving market growth?
Utility Sector to Witness Significant Growth.
7. Are there any restraints impacting market growth?
4.; Low Energy of Battery Cells.
8. Can you provide examples of recent developments in the market?
In November 2022, a strategic manufacturing cooperation agreement was signed between North Harbour Clean Energy PTY Ltd. in Australia and CellCube to build an assembly and manufacturing line in Eastern Australia. A production capacity of 40-160 megawatt hours per year is the initial target on the way to a target of up to 8,000 megawatt hours. In addition, the partners have decided to build Australia's biggest vanadium flow battery, with a capacity of 4 to 16 megawatt-hours.
9. What pricing options are available for accessing the report?
Pricing options include single-user, multi-user, and enterprise licenses priced at USD 4750, USD 5250, and USD 8750 respectively.
10. Is the market size provided in terms of value or volume?
The market size is provided in terms of value, measured in million and volume, measured in K Units.
11. Are there any specific market keywords associated with the report?
Yes, the market keyword associated with the report is "Vanadium Redox Battery Industry," which aids in identifying and referencing the specific market segment covered.
12. How do I determine which pricing option suits my needs best?
The pricing options vary based on user requirements and access needs. Individual users may opt for single-user licenses, while businesses requiring broader access may choose multi-user or enterprise licenses for cost-effective access to the report.
13. Are there any additional resources or data provided in the Vanadium Redox Battery Industry report?
While the report offers comprehensive insights, it's advisable to review the specific contents or supplementary materials provided to ascertain if additional resources or data are available.
14. How can I stay updated on further developments or reports in the Vanadium Redox Battery Industry?
To stay informed about further developments, trends, and reports in the Vanadium Redox Battery Industry, consider subscribing to industry newsletters, following relevant companies and organizations, or regularly checking reputable industry news sources and publications.
Methodology
Step 1 - Identification of Relevant Samples Size from Population Database


Step 2 - Approaches for Defining Global Market Size (Value, Volume* & Price*)

Note*: In applicable scenarios
Step 3 - Data Sources
Primary Research
- Web Analytics
- Survey Reports
- Research Institute
- Latest Research Reports
- Opinion Leaders
Secondary Research
- Annual Reports
- White Paper
- Latest Press Release
- Industry Association
- Paid Database
- Investor Presentations

Step 4 - Data Triangulation
Involves using different sources of information in order to increase the validity of a study
These sources are likely to be stakeholders in a program - participants, other researchers, program staff, other community members, and so on.
Then we put all data in single framework & apply various statistical tools to find out the dynamic on the market.
During the analysis stage, feedback from the stakeholder groups would be compared to determine areas of agreement as well as areas of divergence