
Key Insights
The global vanilla market, valued at $1.04 billion in 2025, is projected to experience robust growth, driven by increasing demand from the food and beverage, personal care, and pharmaceutical sectors. A compound annual growth rate (CAGR) of 8.13% from 2025 to 2033 signifies significant expansion opportunities. Key drivers include the rising popularity of vanilla-flavored products, particularly in developing economies, and the growing consumer preference for natural and organic ingredients. The versatility of vanilla extracts, powders, beans, and pastes across diverse applications further fuels market growth. While supply chain constraints and price fluctuations related to vanilla bean cultivation pose challenges, the market's resilience is supported by continuous innovation in flavor technologies and the development of sustainable sourcing practices. The segment breakdown reveals significant market share held by the food and beverage industry, followed by personal care and cosmetics, demonstrating the wide applicability of vanilla. Major players, including Synthite Industries, B&G Foods, and McCormick & Company, are strategically investing in research and development, capacity expansion, and strategic partnerships to consolidate their market positions and cater to evolving consumer demands. Regional analysis indicates significant growth potential in Asia-Pacific, driven by rising disposable incomes and changing consumer preferences. North America is expected to maintain its leading position due to established consumption patterns and a strong foothold of key market players.
The future growth of the vanilla market hinges on addressing supply chain vulnerabilities and promoting sustainable farming practices. Increased investments in vanilla bean cultivation, particularly in ecologically-friendly methods, will ensure a stable supply to meet the burgeoning demand. Furthermore, innovations focused on developing cost-effective and high-quality vanilla alternatives, alongside exploring new applications in niche markets like pharmaceuticals, will broaden the market’s scope and resilience. The continued trend towards clean-label products and natural ingredients across various sectors presents significant growth opportunities for companies offering sustainably-sourced and high-quality vanilla products. This positions the vanilla market for sustained expansion over the coming years.

Vanilla Industry: A Comprehensive Market Report (2019-2033)
This comprehensive report provides a detailed analysis of the global vanilla industry, covering market size, segmentation, growth drivers, challenges, and key players. The study period spans from 2019 to 2033, with 2025 serving as both the base and estimated year. The forecast period extends from 2025 to 2033, while the historical period encompasses 2019-2024. This report is essential for businesses, investors, and stakeholders seeking actionable insights into this dynamic market. The total market value is projected to reach xx Million by 2033.
Vanilla Industry Market Concentration & Innovation
The vanilla industry exhibits a moderately concentrated market structure, with a few major players holding significant market share. Key players such as Synthite Industries Ltd (Symega), B&G Foods Inc, Nielsen-Massey Vanillas Inc, McCormick & Company Inc, Givaudan SA, PROVA SAS, Symrise AG, Sensient Technologies Corporation, Firmenich SA, and Adams Flavors Foods & Ingredients LLC (list not exhaustive) compete intensely, driving innovation and influencing market dynamics. Market share data for 2024 suggests that the top five players collectively account for approximately 60% of the global market, indicating a significant level of consolidation.
- Market Concentration: High concentration in the production of vanilla beans, leading to price volatility.
- Innovation Drivers: Growing consumer demand for natural and sustainable products, along with the increasing popularity of vanilla-flavored food and beverage products.
- Regulatory Frameworks: Stringent regulations regarding food safety and labeling are impacting the industry's operations.
- Product Substitutes: The availability of artificial vanilla flavorings presents a significant competitive challenge to natural vanilla products.
- End-User Trends: A growing preference for natural and clean-label products, particularly in the food and beverage industry, drives innovation in vanilla production and processing.
- M&A Activities: The last five years witnessed xx Million in M&A activity within the vanilla industry, with several large players acquiring smaller companies to expand their product portfolios and market reach. Specific deal values are not publicly available for all transactions.
Vanilla Industry Industry Trends & Insights
The global vanilla market is experiencing robust growth, driven by several key factors. The CAGR during the historical period (2019-2024) was estimated at xx%, reflecting strong consumer demand for vanilla-flavored products across various segments. The market penetration of vanilla extracts in the food and beverage sector remains significant, and expansion into emerging markets is driving growth. Technological advancements in vanilla extraction and processing, coupled with a rising focus on sustainability, are further shaping market dynamics. Consumer preferences for natural and organic products are positively influencing market growth. The industry is witnessing increasing competition, with companies striving to improve the efficiency of their production processes, thus driving down the cost of vanilla, as a result we are observing reduced prices. Market growth is projected at xx% CAGR during the forecast period (2025-2033), reaching a projected xx Million by 2033.

Dominant Markets & Segments in Vanilla Industry
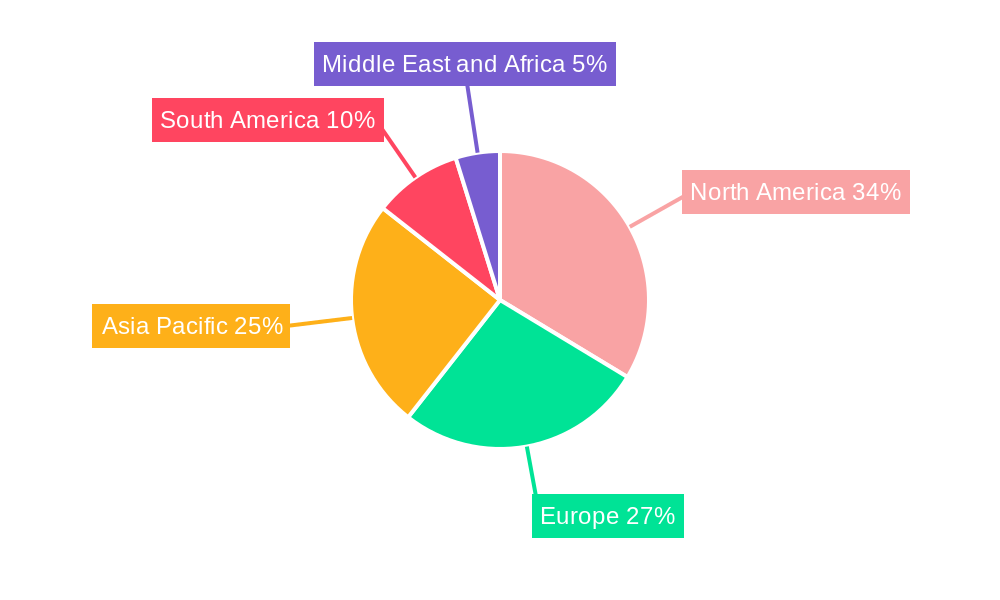
The food and beverage segment dominates the vanilla market, driven by the widespread use of vanilla in various food and beverage products. Geographically, North America and Europe are the leading markets, owing to high per capita consumption and established distribution networks. Within vanilla types, extracts currently hold the largest market share due to their versatility and cost-effectiveness.
- Key Drivers of Food and Beverage Segment Dominance:
- High consumption of vanilla-flavored food and beverages.
- Established distribution networks.
- Large base of established food manufacturing facilities.
- Key Drivers of North America and Europe Dominance:
- High disposable incomes.
- Established food processing industries.
- Strong consumer preference for vanilla-flavored products.
Vanilla Industry Product Developments
Recent product innovations include bio-vanillin offerings like Advanced Biotech’s "Abtvanforall plus natural," which caters to specific manufacturing applications. This highlights the ongoing trend of developing sustainable and natural vanilla alternatives to meet changing consumer demands. Key competitive advantages are focused on product quality, consistency, sustainability, and cost-effectiveness.
Report Scope & Segmentation Analysis
This report segments the vanilla market by type (Bean, Paste and Extracts, Powder) and application (Food and Beverages, Personal Care and Cosmetics, Pharmaceuticals, Retail). Each segment presents unique growth projections and competitive dynamics.
- Type: Bean, Paste and Extracts currently dominate, with steady growth projected for Powder due to convenience.
- Application: Food and Beverages remains the largest segment, however, the Personal Care and Cosmetics sector shows promising growth potential. Pharmaceuticals and Retail present niche opportunities.
Key Drivers of Vanilla Industry Growth
The vanilla industry's growth is fueled by several key factors. Rising consumer demand for natural flavors, technological advancements enabling more efficient production, and increased awareness of the health benefits of vanilla are all significant drivers. Furthermore, regulatory support for sustainable sourcing contributes positively to industry expansion.
Challenges in the Vanilla Industry Sector
The vanilla industry faces various challenges, including volatile vanilla bean prices due to climate change, supply chain complexities, and intense competition from synthetic vanilla alternatives. Regulatory compliance also poses a hurdle to certain players. These challenges collectively impact profitability and market stability.
Emerging Opportunities in Vanilla Industry
Significant opportunities exist in expanding into emerging markets, developing innovative vanilla-based products, and improving sustainable farming practices. The rising popularity of plant-based foods also presents a significant growth avenue for the vanilla industry.
Leading Players in the Vanilla Industry Market
- Synthite Industries Ltd (Symega)
- B&G Foods Inc (B&G Foods)
- Nielsen-Massey Vanillas Inc (Nielsen-Massey)
- McCormick & Company Inc (McCormick)
- Givaudan SA (Givaudan)
- PROVA SAS
- Symrise AG (Symrise)
- Sensient Technologies Corporation (Sensient)
- Firmenich SA (Firmenich)
- Adams Flavors Foods & Ingredients LLC
Key Developments in Vanilla Industry Industry
- December 2021: Advanced Biotech launched 'Abtvanforall plus natural,' a bio-vanillin expanding application in food and beverage.
- August 2021: Vanilla Bean Kings expanded their facilities, boosting production capacity in the US market.
- January 2021: Blue Pacific Flavours introduced Kilimanjaro Vanilla, a sustainable extract catering to clean-label demands.
Strategic Outlook for Vanilla Industry Market
The vanilla industry is poised for continued growth, driven by evolving consumer preferences, technological advancements, and strategic expansions into new markets. The focus on sustainability and the development of innovative products will be crucial for success in the coming years. The market presents significant opportunities for both established players and new entrants.
Vanilla Industry Segmentation
-
1. Type
- 1.1. Bean
- 1.2. Paste and Extracts
- 1.3. Powder
-
2. Application
- 2.1. Food and Beverages
- 2.2. Personal Care and Cosmetics
- 2.3. Pharmaceuticals
- 2.4. Retail
Vanilla Industry Segmentation By Geography
-
1. North America
- 1.1. United States
- 1.2. Canada
- 1.3. Mexico
- 1.4. Rest of North America
-
2. Europe
- 2.1. United Kingdom
- 2.2. Germany
- 2.3. Spain
- 2.4. France
- 2.5. Italy
- 2.6. Russia
- 2.7. Rest of Europe
-
3. Asia Pacific
- 3.1. China
- 3.2. Japan
- 3.3. India
- 3.4. Australia
- 3.5. Rest of Asia Pacific
-
4. South America
- 4.1. Brazil
- 4.2. Argentina
- 4.3. Rest of South America
-
5. Middle East and Africa
- 5.1. SaudI Arabia
- 5.2. South Africa
- 5.3. Rest of Middle East and Africa
Vanilla Industry REPORT HIGHLIGHTS
| Aspects | Details |
|---|---|
| Study Period | 2019-2033 |
| Base Year | 2024 |
| Estimated Year | 2025 |
| Forecast Period | 2025-2033 |
| Historical Period | 2019-2024 |
| Growth Rate | CAGR of 8.13% from 2019-2033 |
| Segmentation |
|
Table of Contents
- 1. Introduction
- 1.1. Research Scope
- 1.2. Market Segmentation
- 1.3. Research Methodology
- 1.4. Definitions and Assumptions
- 2. Executive Summary
- 2.1. Introduction
- 3. Market Dynamics
- 3.1. Introduction
- 3.2. Market Drivers
- 3.2.1. Increasing Focus On Health and Wellness; Surge in Product Innovation
- 3.3. Market Restrains
- 3.3.1. Presence of Substitutes
- 3.4. Market Trends
- 3.4.1. Expanding Demand for Natural/Clean-label Food
- 4. Market Factor Analysis
- 4.1. Porters Five Forces
- 4.2. Supply/Value Chain
- 4.3. PESTEL analysis
- 4.4. Market Entropy
- 4.5. Patent/Trademark Analysis
- 5. Global Vanilla Industry Analysis, Insights and Forecast, 2019-2031
- 5.1. Market Analysis, Insights and Forecast - by Type
- 5.1.1. Bean
- 5.1.2. Paste and Extracts
- 5.1.3. Powder
- 5.2. Market Analysis, Insights and Forecast - by Application
- 5.2.1. Food and Beverages
- 5.2.2. Personal Care and Cosmetics
- 5.2.3. Pharmaceuticals
- 5.2.4. Retail
- 5.3. Market Analysis, Insights and Forecast - by Region
- 5.3.1. North America
- 5.3.2. Europe
- 5.3.3. Asia Pacific
- 5.3.4. South America
- 5.3.5. Middle East and Africa
- 5.1. Market Analysis, Insights and Forecast - by Type
- 6. North America Vanilla Industry Analysis, Insights and Forecast, 2019-2031
- 6.1. Market Analysis, Insights and Forecast - by Type
- 6.1.1. Bean
- 6.1.2. Paste and Extracts
- 6.1.3. Powder
- 6.2. Market Analysis, Insights and Forecast - by Application
- 6.2.1. Food and Beverages
- 6.2.2. Personal Care and Cosmetics
- 6.2.3. Pharmaceuticals
- 6.2.4. Retail
- 6.1. Market Analysis, Insights and Forecast - by Type
- 7. Europe Vanilla Industry Analysis, Insights and Forecast, 2019-2031
- 7.1. Market Analysis, Insights and Forecast - by Type
- 7.1.1. Bean
- 7.1.2. Paste and Extracts
- 7.1.3. Powder
- 7.2. Market Analysis, Insights and Forecast - by Application
- 7.2.1. Food and Beverages
- 7.2.2. Personal Care and Cosmetics
- 7.2.3. Pharmaceuticals
- 7.2.4. Retail
- 7.1. Market Analysis, Insights and Forecast - by Type
- 8. Asia Pacific Vanilla Industry Analysis, Insights and Forecast, 2019-2031
- 8.1. Market Analysis, Insights and Forecast - by Type
- 8.1.1. Bean
- 8.1.2. Paste and Extracts
- 8.1.3. Powder
- 8.2. Market Analysis, Insights and Forecast - by Application
- 8.2.1. Food and Beverages
- 8.2.2. Personal Care and Cosmetics
- 8.2.3. Pharmaceuticals
- 8.2.4. Retail
- 8.1. Market Analysis, Insights and Forecast - by Type
- 9. South America Vanilla Industry Analysis, Insights and Forecast, 2019-2031
- 9.1. Market Analysis, Insights and Forecast - by Type
- 9.1.1. Bean
- 9.1.2. Paste and Extracts
- 9.1.3. Powder
- 9.2. Market Analysis, Insights and Forecast - by Application
- 9.2.1. Food and Beverages
- 9.2.2. Personal Care and Cosmetics
- 9.2.3. Pharmaceuticals
- 9.2.4. Retail
- 9.1. Market Analysis, Insights and Forecast - by Type
- 10. Middle East and Africa Vanilla Industry Analysis, Insights and Forecast, 2019-2031
- 10.1. Market Analysis, Insights and Forecast - by Type
- 10.1.1. Bean
- 10.1.2. Paste and Extracts
- 10.1.3. Powder
- 10.2. Market Analysis, Insights and Forecast - by Application
- 10.2.1. Food and Beverages
- 10.2.2. Personal Care and Cosmetics
- 10.2.3. Pharmaceuticals
- 10.2.4. Retail
- 10.1. Market Analysis, Insights and Forecast - by Type
- 11. North America Vanilla Industry Analysis, Insights and Forecast, 2019-2031
- 11.1. Market Analysis, Insights and Forecast - By Country/Sub-region
- 11.1.1 United States
- 11.1.2 Canada
- 11.1.3 Mexico
- 11.1.4 Rest of North America
- 12. Europe Vanilla Industry Analysis, Insights and Forecast, 2019-2031
- 12.1. Market Analysis, Insights and Forecast - By Country/Sub-region
- 12.1.1 United Kingdom
- 12.1.2 Germany
- 12.1.3 Spain
- 12.1.4 France
- 12.1.5 Italy
- 12.1.6 Russia
- 12.1.7 Rest of Europe
- 13. Asia Pacific Vanilla Industry Analysis, Insights and Forecast, 2019-2031
- 13.1. Market Analysis, Insights and Forecast - By Country/Sub-region
- 13.1.1 China
- 13.1.2 Japan
- 13.1.3 India
- 13.1.4 Australia
- 13.1.5 Rest of Asia Pacific
- 14. South America Vanilla Industry Analysis, Insights and Forecast, 2019-2031
- 14.1. Market Analysis, Insights and Forecast - By Country/Sub-region
- 14.1.1 Brazil
- 14.1.2 Argentina
- 14.1.3 Rest of South America
- 15. Middle East and Africa Vanilla Industry Analysis, Insights and Forecast, 2019-2031
- 15.1. Market Analysis, Insights and Forecast - By Country/Sub-region
- 15.1.1 SaudI Arabia
- 15.1.2 South Africa
- 15.1.3 Rest of Middle East and Africa
- 16. Competitive Analysis
- 16.1. Global Market Share Analysis 2024
- 16.2. Company Profiles
- 16.2.1 Synthite Industries Ltd (Symega)
- 16.2.1.1. Overview
- 16.2.1.2. Products
- 16.2.1.3. SWOT Analysis
- 16.2.1.4. Recent Developments
- 16.2.1.5. Financials (Based on Availability)
- 16.2.2 B&G Foods Inc
- 16.2.2.1. Overview
- 16.2.2.2. Products
- 16.2.2.3. SWOT Analysis
- 16.2.2.4. Recent Developments
- 16.2.2.5. Financials (Based on Availability)
- 16.2.3 Nielsen-Massey Vanillas Inc
- 16.2.3.1. Overview
- 16.2.3.2. Products
- 16.2.3.3. SWOT Analysis
- 16.2.3.4. Recent Developments
- 16.2.3.5. Financials (Based on Availability)
- 16.2.4 McCormick & Company Inc
- 16.2.4.1. Overview
- 16.2.4.2. Products
- 16.2.4.3. SWOT Analysis
- 16.2.4.4. Recent Developments
- 16.2.4.5. Financials (Based on Availability)
- 16.2.5 Givaudan SA
- 16.2.5.1. Overview
- 16.2.5.2. Products
- 16.2.5.3. SWOT Analysis
- 16.2.5.4. Recent Developments
- 16.2.5.5. Financials (Based on Availability)
- 16.2.6 PROVA SAS
- 16.2.6.1. Overview
- 16.2.6.2. Products
- 16.2.6.3. SWOT Analysis
- 16.2.6.4. Recent Developments
- 16.2.6.5. Financials (Based on Availability)
- 16.2.7 Symrise AG
- 16.2.7.1. Overview
- 16.2.7.2. Products
- 16.2.7.3. SWOT Analysis
- 16.2.7.4. Recent Developments
- 16.2.7.5. Financials (Based on Availability)
- 16.2.8 Sensient Technologies Corporation
- 16.2.8.1. Overview
- 16.2.8.2. Products
- 16.2.8.3. SWOT Analysis
- 16.2.8.4. Recent Developments
- 16.2.8.5. Financials (Based on Availability)
- 16.2.9 Firmenich SA*List Not Exhaustive
- 16.2.9.1. Overview
- 16.2.9.2. Products
- 16.2.9.3. SWOT Analysis
- 16.2.9.4. Recent Developments
- 16.2.9.5. Financials (Based on Availability)
- 16.2.10 Adams Flavors Foods & Ingredients LLC
- 16.2.10.1. Overview
- 16.2.10.2. Products
- 16.2.10.3. SWOT Analysis
- 16.2.10.4. Recent Developments
- 16.2.10.5. Financials (Based on Availability)
- 16.2.1 Synthite Industries Ltd (Symega)
List of Figures
- Figure 1: Global Vanilla Industry Revenue Breakdown (Million, %) by Region 2024 & 2032
- Figure 2: North America Vanilla Industry Revenue (Million), by Country 2024 & 2032
- Figure 3: North America Vanilla Industry Revenue Share (%), by Country 2024 & 2032
- Figure 4: Europe Vanilla Industry Revenue (Million), by Country 2024 & 2032
- Figure 5: Europe Vanilla Industry Revenue Share (%), by Country 2024 & 2032
- Figure 6: Asia Pacific Vanilla Industry Revenue (Million), by Country 2024 & 2032
- Figure 7: Asia Pacific Vanilla Industry Revenue Share (%), by Country 2024 & 2032
- Figure 8: South America Vanilla Industry Revenue (Million), by Country 2024 & 2032
- Figure 9: South America Vanilla Industry Revenue Share (%), by Country 2024 & 2032
- Figure 10: Middle East and Africa Vanilla Industry Revenue (Million), by Country 2024 & 2032
- Figure 11: Middle East and Africa Vanilla Industry Revenue Share (%), by Country 2024 & 2032
- Figure 12: North America Vanilla Industry Revenue (Million), by Type 2024 & 2032
- Figure 13: North America Vanilla Industry Revenue Share (%), by Type 2024 & 2032
- Figure 14: North America Vanilla Industry Revenue (Million), by Application 2024 & 2032
- Figure 15: North America Vanilla Industry Revenue Share (%), by Application 2024 & 2032
- Figure 16: North America Vanilla Industry Revenue (Million), by Country 2024 & 2032
- Figure 17: North America Vanilla Industry Revenue Share (%), by Country 2024 & 2032
- Figure 18: Europe Vanilla Industry Revenue (Million), by Type 2024 & 2032
- Figure 19: Europe Vanilla Industry Revenue Share (%), by Type 2024 & 2032
- Figure 20: Europe Vanilla Industry Revenue (Million), by Application 2024 & 2032
- Figure 21: Europe Vanilla Industry Revenue Share (%), by Application 2024 & 2032
- Figure 22: Europe Vanilla Industry Revenue (Million), by Country 2024 & 2032
- Figure 23: Europe Vanilla Industry Revenue Share (%), by Country 2024 & 2032
- Figure 24: Asia Pacific Vanilla Industry Revenue (Million), by Type 2024 & 2032
- Figure 25: Asia Pacific Vanilla Industry Revenue Share (%), by Type 2024 & 2032
- Figure 26: Asia Pacific Vanilla Industry Revenue (Million), by Application 2024 & 2032
- Figure 27: Asia Pacific Vanilla Industry Revenue Share (%), by Application 2024 & 2032
- Figure 28: Asia Pacific Vanilla Industry Revenue (Million), by Country 2024 & 2032
- Figure 29: Asia Pacific Vanilla Industry Revenue Share (%), by Country 2024 & 2032
- Figure 30: South America Vanilla Industry Revenue (Million), by Type 2024 & 2032
- Figure 31: South America Vanilla Industry Revenue Share (%), by Type 2024 & 2032
- Figure 32: South America Vanilla Industry Revenue (Million), by Application 2024 & 2032
- Figure 33: South America Vanilla Industry Revenue Share (%), by Application 2024 & 2032
- Figure 34: South America Vanilla Industry Revenue (Million), by Country 2024 & 2032
- Figure 35: South America Vanilla Industry Revenue Share (%), by Country 2024 & 2032
- Figure 36: Middle East and Africa Vanilla Industry Revenue (Million), by Type 2024 & 2032
- Figure 37: Middle East and Africa Vanilla Industry Revenue Share (%), by Type 2024 & 2032
- Figure 38: Middle East and Africa Vanilla Industry Revenue (Million), by Application 2024 & 2032
- Figure 39: Middle East and Africa Vanilla Industry Revenue Share (%), by Application 2024 & 2032
- Figure 40: Middle East and Africa Vanilla Industry Revenue (Million), by Country 2024 & 2032
- Figure 41: Middle East and Africa Vanilla Industry Revenue Share (%), by Country 2024 & 2032
List of Tables
- Table 1: Global Vanilla Industry Revenue Million Forecast, by Region 2019 & 2032
- Table 2: Global Vanilla Industry Revenue Million Forecast, by Type 2019 & 2032
- Table 3: Global Vanilla Industry Revenue Million Forecast, by Application 2019 & 2032
- Table 4: Global Vanilla Industry Revenue Million Forecast, by Region 2019 & 2032
- Table 5: Global Vanilla Industry Revenue Million Forecast, by Country 2019 & 2032
- Table 6: United States Vanilla Industry Revenue (Million) Forecast, by Application 2019 & 2032
- Table 7: Canada Vanilla Industry Revenue (Million) Forecast, by Application 2019 & 2032
- Table 8: Mexico Vanilla Industry Revenue (Million) Forecast, by Application 2019 & 2032
- Table 9: Rest of North America Vanilla Industry Revenue (Million) Forecast, by Application 2019 & 2032
- Table 10: Global Vanilla Industry Revenue Million Forecast, by Country 2019 & 2032
- Table 11: United Kingdom Vanilla Industry Revenue (Million) Forecast, by Application 2019 & 2032
- Table 12: Germany Vanilla Industry Revenue (Million) Forecast, by Application 2019 & 2032
- Table 13: Spain Vanilla Industry Revenue (Million) Forecast, by Application 2019 & 2032
- Table 14: France Vanilla Industry Revenue (Million) Forecast, by Application 2019 & 2032
- Table 15: Italy Vanilla Industry Revenue (Million) Forecast, by Application 2019 & 2032
- Table 16: Russia Vanilla Industry Revenue (Million) Forecast, by Application 2019 & 2032
- Table 17: Rest of Europe Vanilla Industry Revenue (Million) Forecast, by Application 2019 & 2032
- Table 18: Global Vanilla Industry Revenue Million Forecast, by Country 2019 & 2032
- Table 19: China Vanilla Industry Revenue (Million) Forecast, by Application 2019 & 2032
- Table 20: Japan Vanilla Industry Revenue (Million) Forecast, by Application 2019 & 2032
- Table 21: India Vanilla Industry Revenue (Million) Forecast, by Application 2019 & 2032
- Table 22: Australia Vanilla Industry Revenue (Million) Forecast, by Application 2019 & 2032
- Table 23: Rest of Asia Pacific Vanilla Industry Revenue (Million) Forecast, by Application 2019 & 2032
- Table 24: Global Vanilla Industry Revenue Million Forecast, by Country 2019 & 2032
- Table 25: Brazil Vanilla Industry Revenue (Million) Forecast, by Application 2019 & 2032
- Table 26: Argentina Vanilla Industry Revenue (Million) Forecast, by Application 2019 & 2032
- Table 27: Rest of South America Vanilla Industry Revenue (Million) Forecast, by Application 2019 & 2032
- Table 28: Global Vanilla Industry Revenue Million Forecast, by Country 2019 & 2032
- Table 29: SaudI Arabia Vanilla Industry Revenue (Million) Forecast, by Application 2019 & 2032
- Table 30: South Africa Vanilla Industry Revenue (Million) Forecast, by Application 2019 & 2032
- Table 31: Rest of Middle East and Africa Vanilla Industry Revenue (Million) Forecast, by Application 2019 & 2032
- Table 32: Global Vanilla Industry Revenue Million Forecast, by Type 2019 & 2032
- Table 33: Global Vanilla Industry Revenue Million Forecast, by Application 2019 & 2032
- Table 34: Global Vanilla Industry Revenue Million Forecast, by Country 2019 & 2032
- Table 35: United States Vanilla Industry Revenue (Million) Forecast, by Application 2019 & 2032
- Table 36: Canada Vanilla Industry Revenue (Million) Forecast, by Application 2019 & 2032
- Table 37: Mexico Vanilla Industry Revenue (Million) Forecast, by Application 2019 & 2032
- Table 38: Rest of North America Vanilla Industry Revenue (Million) Forecast, by Application 2019 & 2032
- Table 39: Global Vanilla Industry Revenue Million Forecast, by Type 2019 & 2032
- Table 40: Global Vanilla Industry Revenue Million Forecast, by Application 2019 & 2032
- Table 41: Global Vanilla Industry Revenue Million Forecast, by Country 2019 & 2032
- Table 42: United Kingdom Vanilla Industry Revenue (Million) Forecast, by Application 2019 & 2032
- Table 43: Germany Vanilla Industry Revenue (Million) Forecast, by Application 2019 & 2032
- Table 44: Spain Vanilla Industry Revenue (Million) Forecast, by Application 2019 & 2032
- Table 45: France Vanilla Industry Revenue (Million) Forecast, by Application 2019 & 2032
- Table 46: Italy Vanilla Industry Revenue (Million) Forecast, by Application 2019 & 2032
- Table 47: Russia Vanilla Industry Revenue (Million) Forecast, by Application 2019 & 2032
- Table 48: Rest of Europe Vanilla Industry Revenue (Million) Forecast, by Application 2019 & 2032
- Table 49: Global Vanilla Industry Revenue Million Forecast, by Type 2019 & 2032
- Table 50: Global Vanilla Industry Revenue Million Forecast, by Application 2019 & 2032
- Table 51: Global Vanilla Industry Revenue Million Forecast, by Country 2019 & 2032
- Table 52: China Vanilla Industry Revenue (Million) Forecast, by Application 2019 & 2032
- Table 53: Japan Vanilla Industry Revenue (Million) Forecast, by Application 2019 & 2032
- Table 54: India Vanilla Industry Revenue (Million) Forecast, by Application 2019 & 2032
- Table 55: Australia Vanilla Industry Revenue (Million) Forecast, by Application 2019 & 2032
- Table 56: Rest of Asia Pacific Vanilla Industry Revenue (Million) Forecast, by Application 2019 & 2032
- Table 57: Global Vanilla Industry Revenue Million Forecast, by Type 2019 & 2032
- Table 58: Global Vanilla Industry Revenue Million Forecast, by Application 2019 & 2032
- Table 59: Global Vanilla Industry Revenue Million Forecast, by Country 2019 & 2032
- Table 60: Brazil Vanilla Industry Revenue (Million) Forecast, by Application 2019 & 2032
- Table 61: Argentina Vanilla Industry Revenue (Million) Forecast, by Application 2019 & 2032
- Table 62: Rest of South America Vanilla Industry Revenue (Million) Forecast, by Application 2019 & 2032
- Table 63: Global Vanilla Industry Revenue Million Forecast, by Type 2019 & 2032
- Table 64: Global Vanilla Industry Revenue Million Forecast, by Application 2019 & 2032
- Table 65: Global Vanilla Industry Revenue Million Forecast, by Country 2019 & 2032
- Table 66: SaudI Arabia Vanilla Industry Revenue (Million) Forecast, by Application 2019 & 2032
- Table 67: South Africa Vanilla Industry Revenue (Million) Forecast, by Application 2019 & 2032
- Table 68: Rest of Middle East and Africa Vanilla Industry Revenue (Million) Forecast, by Application 2019 & 2032
Frequently Asked Questions
1. What is the projected Compound Annual Growth Rate (CAGR) of the Vanilla Industry?
The projected CAGR is approximately 8.13%.
2. Which companies are prominent players in the Vanilla Industry?
Key companies in the market include Synthite Industries Ltd (Symega), B&G Foods Inc, Nielsen-Massey Vanillas Inc, McCormick & Company Inc, Givaudan SA, PROVA SAS, Symrise AG, Sensient Technologies Corporation, Firmenich SA*List Not Exhaustive, Adams Flavors Foods & Ingredients LLC.
3. What are the main segments of the Vanilla Industry?
The market segments include Type, Application.
4. Can you provide details about the market size?
The market size is estimated to be USD 1.04 Million as of 2022.
5. What are some drivers contributing to market growth?
Increasing Focus On Health and Wellness; Surge in Product Innovation.
6. What are the notable trends driving market growth?
Expanding Demand for Natural/Clean-label Food.
7. Are there any restraints impacting market growth?
Presence of Substitutes.
8. Can you provide examples of recent developments in the market?
In December 2021, Advanced Biotech launched 'Abtvanforall plus natural,' a bio-vanillin used in alcoholic beverages, baked goods, frozen dairy, and hard candy manufacturing.
9. What pricing options are available for accessing the report?
Pricing options include single-user, multi-user, and enterprise licenses priced at USD 4750, USD 5250, and USD 8750 respectively.
10. Is the market size provided in terms of value or volume?
The market size is provided in terms of value, measured in Million.
11. Are there any specific market keywords associated with the report?
Yes, the market keyword associated with the report is "Vanilla Industry," which aids in identifying and referencing the specific market segment covered.
12. How do I determine which pricing option suits my needs best?
The pricing options vary based on user requirements and access needs. Individual users may opt for single-user licenses, while businesses requiring broader access may choose multi-user or enterprise licenses for cost-effective access to the report.
13. Are there any additional resources or data provided in the Vanilla Industry report?
While the report offers comprehensive insights, it's advisable to review the specific contents or supplementary materials provided to ascertain if additional resources or data are available.
14. How can I stay updated on further developments or reports in the Vanilla Industry?
To stay informed about further developments, trends, and reports in the Vanilla Industry, consider subscribing to industry newsletters, following relevant companies and organizations, or regularly checking reputable industry news sources and publications.
Methodology
Step 1 - Identification of Relevant Samples Size from Population Database


Step 2 - Approaches for Defining Global Market Size (Value, Volume* & Price*)

Note*: In applicable scenarios
Step 3 - Data Sources
Primary Research
- Web Analytics
- Survey Reports
- Research Institute
- Latest Research Reports
- Opinion Leaders
Secondary Research
- Annual Reports
- White Paper
- Latest Press Release
- Industry Association
- Paid Database
- Investor Presentations

Step 4 - Data Triangulation
Involves using different sources of information in order to increase the validity of a study
These sources are likely to be stakeholders in a program - participants, other researchers, program staff, other community members, and so on.
Then we put all data in single framework & apply various statistical tools to find out the dynamic on the market.
During the analysis stage, feedback from the stakeholder groups would be compared to determine areas of agreement as well as areas of divergence


