

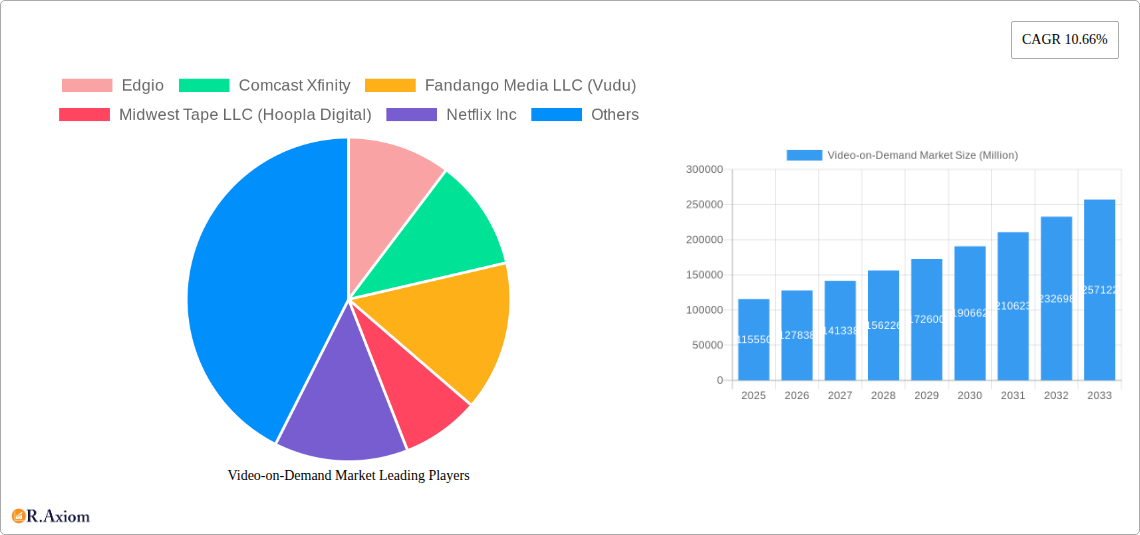
Key Insights
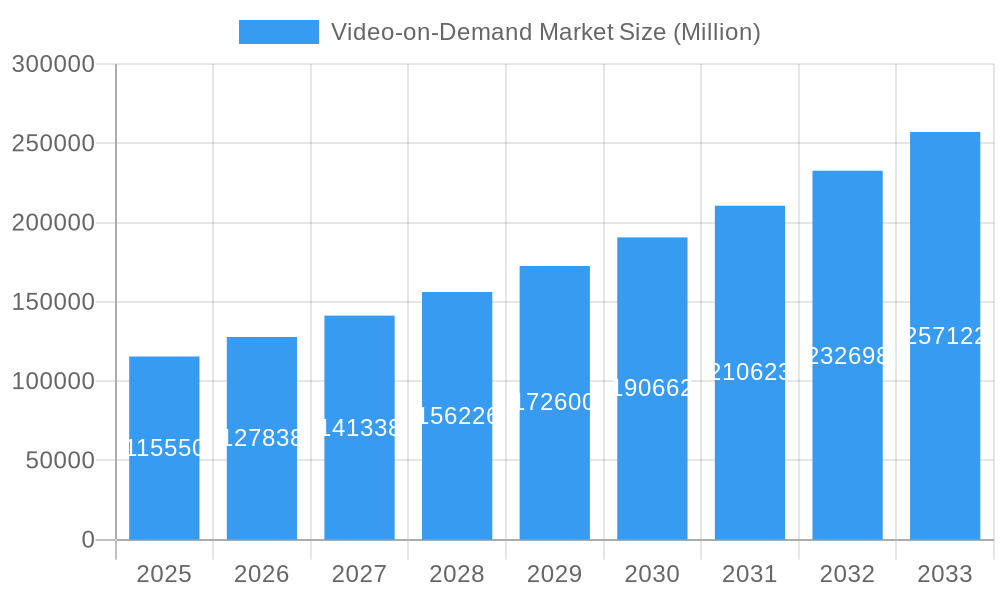
The Video-on-Demand (VOD) market, valued at $115.55 billion in 2025, is projected to experience robust growth, fueled by a Compound Annual Growth Rate (CAGR) of 10.66% from 2025 to 2033. This expansion is driven by several key factors. The increasing affordability and accessibility of high-speed internet, coupled with the rising popularity of streaming services offering diverse content libraries, are major contributors. Furthermore, the shift in consumer viewing habits towards on-demand content, away from traditional linear television, significantly boosts market demand. Technological advancements, such as improved streaming quality and personalized recommendation algorithms, enhance user experience and further propel market growth. The diverse range of business models, including Subscription Video-on-Demand (SVoD), Transactional Video-on-Demand (TVoD), and other emerging models, cater to varied consumer preferences and contribute to market diversification. Competition among established players like Netflix, Disney+, Amazon Prime Video, and emerging services is intense, fostering innovation and driving down prices, benefiting consumers.
Video-on-Demand Market Market Size (In Billion)
However, market growth is not without challenges. Content licensing costs remain a significant hurdle for many players, impacting profitability. The increasing prevalence of piracy and the need to combat it effectively pose a considerable threat. Moreover, regulatory changes and varying levels of internet access across geographical regions can impact market penetration. The market's future success hinges on the ability of providers to offer compelling and diverse content, adapt to evolving consumer preferences, and navigate the complex landscape of content licensing and technological advancements. The continued evolution of business models, incorporating elements such as advertising-supported video-on-demand (AVOD) and interactive features, will play a crucial role in shaping the future of the VOD landscape. Geographic expansion, especially in developing markets with burgeoning internet penetration, presents significant opportunities for growth in the years to come.
Video-on-Demand Market Company Market Share
Video-on-Demand Market: A Comprehensive Report (2019-2033)
This in-depth report provides a comprehensive analysis of the Video-on-Demand (VOD) market, encompassing historical data (2019-2024), current estimates (2025), and future forecasts (2025-2033). It delves into market segmentation, competitive dynamics, technological advancements, and key growth drivers, offering invaluable insights for industry stakeholders, investors, and businesses operating within the rapidly evolving VOD landscape. The report uses Million (M) as the unit for all values.
Video-on-Demand Market Concentration & Innovation
The Video-on-Demand market is characterized by a high degree of concentration, with a few major players commanding significant market share. Netflix Inc., Amazon com Inc. (Amazon Prime Video), and The Walt Disney Company (Disney+) currently dominate the Subscription Video-on-Demand (SVoD) segment. However, the market also exhibits considerable innovation, driven by advancements in streaming technologies, personalized content recommendations, and the increasing adoption of 4K and HDR video.
- Market Concentration: Netflix holds an estimated xx% market share in the global SVoD market in 2025, while Amazon Prime Video and Disney+ hold approximately xx% and xx% respectively. The remaining share is distributed across numerous smaller players.
- Innovation Drivers: The development of high-quality streaming technologies like adaptive bitrate streaming and improvements in compression algorithms are continuously enhancing user experience. AI-powered personalized content recommendations are boosting user engagement, while the rise of immersive video formats like VR and AR offer new avenues for growth.
- Regulatory Frameworks: Government regulations concerning data privacy, content censorship, and net neutrality significantly influence market operations. Variations in regulatory landscapes across different regions create unique challenges and opportunities.
- Product Substitutes: Traditional television broadcasting and physical media still compete with VOD services; however, the convenience and affordability of streaming platforms are eroding their market share.
- End-User Trends: The growing demand for high-quality, on-demand content across multiple devices (smartphones, tablets, smart TVs) is a crucial market driver. Increasing internet penetration and affordability are further fueling market expansion.
- M&A Activities: The VOD market has witnessed significant mergers and acquisitions, with deal values exceeding xxM in the past five years. These transactions reflect industry consolidation and strategic expansion into new markets and technologies. For example, the acquisition of xx company by xx company in 2023 significantly impacted the market dynamics.
Video-on-Demand Market Industry Trends & Insights
The global Video-on-Demand market is experiencing robust growth, with a projected Compound Annual Growth Rate (CAGR) of xx% during the forecast period (2025-2033). This expansion is driven by various factors:
- Market Growth Drivers: Increasing internet penetration, particularly in emerging markets, is fueling the demand for streaming services. Rising disposable incomes and the preference for convenient, on-demand entertainment contribute to market growth.
- Technological Disruptions: Advancements in streaming technologies, including 5G connectivity and improved compression algorithms, enhance viewing experiences and support higher video resolutions. The integration of AI and machine learning in content recommendation systems further enhances user engagement.
- Consumer Preferences: Consumers increasingly prefer on-demand content over traditional linear television, leading to a shift in media consumption habits. The growth of mobile and smart TV viewing is further accelerating this trend.
- Competitive Dynamics: The market is characterized by intense competition among established players and emerging entrants. Competition focuses on content acquisition, technological innovation, and pricing strategies. Market penetration is continuously increasing, with a large portion of the target audience already subscribed to at least one VOD service.
Dominant Markets & Segments in Video-on-Demand Market
The North American region currently dominates the Video-on-Demand market, driven by high internet penetration, high disposable incomes, and a strong preference for online entertainment. Within the business models, the Subscription Video-on-Demand (SVoD) segment holds the largest market share.
- Leading Region: North America
- Leading Segment: Subscription Video-on-Demand (SVoD)
- Key Drivers (SVoD): High internet penetration, strong consumer demand for diverse and high-quality content, and the availability of numerous subscription options. Favorable economic conditions and established digital infrastructure also play significant roles.
- Leading Segment: Transactional Video-on-Demand (TVoD)
- Key Drivers (TVoD): Growing preference for purchasing individual movies or TV shows, offering flexibility to consumers who don’t want a monthly subscription. The expanding library of TVoD content further contributes to its growth.
- Leading Segment: Other Business Models
- Key Drivers (Other): The rise of advertising-supported VOD (AVOD) platforms, offering free content with ads, and the emergence of niche platforms catering to specific demographics or interests. This segment shows immense potential for growth.
Video-on-Demand Market Product Developments
The VOD market witnesses continuous product innovations, driven by technological advancements. Improved compression techniques, support for higher resolutions (4K, 8K), and the incorporation of interactive features are key areas of innovation. The development of user-friendly interfaces and personalized content recommendations contributes to enhanced user experience and boosts user engagement. The rise of multi-device compatibility and the incorporation of AI-powered features are further improving the attractiveness and market fit of VOD services.
Report Scope & Segmentation Analysis
This report segments the Video-on-Demand market by business model:
- Subscription Video-on-demand (SVoD): This segment encompasses services offering unlimited access to content for a recurring fee. Market size in 2025 is estimated at xxM, with a projected CAGR of xx% during the forecast period. Netflix, Amazon Prime Video, and Disney+ are major competitors in this segment.
- Transactional Video-on-demand (TVoD): This segment involves the purchase of individual movies or TV shows. Market size in 2025 is estimated at xxM, with a projected CAGR of xx% during the forecast period. Competition is relatively less intense compared to SVoD, with a diverse range of players.
- Other Business Models: This segment includes advertising-supported video-on-demand (AVOD) and various other models. Market size in 2025 is estimated at xxM, with a projected CAGR of xx% during the forecast period. This segment is growing rapidly with the adoption of diverse content monetization strategies.
Key Drivers of Video-on-Demand Market Growth
Several factors drive the growth of the Video-on-Demand market: rising internet and smartphone penetration globally; increasing disposable incomes, especially in emerging economies; growing consumer preference for on-demand entertainment; technological advancements in streaming, compression, and personalization; and favorable regulatory environments in many regions. The increasing adoption of smart TVs and other connected devices further fuels market expansion.
Challenges in the Video-on-Demand Market Sector
The VOD market faces several challenges: intense competition among existing players and new entrants; high content acquisition costs; the need for continuous technological innovation to maintain competitiveness; content piracy and copyright infringement; and the increasing regulatory scrutiny regarding data privacy and content moderation. These factors can impact revenue streams and profitability in the long term. The fluctuating cost of bandwidth and internet infrastructure can also create obstacles.
Emerging Opportunities in Video-on-Demand Market
Emerging opportunities include the expansion into untapped markets in developing countries, the growing adoption of virtual reality (VR) and augmented reality (AR) for immersive viewing experiences, and the development of personalized content delivery platforms. The integration of AI-powered features, such as automated content tagging and personalized recommendations, offers significant opportunities for enhancing user engagement and revenue generation. The rise of interactive video experiences also presents a unique opportunity for innovative growth.
Leading Players in the Video-on-Demand Market Market
- Edgio
- Comcast Xfinity
- Fandango Media LLC (Vudu)
- Midwest Tape LLC (Hoopla Digital)
- Netflix Inc
- DirecTV
- Vubiquity Inc
- The Walt Disney Company (Disney+)
- DISH Network LLC
- Dacast Inc
- Wistia Inc
- Warner Bros Discovery Inc
- Novi Digital Entertainment Private Limited (Hotstar)
- Hulu LLC
- Fujitsu
- Amazon com Inc (Amazon Prime Video)
- Kaltura
- Popcornflix LLC
- Apple Inc
- Zee Entertainment Enterprises Ltd (Zee5)
Key Developments in Video-on-Demand Market Industry
- June 2022: Amazon Prime Video partnered with AMC Networks to offer its content through Prime Video Channels in India, expanding its content library and market reach.
- January 2023: FOX Entertainment and Hulu announced a multi-year content partnership, significantly impacting Hulu's content offerings and strengthening FOX's streaming presence. This partnership includes in-season streaming rights for FOX programming and a substantial marketing alliance.
Strategic Outlook for Video-on-Demand Market Market
The Video-on-Demand market is poised for continued growth, driven by technological advancements and evolving consumer preferences. Opportunities exist in expanding into new markets, leveraging emerging technologies like VR/AR, and creating more personalized and interactive viewing experiences. The successful players will be those who can effectively balance content acquisition costs, technological innovation, and the delivery of a seamless user experience. The continuous evolution of streaming technology and the demand for high-quality, diverse content will shape the future trajectory of this dynamic market.
Video-on-Demand Market Segmentation
-
1. Business Model
- 1.1. Subscription Video-on-demand (SVoD)
- 1.2. Transactional Video-on-demand (TVoD)
- 1.3. Other Business Models
-
2. End-User
- 2.1. Consumers
- 2.2. Enterprises
-
3. Device Type
- 3.1. Smartphones
- 3.2. Tablets
- 3.3. TVs
-
4. Content Type
- 4.1. Movies
- 4.2. TV Shows
- 4.3. Sports
Video-on-Demand Market Segmentation By Geography
- 1. North America
- 2. Europe
- 3. Asia Pacific
- 4. Middle East and Africa
- 5. Rest of the World
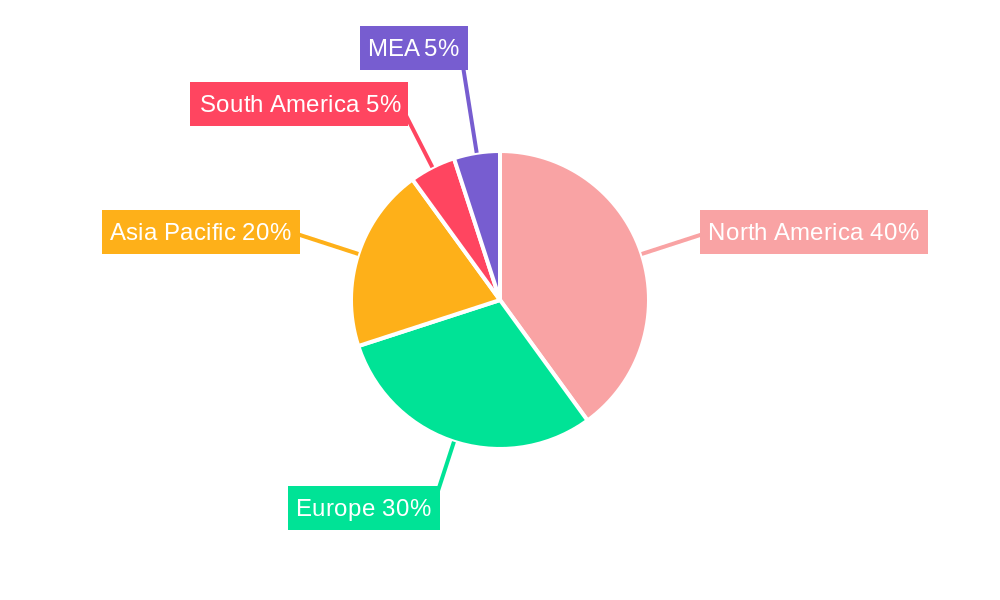
Video-on-Demand Market Regional Market Share
Geographic Coverage of Video-on-Demand Market
Video-on-Demand Market REPORT HIGHLIGHTS
| Aspects | Details |
|---|---|
| Study Period | 2020-2034 |
| Base Year | 2025 |
| Estimated Year | 2026 |
| Forecast Period | 2026-2034 |
| Historical Period | 2020-2025 |
| Growth Rate | CAGR of 10.66% from 2020-2034 |
| Segmentation |
|
Table of Contents
- 1. Introduction
- 1.1. Research Scope
- 1.2. Market Segmentation
- 1.3. Research Objective
- 1.4. Definitions and Assumptions
- 2. Executive Summary
- 2.1. Market Snapshot
- 3. Market Dynamics
- 3.1. Market Drivers
- 3.2. Market Restrains
- 3.3. Market Trends
- 3.4. Market Opportunities
- 4. Market Factor Analysis
- 4.1. Porters Five Forces
- 4.1.1. Bargaining Power of Suppliers
- 4.1.2. Bargaining Power of Buyers
- 4.1.3. Threat of New Entrants
- 4.1.4. Threat of Substitutes
- 4.1.5. Competitive Rivalry
- 4.2. PESTEL analysis
- 4.3. BCG Analysis
- 4.3.1. Stars (High Growth, High Market Share)
- 4.3.2. Cash Cows (Low Growth, High Market Share)
- 4.3.3. Question Mark (High Growth, Low Market Share)
- 4.3.4. Dogs (Low Growth, Low Market Share)
- 4.4. Ansoff Matrix Analysis
- 4.5. Supply Chain Analysis
- 4.6. Regulatory Landscape
- 4.7. Current Market Potential and Opportunity Assessment (TAM–SAM–SOM Framework)
- 4.8. RAX Analyst Note
- 4.1. Porters Five Forces
- 5. Market Analysis, Insights and Forecast 2021-2033
- 5.1. Market Analysis, Insights and Forecast - by Business Model
- 5.1.1. Subscription Video-on-demand (SVoD)
- 5.1.2. Transactional Video-on-demand (TVoD)
- 5.1.3. Other Business Models
- 5.2. Market Analysis, Insights and Forecast - by End-User
- 5.2.1. Consumers
- 5.2.2. Enterprises
- 5.3. Market Analysis, Insights and Forecast - by Device Type
- 5.3.1. Smartphones
- 5.3.2. Tablets
- 5.3.3. TVs
- 5.4. Market Analysis, Insights and Forecast - by Content Type
- 5.4.1. Movies
- 5.4.2. TV Shows
- 5.4.3. Sports
- 5.5. Market Analysis, Insights and Forecast - by Region
- 5.5.1. North America
- 5.5.2. Europe
- 5.5.3. Asia Pacific
- 5.5.4. Middle East and Africa
- 5.5.5. Rest of the World
- 5.1. Market Analysis, Insights and Forecast - by Business Model
- 6. Global Video-on-Demand Market Analysis, Insights and Forecast, 2021-2033
- 6.1. Market Analysis, Insights and Forecast - by Business Model
- 6.1.1. Subscription Video-on-demand (SVoD)
- 6.1.2. Transactional Video-on-demand (TVoD)
- 6.1.3. Other Business Models
- 6.2. Market Analysis, Insights and Forecast - by End-User
- 6.2.1. Consumers
- 6.2.2. Enterprises
- 6.3. Market Analysis, Insights and Forecast - by Device Type
- 6.3.1. Smartphones
- 6.3.2. Tablets
- 6.3.3. TVs
- 6.4. Market Analysis, Insights and Forecast - by Content Type
- 6.4.1. Movies
- 6.4.2. TV Shows
- 6.4.3. Sports
- 6.1. Market Analysis, Insights and Forecast - by Business Model
- 7. North America Video-on-Demand Market Analysis, Insights and Forecast, 2020-2032
- 7.1. Market Analysis, Insights and Forecast - by Business Model
- 7.1.1. Subscription Video-on-demand (SVoD)
- 7.1.2. Transactional Video-on-demand (TVoD)
- 7.1.3. Other Business Models
- 7.2. Market Analysis, Insights and Forecast - by End-User
- 7.2.1. Consumers
- 7.2.2. Enterprises
- 7.3. Market Analysis, Insights and Forecast - by Device Type
- 7.3.1. Smartphones
- 7.3.2. Tablets
- 7.3.3. TVs
- 7.4. Market Analysis, Insights and Forecast - by Content Type
- 7.4.1. Movies
- 7.4.2. TV Shows
- 7.4.3. Sports
- 7.1. Market Analysis, Insights and Forecast - by Business Model
- 8. Europe Video-on-Demand Market Analysis, Insights and Forecast, 2020-2032
- 8.1. Market Analysis, Insights and Forecast - by Business Model
- 8.1.1. Subscription Video-on-demand (SVoD)
- 8.1.2. Transactional Video-on-demand (TVoD)
- 8.1.3. Other Business Models
- 8.2. Market Analysis, Insights and Forecast - by End-User
- 8.2.1. Consumers
- 8.2.2. Enterprises
- 8.3. Market Analysis, Insights and Forecast - by Device Type
- 8.3.1. Smartphones
- 8.3.2. Tablets
- 8.3.3. TVs
- 8.4. Market Analysis, Insights and Forecast - by Content Type
- 8.4.1. Movies
- 8.4.2. TV Shows
- 8.4.3. Sports
- 8.1. Market Analysis, Insights and Forecast - by Business Model
- 9. Asia Pacific Video-on-Demand Market Analysis, Insights and Forecast, 2020-2032
- 9.1. Market Analysis, Insights and Forecast - by Business Model
- 9.1.1. Subscription Video-on-demand (SVoD)
- 9.1.2. Transactional Video-on-demand (TVoD)
- 9.1.3. Other Business Models
- 9.2. Market Analysis, Insights and Forecast - by End-User
- 9.2.1. Consumers
- 9.2.2. Enterprises
- 9.3. Market Analysis, Insights and Forecast - by Device Type
- 9.3.1. Smartphones
- 9.3.2. Tablets
- 9.3.3. TVs
- 9.4. Market Analysis, Insights and Forecast - by Content Type
- 9.4.1. Movies
- 9.4.2. TV Shows
- 9.4.3. Sports
- 9.1. Market Analysis, Insights and Forecast - by Business Model
- 10. Middle East and Africa Video-on-Demand Market Analysis, Insights and Forecast, 2020-2032
- 10.1. Market Analysis, Insights and Forecast - by Business Model
- 10.1.1. Subscription Video-on-demand (SVoD)
- 10.1.2. Transactional Video-on-demand (TVoD)
- 10.1.3. Other Business Models
- 10.2. Market Analysis, Insights and Forecast - by End-User
- 10.2.1. Consumers
- 10.2.2. Enterprises
- 10.3. Market Analysis, Insights and Forecast - by Device Type
- 10.3.1. Smartphones
- 10.3.2. Tablets
- 10.3.3. TVs
- 10.4. Market Analysis, Insights and Forecast - by Content Type
- 10.4.1. Movies
- 10.4.2. TV Shows
- 10.4.3. Sports
- 10.1. Market Analysis, Insights and Forecast - by Business Model
- 11. Rest of the World Video-on-Demand Market Analysis, Insights and Forecast, 2020-2032
- 11.1. Market Analysis, Insights and Forecast - by Business Model
- 11.1.1. Subscription Video-on-demand (SVoD)
- 11.1.2. Transactional Video-on-demand (TVoD)
- 11.1.3. Other Business Models
- 11.2. Market Analysis, Insights and Forecast - by End-User
- 11.2.1. Consumers
- 11.2.2. Enterprises
- 11.3. Market Analysis, Insights and Forecast - by Device Type
- 11.3.1. Smartphones
- 11.3.2. Tablets
- 11.3.3. TVs
- 11.4. Market Analysis, Insights and Forecast - by Content Type
- 11.4.1. Movies
- 11.4.2. TV Shows
- 11.4.3. Sports
- 11.1. Market Analysis, Insights and Forecast - by Business Model
- 12. Competitive Analysis
- 12.1. Company Profiles
- 12.1.1 Edgio
- 12.1.1.1. Company Overview
- 12.1.1.2. Products
- 12.1.1.3. Company Financials
- 12.1.1.4. SWOT Analysis
- 12.1.2 Comcast Xfinity
- 12.1.2.1. Company Overview
- 12.1.2.2. Products
- 12.1.2.3. Company Financials
- 12.1.2.4. SWOT Analysis
- 12.1.3 Fandango Media LLC (Vudu)
- 12.1.3.1. Company Overview
- 12.1.3.2. Products
- 12.1.3.3. Company Financials
- 12.1.3.4. SWOT Analysis
- 12.1.4 Midwest Tape LLC (Hoopla Digital)
- 12.1.4.1. Company Overview
- 12.1.4.2. Products
- 12.1.4.3. Company Financials
- 12.1.4.4. SWOT Analysis
- 12.1.5 Netflix Inc
- 12.1.5.1. Company Overview
- 12.1.5.2. Products
- 12.1.5.3. Company Financials
- 12.1.5.4. SWOT Analysis
- 12.1.6 DirecTV
- 12.1.6.1. Company Overview
- 12.1.6.2. Products
- 12.1.6.3. Company Financials
- 12.1.6.4. SWOT Analysis
- 12.1.7 Vubiquity Inc
- 12.1.7.1. Company Overview
- 12.1.7.2. Products
- 12.1.7.3. Company Financials
- 12.1.7.4. SWOT Analysis
- 12.1.8 The Walt Disney Company (Disney+)
- 12.1.8.1. Company Overview
- 12.1.8.2. Products
- 12.1.8.3. Company Financials
- 12.1.8.4. SWOT Analysis
- 12.1.9 DISH Network LLC
- 12.1.9.1. Company Overview
- 12.1.9.2. Products
- 12.1.9.3. Company Financials
- 12.1.9.4. SWOT Analysis
- 12.1.10 Dacast Inc
- 12.1.10.1. Company Overview
- 12.1.10.2. Products
- 12.1.10.3. Company Financials
- 12.1.10.4. SWOT Analysis
- 12.1.11 Wistia Inc
- 12.1.11.1. Company Overview
- 12.1.11.2. Products
- 12.1.11.3. Company Financials
- 12.1.11.4. SWOT Analysis
- 12.1.12 Warner Bros Discovery Inc
- 12.1.12.1. Company Overview
- 12.1.12.2. Products
- 12.1.12.3. Company Financials
- 12.1.12.4. SWOT Analysis
- 12.1.13 Novi Digital Entertainment Private Limited (Hotstar)
- 12.1.13.1. Company Overview
- 12.1.13.2. Products
- 12.1.13.3. Company Financials
- 12.1.13.4. SWOT Analysis
- 12.1.14 Hulu LLC
- 12.1.14.1. Company Overview
- 12.1.14.2. Products
- 12.1.14.3. Company Financials
- 12.1.14.4. SWOT Analysis
- 12.1.15 Fujitsu
- 12.1.15.1. Company Overview
- 12.1.15.2. Products
- 12.1.15.3. Company Financials
- 12.1.15.4. SWOT Analysis
- 12.1.16 Amazon com Inc (Amazon Prime Video)
- 12.1.16.1. Company Overview
- 12.1.16.2. Products
- 12.1.16.3. Company Financials
- 12.1.16.4. SWOT Analysis
- 12.1.17 Kaltura
- 12.1.17.1. Company Overview
- 12.1.17.2. Products
- 12.1.17.3. Company Financials
- 12.1.17.4. SWOT Analysis
- 12.1.18 Popcornflix LLC
- 12.1.18.1. Company Overview
- 12.1.18.2. Products
- 12.1.18.3. Company Financials
- 12.1.18.4. SWOT Analysis
- 12.1.19 Apple Inc
- 12.1.19.1. Company Overview
- 12.1.19.2. Products
- 12.1.19.3. Company Financials
- 12.1.19.4. SWOT Analysis
- 12.1.20 Zee Entertainment Enterprises Ltd (Zee5)
- 12.1.20.1. Company Overview
- 12.1.20.2. Products
- 12.1.20.3. Company Financials
- 12.1.20.4. SWOT Analysis
- 12.1.1 Edgio
- 12.2. Market Entropy
- 12.2.1 Company's Key Areas Served
- 12.2.2 Recent Developments
- 12.3. Company Market Share Analysis 2025
- 12.3.1 Top 5 Companies Market Share Analysis
- 12.3.2 Top 3 Companies Market Share Analysis
- 12.4. List of Potential Customers
- 13. Research Methodology
List of Figures
- Figure 1: Global Video-on-Demand Market Revenue Breakdown (Million, %) by Region 2025 & 2033
- Figure 2: Global Video-on-Demand Market Volume Breakdown (K Unit, %) by Region 2025 & 2033
- Figure 3: North America Video-on-Demand Market Revenue (Million), by Business Model 2025 & 2033
- Figure 4: North America Video-on-Demand Market Volume (K Unit), by Business Model 2025 & 2033
- Figure 5: North America Video-on-Demand Market Revenue Share (%), by Business Model 2025 & 2033
- Figure 6: North America Video-on-Demand Market Volume Share (%), by Business Model 2025 & 2033
- Figure 7: North America Video-on-Demand Market Revenue (Million), by End-User 2025 & 2033
- Figure 8: North America Video-on-Demand Market Volume (K Unit), by End-User 2025 & 2033
- Figure 9: North America Video-on-Demand Market Revenue Share (%), by End-User 2025 & 2033
- Figure 10: North America Video-on-Demand Market Volume Share (%), by End-User 2025 & 2033
- Figure 11: North America Video-on-Demand Market Revenue (Million), by Device Type 2025 & 2033
- Figure 12: North America Video-on-Demand Market Volume (K Unit), by Device Type 2025 & 2033
- Figure 13: North America Video-on-Demand Market Revenue Share (%), by Device Type 2025 & 2033
- Figure 14: North America Video-on-Demand Market Volume Share (%), by Device Type 2025 & 2033
- Figure 15: North America Video-on-Demand Market Revenue (Million), by Content Type 2025 & 2033
- Figure 16: North America Video-on-Demand Market Volume (K Unit), by Content Type 2025 & 2033
- Figure 17: North America Video-on-Demand Market Revenue Share (%), by Content Type 2025 & 2033
- Figure 18: North America Video-on-Demand Market Volume Share (%), by Content Type 2025 & 2033
- Figure 19: North America Video-on-Demand Market Revenue (Million), by Country 2025 & 2033
- Figure 20: North America Video-on-Demand Market Volume (K Unit), by Country 2025 & 2033
- Figure 21: North America Video-on-Demand Market Revenue Share (%), by Country 2025 & 2033
- Figure 22: North America Video-on-Demand Market Volume Share (%), by Country 2025 & 2033
- Figure 23: Europe Video-on-Demand Market Revenue (Million), by Business Model 2025 & 2033
- Figure 24: Europe Video-on-Demand Market Volume (K Unit), by Business Model 2025 & 2033
- Figure 25: Europe Video-on-Demand Market Revenue Share (%), by Business Model 2025 & 2033
- Figure 26: Europe Video-on-Demand Market Volume Share (%), by Business Model 2025 & 2033
- Figure 27: Europe Video-on-Demand Market Revenue (Million), by End-User 2025 & 2033
- Figure 28: Europe Video-on-Demand Market Volume (K Unit), by End-User 2025 & 2033
- Figure 29: Europe Video-on-Demand Market Revenue Share (%), by End-User 2025 & 2033
- Figure 30: Europe Video-on-Demand Market Volume Share (%), by End-User 2025 & 2033
- Figure 31: Europe Video-on-Demand Market Revenue (Million), by Device Type 2025 & 2033
- Figure 32: Europe Video-on-Demand Market Volume (K Unit), by Device Type 2025 & 2033
- Figure 33: Europe Video-on-Demand Market Revenue Share (%), by Device Type 2025 & 2033
- Figure 34: Europe Video-on-Demand Market Volume Share (%), by Device Type 2025 & 2033
- Figure 35: Europe Video-on-Demand Market Revenue (Million), by Content Type 2025 & 2033
- Figure 36: Europe Video-on-Demand Market Volume (K Unit), by Content Type 2025 & 2033
- Figure 37: Europe Video-on-Demand Market Revenue Share (%), by Content Type 2025 & 2033
- Figure 38: Europe Video-on-Demand Market Volume Share (%), by Content Type 2025 & 2033
- Figure 39: Europe Video-on-Demand Market Revenue (Million), by Country 2025 & 2033
- Figure 40: Europe Video-on-Demand Market Volume (K Unit), by Country 2025 & 2033
- Figure 41: Europe Video-on-Demand Market Revenue Share (%), by Country 2025 & 2033
- Figure 42: Europe Video-on-Demand Market Volume Share (%), by Country 2025 & 2033
- Figure 43: Asia Pacific Video-on-Demand Market Revenue (Million), by Business Model 2025 & 2033
- Figure 44: Asia Pacific Video-on-Demand Market Volume (K Unit), by Business Model 2025 & 2033
- Figure 45: Asia Pacific Video-on-Demand Market Revenue Share (%), by Business Model 2025 & 2033
- Figure 46: Asia Pacific Video-on-Demand Market Volume Share (%), by Business Model 2025 & 2033
- Figure 47: Asia Pacific Video-on-Demand Market Revenue (Million), by End-User 2025 & 2033
- Figure 48: Asia Pacific Video-on-Demand Market Volume (K Unit), by End-User 2025 & 2033
- Figure 49: Asia Pacific Video-on-Demand Market Revenue Share (%), by End-User 2025 & 2033
- Figure 50: Asia Pacific Video-on-Demand Market Volume Share (%), by End-User 2025 & 2033
- Figure 51: Asia Pacific Video-on-Demand Market Revenue (Million), by Device Type 2025 & 2033
- Figure 52: Asia Pacific Video-on-Demand Market Volume (K Unit), by Device Type 2025 & 2033
- Figure 53: Asia Pacific Video-on-Demand Market Revenue Share (%), by Device Type 2025 & 2033
- Figure 54: Asia Pacific Video-on-Demand Market Volume Share (%), by Device Type 2025 & 2033
- Figure 55: Asia Pacific Video-on-Demand Market Revenue (Million), by Content Type 2025 & 2033
- Figure 56: Asia Pacific Video-on-Demand Market Volume (K Unit), by Content Type 2025 & 2033
- Figure 57: Asia Pacific Video-on-Demand Market Revenue Share (%), by Content Type 2025 & 2033
- Figure 58: Asia Pacific Video-on-Demand Market Volume Share (%), by Content Type 2025 & 2033
- Figure 59: Asia Pacific Video-on-Demand Market Revenue (Million), by Country 2025 & 2033
- Figure 60: Asia Pacific Video-on-Demand Market Volume (K Unit), by Country 2025 & 2033
- Figure 61: Asia Pacific Video-on-Demand Market Revenue Share (%), by Country 2025 & 2033
- Figure 62: Asia Pacific Video-on-Demand Market Volume Share (%), by Country 2025 & 2033
- Figure 63: Middle East and Africa Video-on-Demand Market Revenue (Million), by Business Model 2025 & 2033
- Figure 64: Middle East and Africa Video-on-Demand Market Volume (K Unit), by Business Model 2025 & 2033
- Figure 65: Middle East and Africa Video-on-Demand Market Revenue Share (%), by Business Model 2025 & 2033
- Figure 66: Middle East and Africa Video-on-Demand Market Volume Share (%), by Business Model 2025 & 2033
- Figure 67: Middle East and Africa Video-on-Demand Market Revenue (Million), by End-User 2025 & 2033
- Figure 68: Middle East and Africa Video-on-Demand Market Volume (K Unit), by End-User 2025 & 2033
- Figure 69: Middle East and Africa Video-on-Demand Market Revenue Share (%), by End-User 2025 & 2033
- Figure 70: Middle East and Africa Video-on-Demand Market Volume Share (%), by End-User 2025 & 2033
- Figure 71: Middle East and Africa Video-on-Demand Market Revenue (Million), by Device Type 2025 & 2033
- Figure 72: Middle East and Africa Video-on-Demand Market Volume (K Unit), by Device Type 2025 & 2033
- Figure 73: Middle East and Africa Video-on-Demand Market Revenue Share (%), by Device Type 2025 & 2033
- Figure 74: Middle East and Africa Video-on-Demand Market Volume Share (%), by Device Type 2025 & 2033
- Figure 75: Middle East and Africa Video-on-Demand Market Revenue (Million), by Content Type 2025 & 2033
- Figure 76: Middle East and Africa Video-on-Demand Market Volume (K Unit), by Content Type 2025 & 2033
- Figure 77: Middle East and Africa Video-on-Demand Market Revenue Share (%), by Content Type 2025 & 2033
- Figure 78: Middle East and Africa Video-on-Demand Market Volume Share (%), by Content Type 2025 & 2033
- Figure 79: Middle East and Africa Video-on-Demand Market Revenue (Million), by Country 2025 & 2033
- Figure 80: Middle East and Africa Video-on-Demand Market Volume (K Unit), by Country 2025 & 2033
- Figure 81: Middle East and Africa Video-on-Demand Market Revenue Share (%), by Country 2025 & 2033
- Figure 82: Middle East and Africa Video-on-Demand Market Volume Share (%), by Country 2025 & 2033
- Figure 83: Rest of the World Video-on-Demand Market Revenue (Million), by Business Model 2025 & 2033
- Figure 84: Rest of the World Video-on-Demand Market Volume (K Unit), by Business Model 2025 & 2033
- Figure 85: Rest of the World Video-on-Demand Market Revenue Share (%), by Business Model 2025 & 2033
- Figure 86: Rest of the World Video-on-Demand Market Volume Share (%), by Business Model 2025 & 2033
- Figure 87: Rest of the World Video-on-Demand Market Revenue (Million), by End-User 2025 & 2033
- Figure 88: Rest of the World Video-on-Demand Market Volume (K Unit), by End-User 2025 & 2033
- Figure 89: Rest of the World Video-on-Demand Market Revenue Share (%), by End-User 2025 & 2033
- Figure 90: Rest of the World Video-on-Demand Market Volume Share (%), by End-User 2025 & 2033
- Figure 91: Rest of the World Video-on-Demand Market Revenue (Million), by Device Type 2025 & 2033
- Figure 92: Rest of the World Video-on-Demand Market Volume (K Unit), by Device Type 2025 & 2033
- Figure 93: Rest of the World Video-on-Demand Market Revenue Share (%), by Device Type 2025 & 2033
- Figure 94: Rest of the World Video-on-Demand Market Volume Share (%), by Device Type 2025 & 2033
- Figure 95: Rest of the World Video-on-Demand Market Revenue (Million), by Content Type 2025 & 2033
- Figure 96: Rest of the World Video-on-Demand Market Volume (K Unit), by Content Type 2025 & 2033
- Figure 97: Rest of the World Video-on-Demand Market Revenue Share (%), by Content Type 2025 & 2033
- Figure 98: Rest of the World Video-on-Demand Market Volume Share (%), by Content Type 2025 & 2033
- Figure 99: Rest of the World Video-on-Demand Market Revenue (Million), by Country 2025 & 2033
- Figure 100: Rest of the World Video-on-Demand Market Volume (K Unit), by Country 2025 & 2033
- Figure 101: Rest of the World Video-on-Demand Market Revenue Share (%), by Country 2025 & 2033
- Figure 102: Rest of the World Video-on-Demand Market Volume Share (%), by Country 2025 & 2033
List of Tables
- Table 1: Global Video-on-Demand Market Revenue Million Forecast, by Business Model 2020 & 2033
- Table 2: Global Video-on-Demand Market Volume K Unit Forecast, by Business Model 2020 & 2033
- Table 3: Global Video-on-Demand Market Revenue Million Forecast, by End-User 2020 & 2033
- Table 4: Global Video-on-Demand Market Volume K Unit Forecast, by End-User 2020 & 2033
- Table 5: Global Video-on-Demand Market Revenue Million Forecast, by Device Type 2020 & 2033
- Table 6: Global Video-on-Demand Market Volume K Unit Forecast, by Device Type 2020 & 2033
- Table 7: Global Video-on-Demand Market Revenue Million Forecast, by Content Type 2020 & 2033
- Table 8: Global Video-on-Demand Market Volume K Unit Forecast, by Content Type 2020 & 2033
- Table 9: Global Video-on-Demand Market Revenue Million Forecast, by Region 2020 & 2033
- Table 10: Global Video-on-Demand Market Volume K Unit Forecast, by Region 2020 & 2033
- Table 11: Global Video-on-Demand Market Revenue Million Forecast, by Business Model 2020 & 2033
- Table 12: Global Video-on-Demand Market Volume K Unit Forecast, by Business Model 2020 & 2033
- Table 13: Global Video-on-Demand Market Revenue Million Forecast, by End-User 2020 & 2033
- Table 14: Global Video-on-Demand Market Volume K Unit Forecast, by End-User 2020 & 2033
- Table 15: Global Video-on-Demand Market Revenue Million Forecast, by Device Type 2020 & 2033
- Table 16: Global Video-on-Demand Market Volume K Unit Forecast, by Device Type 2020 & 2033
- Table 17: Global Video-on-Demand Market Revenue Million Forecast, by Content Type 2020 & 2033
- Table 18: Global Video-on-Demand Market Volume K Unit Forecast, by Content Type 2020 & 2033
- Table 19: Global Video-on-Demand Market Revenue Million Forecast, by Country 2020 & 2033
- Table 20: Global Video-on-Demand Market Volume K Unit Forecast, by Country 2020 & 2033
- Table 21: Global Video-on-Demand Market Revenue Million Forecast, by Business Model 2020 & 2033
- Table 22: Global Video-on-Demand Market Volume K Unit Forecast, by Business Model 2020 & 2033
- Table 23: Global Video-on-Demand Market Revenue Million Forecast, by End-User 2020 & 2033
- Table 24: Global Video-on-Demand Market Volume K Unit Forecast, by End-User 2020 & 2033
- Table 25: Global Video-on-Demand Market Revenue Million Forecast, by Device Type 2020 & 2033
- Table 26: Global Video-on-Demand Market Volume K Unit Forecast, by Device Type 2020 & 2033
- Table 27: Global Video-on-Demand Market Revenue Million Forecast, by Content Type 2020 & 2033
- Table 28: Global Video-on-Demand Market Volume K Unit Forecast, by Content Type 2020 & 2033
- Table 29: Global Video-on-Demand Market Revenue Million Forecast, by Country 2020 & 2033
- Table 30: Global Video-on-Demand Market Volume K Unit Forecast, by Country 2020 & 2033
- Table 31: Global Video-on-Demand Market Revenue Million Forecast, by Business Model 2020 & 2033
- Table 32: Global Video-on-Demand Market Volume K Unit Forecast, by Business Model 2020 & 2033
- Table 33: Global Video-on-Demand Market Revenue Million Forecast, by End-User 2020 & 2033
- Table 34: Global Video-on-Demand Market Volume K Unit Forecast, by End-User 2020 & 2033
- Table 35: Global Video-on-Demand Market Revenue Million Forecast, by Device Type 2020 & 2033
- Table 36: Global Video-on-Demand Market Volume K Unit Forecast, by Device Type 2020 & 2033
- Table 37: Global Video-on-Demand Market Revenue Million Forecast, by Content Type 2020 & 2033
- Table 38: Global Video-on-Demand Market Volume K Unit Forecast, by Content Type 2020 & 2033
- Table 39: Global Video-on-Demand Market Revenue Million Forecast, by Country 2020 & 2033
- Table 40: Global Video-on-Demand Market Volume K Unit Forecast, by Country 2020 & 2033
- Table 41: Global Video-on-Demand Market Revenue Million Forecast, by Business Model 2020 & 2033
- Table 42: Global Video-on-Demand Market Volume K Unit Forecast, by Business Model 2020 & 2033
- Table 43: Global Video-on-Demand Market Revenue Million Forecast, by End-User 2020 & 2033
- Table 44: Global Video-on-Demand Market Volume K Unit Forecast, by End-User 2020 & 2033
- Table 45: Global Video-on-Demand Market Revenue Million Forecast, by Device Type 2020 & 2033
- Table 46: Global Video-on-Demand Market Volume K Unit Forecast, by Device Type 2020 & 2033
- Table 47: Global Video-on-Demand Market Revenue Million Forecast, by Content Type 2020 & 2033
- Table 48: Global Video-on-Demand Market Volume K Unit Forecast, by Content Type 2020 & 2033
- Table 49: Global Video-on-Demand Market Revenue Million Forecast, by Country 2020 & 2033
- Table 50: Global Video-on-Demand Market Volume K Unit Forecast, by Country 2020 & 2033
- Table 51: Global Video-on-Demand Market Revenue Million Forecast, by Business Model 2020 & 2033
- Table 52: Global Video-on-Demand Market Volume K Unit Forecast, by Business Model 2020 & 2033
- Table 53: Global Video-on-Demand Market Revenue Million Forecast, by End-User 2020 & 2033
- Table 54: Global Video-on-Demand Market Volume K Unit Forecast, by End-User 2020 & 2033
- Table 55: Global Video-on-Demand Market Revenue Million Forecast, by Device Type 2020 & 2033
- Table 56: Global Video-on-Demand Market Volume K Unit Forecast, by Device Type 2020 & 2033
- Table 57: Global Video-on-Demand Market Revenue Million Forecast, by Content Type 2020 & 2033
- Table 58: Global Video-on-Demand Market Volume K Unit Forecast, by Content Type 2020 & 2033
- Table 59: Global Video-on-Demand Market Revenue Million Forecast, by Country 2020 & 2033
- Table 60: Global Video-on-Demand Market Volume K Unit Forecast, by Country 2020 & 2033
Frequently Asked Questions
1. What is the projected Compound Annual Growth Rate (CAGR) of the Video-on-Demand Market?
The projected CAGR is approximately 10.66%.
2. Which companies are prominent players in the Video-on-Demand Market?
Key companies in the market include Edgio, Comcast Xfinity, Fandango Media LLC (Vudu), Midwest Tape LLC (Hoopla Digital), Netflix Inc, DirecTV, Vubiquity Inc, The Walt Disney Company (Disney+), DISH Network LLC, Dacast Inc, Wistia Inc , Warner Bros Discovery Inc, Novi Digital Entertainment Private Limited (Hotstar), Hulu LLC, Fujitsu, Amazon com Inc (Amazon Prime Video), Kaltura, Popcornflix LLC, Apple Inc, Zee Entertainment Enterprises Ltd (Zee5).
3. What are the main segments of the Video-on-Demand Market?
The market segments include Business Model, End-User, Device Type, Content Type.
4. Can you provide details about the market size?
The market size is estimated to be USD 115.55 Million as of 2022.
5. What are some drivers contributing to market growth?
Developments in Digital Video Landscape; Surge in Mobile Based Internet Users.
6. What are the notable trends driving market growth?
Surge in Mobile-based Internet Users to Drive the Market.
7. Are there any restraints impacting market growth?
Growing Threat of Video Content Piracy.
8. Can you provide examples of recent developments in the market?
January 2023: FOX Entertainment and Hulu have announced a multi-year content partnership that includes in-season streaming rights for FOX's extensive programming schedule and a multi-platform strategic marketing alliance. All FOX primetime entertainment programming, from Family Guy and The Cleaning Lady to The Masked Singer and Next Level Chef, are expected to continue to stream on Hulu the day after its linear telecast, according to the terms of the agreement. Furthermore, the agreement includes a significant alliance in which FOX and Hulu branding will coexist across all FOX-owned and external marketing touchpoints to align FOX content's live and on-demand viewing messaging.
9. What pricing options are available for accessing the report?
Pricing options include single-user, multi-user, and enterprise licenses priced at USD 4750, USD 5250, and USD 8750 respectively.
10. Is the market size provided in terms of value or volume?
The market size is provided in terms of value, measured in Million and volume, measured in K Unit.
11. Are there any specific market keywords associated with the report?
Yes, the market keyword associated with the report is "Video-on-Demand Market," which aids in identifying and referencing the specific market segment covered.
12. How do I determine which pricing option suits my needs best?
The pricing options vary based on user requirements and access needs. Individual users may opt for single-user licenses, while businesses requiring broader access may choose multi-user or enterprise licenses for cost-effective access to the report.
13. Are there any additional resources or data provided in the Video-on-Demand Market report?
While the report offers comprehensive insights, it's advisable to review the specific contents or supplementary materials provided to ascertain if additional resources or data are available.
14. How can I stay updated on further developments or reports in the Video-on-Demand Market?
To stay informed about further developments, trends, and reports in the Video-on-Demand Market, consider subscribing to industry newsletters, following relevant companies and organizations, or regularly checking reputable industry news sources and publications.
Methodology
Step 1 - Identification of Relevant Samples Size from Population Database


Step 2 - Approaches for Defining Global Market Size (Value, Volume* & Price*)

Note*: In applicable scenarios
Step 3 - Data Sources
Primary Research
- Web Analytics
- Survey Reports
- Research Institute
- Latest Research Reports
- Opinion Leaders
Secondary Research
- Annual Reports
- White Paper
- Latest Press Release
- Industry Association
- Paid Database
- Investor Presentations

Step 4 - Data Triangulation
Involves using different sources of information in order to increase the validity of a study
These sources are likely to be stakeholders in a program - participants, other researchers, program staff, other community members, and so on.
Then we put all data in single framework & apply various statistical tools to find out the dynamic on the market.
During the analysis stage, feedback from the stakeholder groups would be compared to determine areas of agreement as well as areas of divergence