
Key Insights
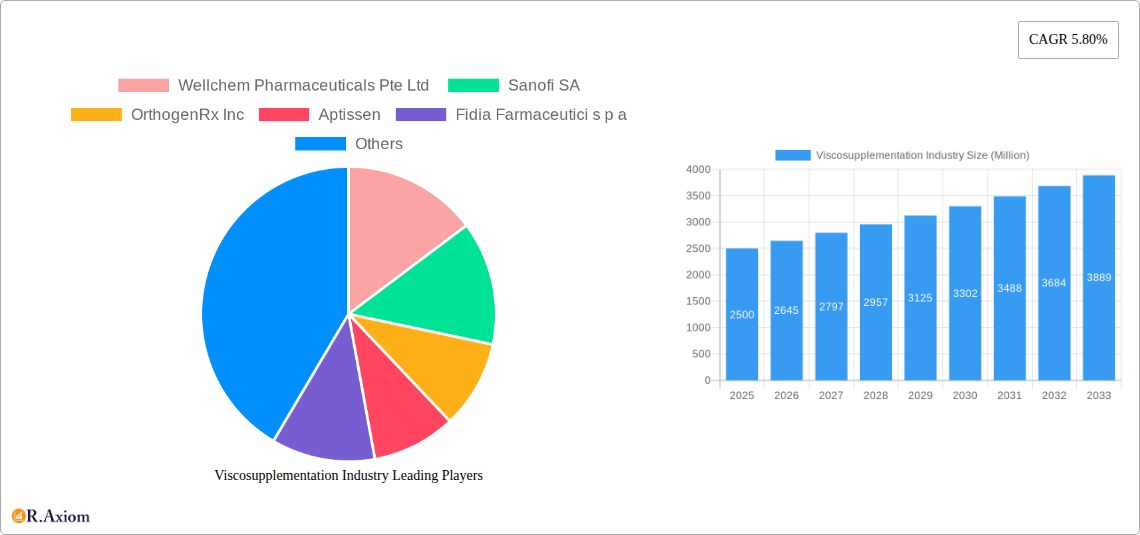
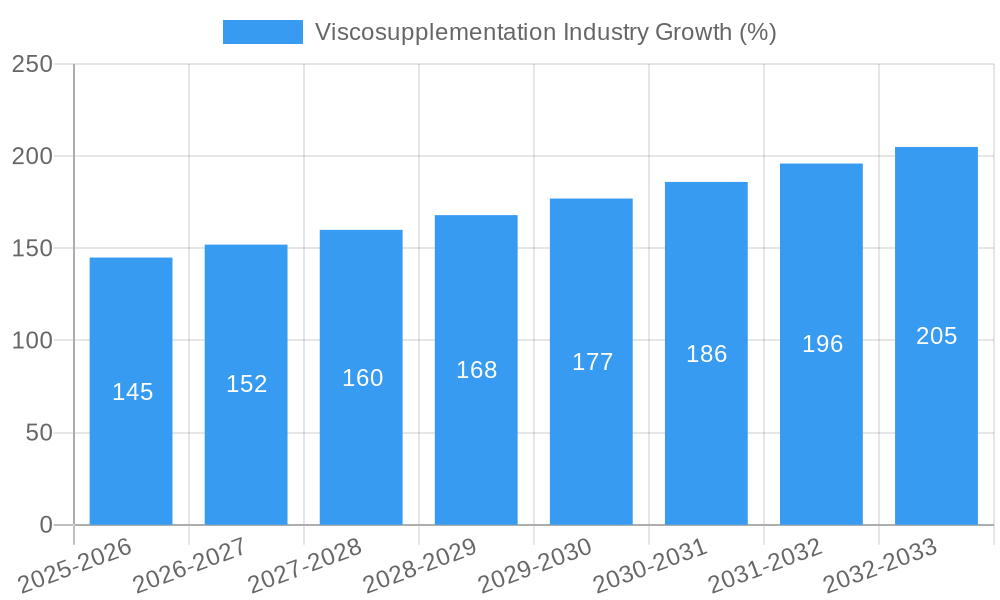
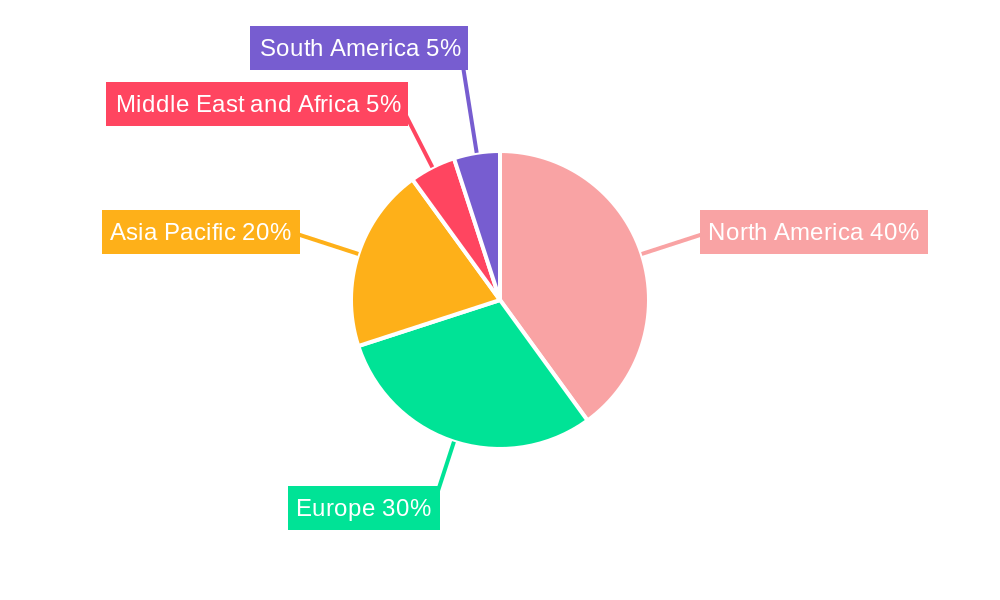
The global viscosupplementation market, valued at approximately $XX million in 2025, is projected to experience robust growth, driven by an increasing geriatric population susceptible to osteoarthritis and a rising prevalence of joint pain and related conditions. The market's Compound Annual Growth Rate (CAGR) of 5.80% from 2019 to 2033 indicates significant expansion opportunities. Key growth drivers include the rising adoption of minimally invasive procedures, increasing awareness of viscosupplementation as a safe and effective treatment option, and technological advancements leading to improved product efficacy and patient outcomes. The market is segmented by dosage (single, three, and five injections), with single-injection products currently holding a larger market share due to their convenience and cost-effectiveness. However, the multi-injection segments are expected to witness substantial growth due to their potential for improved therapeutic outcomes. Different end-users including hospitals, ambulatory surgical centers, and others contribute to the market size, with hospitals currently leading the demand. Leading players such as Sanofi, Johnson & Johnson, and Bioventus are driving innovation and expanding their market presence through strategic partnerships, product launches, and geographical expansion. Geographic distribution reveals a strong presence in North America and Europe, driven by high healthcare expenditure and established healthcare infrastructure. However, the Asia Pacific region is poised for significant growth fueled by increasing disposable incomes and rising healthcare awareness. Market restraints include high treatment costs, potential side effects, and the availability of alternative treatment options.
Despite these restraints, the long-term outlook for the viscosupplementation market remains optimistic. The aging global population, coupled with the growing awareness and adoption of minimally invasive treatments for osteoarthritis and related conditions, are expected to propel market growth throughout the forecast period (2025-2033). Continued research and development efforts focusing on enhanced product efficacy and improved delivery systems will further fuel market expansion. Competitive landscape analysis suggests consolidation amongst key players, with mergers and acquisitions becoming increasingly prevalent as companies strive to strengthen their market position and expand their product portfolios. The increasing focus on personalized medicine and targeted therapies could also positively impact market growth in the coming years.
Viscosupplementation Industry: A Comprehensive Market Report (2019-2033)
This comprehensive report provides an in-depth analysis of the global viscosupplementation industry, offering valuable insights for stakeholders including manufacturers, investors, and healthcare professionals. The report covers the period from 2019 to 2033, with a focus on the forecast period of 2025-2033 and a base year of 2025. The report utilizes extensive market data to project a xx Million USD market value by 2033, exhibiting a robust CAGR of xx% during the forecast period.
Viscosupplementation Industry Market Concentration & Innovation
The viscosupplementation market is characterized by a moderately concentrated landscape, with key players like Sanofi SA, Johnson & Johnson Services Inc, and Bioventus LLC holding significant market share. In 2024, these companies collectively accounted for approximately xx% of the global market. However, the market also features several smaller, specialized players, leading to a dynamic competitive environment. Innovation is driven by the need for improved efficacy, reduced side effects, and the development of novel delivery methods. Regulatory frameworks, such as those set by the FDA and EMA, significantly influence product approvals and market access. The market witnesses considerable M&A activity, with deal values exceeding xx Million USD in the past five years, reflecting the industry's growth potential and strategic consolidation trends. Product substitutes, such as hyaluronic acid injections and surgical interventions, pose competitive challenges. End-user preferences are shifting toward minimally invasive procedures and improved patient outcomes, influencing product development strategies.
- Market Concentration: xx% controlled by top 3 players in 2024.
- M&A Deal Value (2019-2024): > xx Million USD
- Key Innovation Drivers: Improved efficacy, reduced side effects, novel delivery methods.
- Regulatory Influence: Significant impact from FDA and EMA approvals.
Viscosupplementation Industry Industry Trends & Insights
The viscosupplementation market is experiencing significant growth driven by an aging global population, rising prevalence of osteoarthritis, and increasing demand for minimally invasive treatments. Technological advancements, such as the development of more biocompatible and effective viscosupplements, are further propelling market expansion. Consumer preferences favor products with fewer side effects and improved long-term efficacy, shaping the competitive landscape. The market witnesses intense competitive dynamics, with established players investing heavily in R&D and newer entrants focusing on niche segments. Market penetration in developing economies remains low, presenting a significant growth opportunity. The global market is expected to reach xx Million USD by 2033, driven by a CAGR of xx% from 2025 to 2033.
Dominant Markets & Segments in Viscosupplementation Industry
The North American region currently holds the largest market share in the viscosupplementation industry, driven by high prevalence of osteoarthritis, robust healthcare infrastructure, and high healthcare expenditure. Within the dosage segments, the three-injection regimen accounts for the largest share, reflecting the preference for effective, multi-stage treatments. Hospitals represent the dominant end-user segment due to their specialized infrastructure and medical expertise.
- Key Drivers for North American Dominance:
- High prevalence of osteoarthritis
- Developed healthcare infrastructure
- High healthcare expenditure
- Key Drivers for Three-Injection Regimen Dominance:
- Effective multi-stage treatment approach
- Balanced cost-effectiveness
- Key Drivers for Hospital Segment Dominance:
- Specialized infrastructure
- Experienced medical professionals
- Access to advanced diagnostic tools
The dominance of North America and the three-injection segment is further solidified by positive patient outcomes and regulatory support.
Viscosupplementation Industry Product Developments
Recent product innovations include viscosupplements with enhanced biocompatibility, longer-lasting effects, and improved delivery systems. These advancements focus on improving patient comfort and minimizing side effects while maximizing treatment efficacy. The market is also witnessing the introduction of novel formulations and combination therapies, catering to specific patient needs and treatment goals. These innovations are enhancing market competitiveness and accelerating market growth.
Report Scope & Segmentation Analysis
This report comprehensively analyzes the viscosupplementation market across various segments:
Dosage: Single Injection, Three Injection, Five Injection. The three-injection segment is projected to witness the highest growth rate due to its efficacy and cost-effectiveness.
End-User: Hospitals, Ambulatory Surgical Centers, Others. Hospitals remain the dominant segment due to advanced infrastructure.
Each segment is analyzed based on market size, growth projections, and competitive dynamics, providing a granular view of the market structure.
Key Drivers of Viscosupplementation Industry Growth
The viscosupplementation market is propelled by several key drivers: the increasing prevalence of osteoarthritis globally, particularly amongst the aging population; the rising demand for minimally invasive treatment options; advancements in viscosupplement technology, resulting in improved efficacy and reduced side effects; and favorable regulatory approvals and reimbursements for viscosupplementation procedures.
Challenges in the Viscosupplementation Industry Sector
Challenges include high treatment costs limiting access, particularly in developing nations; competition from alternative treatments such as surgery; stringent regulatory pathways for new product approvals; and fluctuations in raw material prices impacting production costs. These factors necessitate innovative solutions and strategic market penetration strategies.
Emerging Opportunities in Viscosupplementation Industry
Emerging opportunities exist in developing economies with rising osteoarthritis prevalence and untapped market potential. Advancements in biocompatible materials, targeted drug delivery systems, and personalized medicine approaches represent significant growth areas. Expanding market access and creating awareness among healthcare professionals will also contribute to market expansion.
Leading Players in the Viscosupplementation Industry Market
- Wellchem Pharmaceuticals Pte Ltd
- Sanofi SA
- OrthogenRx Inc
- Aptissen
- Fidia Farmaceutici s p a
- Anika Therapeutics Inc
- Johnson & Johnson Services Inc
- Ferring Pharmaceuticals
- Bioventus LLC
- Seikagaku Corporation
- Chugai Pharmaceuticals Co Ltd (Roche)
- Zimmer Biomet
Key Developments in Viscosupplementation Industry Industry
- 2022 Q4: Sanofi SA launched a new viscosupplementation product with enhanced efficacy.
- 2023 Q1: Anika Therapeutics Inc. announced a strategic partnership to expand market reach.
- 2024 Q2: Bioventus LLC received FDA approval for a novel viscosupplementation formulation.
- (Further key developments will be detailed in the full report)
Strategic Outlook for Viscosupplementation Industry Market
The viscosupplementation market is poised for substantial growth driven by a burgeoning elderly population and the increasing adoption of minimally invasive procedures. Technological advancements, strategic partnerships, and effective market penetration strategies will be crucial for success. Focusing on personalized medicine and addressing unmet clinical needs will further drive market expansion and competitive differentiation.
Viscosupplementation Industry Segmentation
-
1. Dosage
- 1.1. Single Injection
- 1.2. Three Injection
- 1.3. Five Injection
-
2. End-User
- 2.1. Hospitals
- 2.2. Ambulatory Surgical Centers
- 2.3. Others
Viscosupplementation Industry Segmentation By Geography
-
1. North America
- 1.1. United States
- 1.2. Canada
- 1.3. Mexico
-
2. Europe
- 2.1. Germany
- 2.2. United Kingdom
- 2.3. France
- 2.4. Italy
- 2.5. Spain
- 2.6. Rest of Europe
-
3. Asia Pacific
- 3.1. China
- 3.2. Japan
- 3.3. India
- 3.4. Australia
- 3.5. South Korea
- 3.6. Rest of Asia Pacific
-
4. Middle East and Africa
- 4.1. GCC
- 4.2. South Africa
- 4.3. Rest of Middle East and Africa
-
5. South America
- 5.1. Brazil
- 5.2. Argentina
- 5.3. Rest of South America
Viscosupplementation Industry REPORT HIGHLIGHTS
| Aspects | Details |
|---|---|
| Study Period | 2019-2033 |
| Base Year | 2024 |
| Estimated Year | 2025 |
| Forecast Period | 2025-2033 |
| Historical Period | 2019-2024 |
| Growth Rate | CAGR of 5.80% from 2019-2033 |
| Segmentation |
|
Table of Contents
- 1. Introduction
- 1.1. Research Scope
- 1.2. Market Segmentation
- 1.3. Research Methodology
- 1.4. Definitions and Assumptions
- 2. Executive Summary
- 2.1. Introduction
- 3. Market Dynamics
- 3.1. Introduction
- 3.2. Market Drivers
- 3.2.1. Rising Patient Pool Suffering from Osteoarthritis; Introduction of Advanced and Combination Products
- 3.3. Market Restrains
- 3.3.1. Regulatory Issues and Lack of Awareness
- 3.4. Market Trends
- 3.4.1. Single Injection Segment Expects to Register a High CAGR in the Forecast Period
- 4. Market Factor Analysis
- 4.1. Porters Five Forces
- 4.2. Supply/Value Chain
- 4.3. PESTEL analysis
- 4.4. Market Entropy
- 4.5. Patent/Trademark Analysis
- 5. Global Viscosupplementation Industry Analysis, Insights and Forecast, 2019-2031
- 5.1. Market Analysis, Insights and Forecast - by Dosage
- 5.1.1. Single Injection
- 5.1.2. Three Injection
- 5.1.3. Five Injection
- 5.2. Market Analysis, Insights and Forecast - by End-User
- 5.2.1. Hospitals
- 5.2.2. Ambulatory Surgical Centers
- 5.2.3. Others
- 5.3. Market Analysis, Insights and Forecast - by Region
- 5.3.1. North America
- 5.3.2. Europe
- 5.3.3. Asia Pacific
- 5.3.4. Middle East and Africa
- 5.3.5. South America
- 5.1. Market Analysis, Insights and Forecast - by Dosage
- 6. North America Viscosupplementation Industry Analysis, Insights and Forecast, 2019-2031
- 6.1. Market Analysis, Insights and Forecast - by Dosage
- 6.1.1. Single Injection
- 6.1.2. Three Injection
- 6.1.3. Five Injection
- 6.2. Market Analysis, Insights and Forecast - by End-User
- 6.2.1. Hospitals
- 6.2.2. Ambulatory Surgical Centers
- 6.2.3. Others
- 6.1. Market Analysis, Insights and Forecast - by Dosage
- 7. Europe Viscosupplementation Industry Analysis, Insights and Forecast, 2019-2031
- 7.1. Market Analysis, Insights and Forecast - by Dosage
- 7.1.1. Single Injection
- 7.1.2. Three Injection
- 7.1.3. Five Injection
- 7.2. Market Analysis, Insights and Forecast - by End-User
- 7.2.1. Hospitals
- 7.2.2. Ambulatory Surgical Centers
- 7.2.3. Others
- 7.1. Market Analysis, Insights and Forecast - by Dosage
- 8. Asia Pacific Viscosupplementation Industry Analysis, Insights and Forecast, 2019-2031
- 8.1. Market Analysis, Insights and Forecast - by Dosage
- 8.1.1. Single Injection
- 8.1.2. Three Injection
- 8.1.3. Five Injection
- 8.2. Market Analysis, Insights and Forecast - by End-User
- 8.2.1. Hospitals
- 8.2.2. Ambulatory Surgical Centers
- 8.2.3. Others
- 8.1. Market Analysis, Insights and Forecast - by Dosage
- 9. Middle East and Africa Viscosupplementation Industry Analysis, Insights and Forecast, 2019-2031
- 9.1. Market Analysis, Insights and Forecast - by Dosage
- 9.1.1. Single Injection
- 9.1.2. Three Injection
- 9.1.3. Five Injection
- 9.2. Market Analysis, Insights and Forecast - by End-User
- 9.2.1. Hospitals
- 9.2.2. Ambulatory Surgical Centers
- 9.2.3. Others
- 9.1. Market Analysis, Insights and Forecast - by Dosage
- 10. South America Viscosupplementation Industry Analysis, Insights and Forecast, 2019-2031
- 10.1. Market Analysis, Insights and Forecast - by Dosage
- 10.1.1. Single Injection
- 10.1.2. Three Injection
- 10.1.3. Five Injection
- 10.2. Market Analysis, Insights and Forecast - by End-User
- 10.2.1. Hospitals
- 10.2.2. Ambulatory Surgical Centers
- 10.2.3. Others
- 10.1. Market Analysis, Insights and Forecast - by Dosage
- 11. North America Viscosupplementation Industry Analysis, Insights and Forecast, 2019-2031
- 11.1. Market Analysis, Insights and Forecast - By Country/Sub-region
- 11.1.1. undefined
- 12. Europe Viscosupplementation Industry Analysis, Insights and Forecast, 2019-2031
- 12.1. Market Analysis, Insights and Forecast - By Country/Sub-region
- 12.1.1. undefined
- 13. Asia Pacific Viscosupplementation Industry Analysis, Insights and Forecast, 2019-2031
- 13.1. Market Analysis, Insights and Forecast - By Country/Sub-region
- 13.1.1. undefined
- 14. Middle East and Africa Viscosupplementation Industry Analysis, Insights and Forecast, 2019-2031
- 14.1. Market Analysis, Insights and Forecast - By Country/Sub-region
- 14.1.1. undefined
- 15. South America Viscosupplementation Industry Analysis, Insights and Forecast, 2019-2031
- 15.1. Market Analysis, Insights and Forecast - By Country/Sub-region
- 15.1.1. undefined
- 16. Competitive Analysis
- 16.1. Global Market Share Analysis 2024
- 16.2. Company Profiles
- 16.2.1 Wellchem Pharmaceuticals Pte Ltd
- 16.2.1.1. Overview
- 16.2.1.2. Products
- 16.2.1.3. SWOT Analysis
- 16.2.1.4. Recent Developments
- 16.2.1.5. Financials (Based on Availability)
- 16.2.2 Sanofi SA
- 16.2.2.1. Overview
- 16.2.2.2. Products
- 16.2.2.3. SWOT Analysis
- 16.2.2.4. Recent Developments
- 16.2.2.5. Financials (Based on Availability)
- 16.2.3 OrthogenRx Inc
- 16.2.3.1. Overview
- 16.2.3.2. Products
- 16.2.3.3. SWOT Analysis
- 16.2.3.4. Recent Developments
- 16.2.3.5. Financials (Based on Availability)
- 16.2.4 Aptissen
- 16.2.4.1. Overview
- 16.2.4.2. Products
- 16.2.4.3. SWOT Analysis
- 16.2.4.4. Recent Developments
- 16.2.4.5. Financials (Based on Availability)
- 16.2.5 Fidia Farmaceutici s p a
- 16.2.5.1. Overview
- 16.2.5.2. Products
- 16.2.5.3. SWOT Analysis
- 16.2.5.4. Recent Developments
- 16.2.5.5. Financials (Based on Availability)
- 16.2.6 Anika Therapeutics Inc
- 16.2.6.1. Overview
- 16.2.6.2. Products
- 16.2.6.3. SWOT Analysis
- 16.2.6.4. Recent Developments
- 16.2.6.5. Financials (Based on Availability)
- 16.2.7 Johnson & Johnson Services Inc
- 16.2.7.1. Overview
- 16.2.7.2. Products
- 16.2.7.3. SWOT Analysis
- 16.2.7.4. Recent Developments
- 16.2.7.5. Financials (Based on Availability)
- 16.2.8 Ferring Pharmaceuticals
- 16.2.8.1. Overview
- 16.2.8.2. Products
- 16.2.8.3. SWOT Analysis
- 16.2.8.4. Recent Developments
- 16.2.8.5. Financials (Based on Availability)
- 16.2.9 Bioventus LLC
- 16.2.9.1. Overview
- 16.2.9.2. Products
- 16.2.9.3. SWOT Analysis
- 16.2.9.4. Recent Developments
- 16.2.9.5. Financials (Based on Availability)
- 16.2.10 Seikagaku Corporation
- 16.2.10.1. Overview
- 16.2.10.2. Products
- 16.2.10.3. SWOT Analysis
- 16.2.10.4. Recent Developments
- 16.2.10.5. Financials (Based on Availability)
- 16.2.11 Chugai Pharmaceuticals Co Ltd (Roche)
- 16.2.11.1. Overview
- 16.2.11.2. Products
- 16.2.11.3. SWOT Analysis
- 16.2.11.4. Recent Developments
- 16.2.11.5. Financials (Based on Availability)
- 16.2.12 Zimmer Biomet
- 16.2.12.1. Overview
- 16.2.12.2. Products
- 16.2.12.3. SWOT Analysis
- 16.2.12.4. Recent Developments
- 16.2.12.5. Financials (Based on Availability)
- 16.2.1 Wellchem Pharmaceuticals Pte Ltd
List of Figures
- Figure 1: Global Viscosupplementation Industry Revenue Breakdown (Million, %) by Region 2024 & 2032
- Figure 2: Global Viscosupplementation Industry Volume Breakdown (K Unit, %) by Region 2024 & 2032
- Figure 3: North America Viscosupplementation Industry Revenue (Million), by Country 2024 & 2032
- Figure 4: North America Viscosupplementation Industry Volume (K Unit), by Country 2024 & 2032
- Figure 5: North America Viscosupplementation Industry Revenue Share (%), by Country 2024 & 2032
- Figure 6: North America Viscosupplementation Industry Volume Share (%), by Country 2024 & 2032
- Figure 7: Europe Viscosupplementation Industry Revenue (Million), by Country 2024 & 2032
- Figure 8: Europe Viscosupplementation Industry Volume (K Unit), by Country 2024 & 2032
- Figure 9: Europe Viscosupplementation Industry Revenue Share (%), by Country 2024 & 2032
- Figure 10: Europe Viscosupplementation Industry Volume Share (%), by Country 2024 & 2032
- Figure 11: Asia Pacific Viscosupplementation Industry Revenue (Million), by Country 2024 & 2032
- Figure 12: Asia Pacific Viscosupplementation Industry Volume (K Unit), by Country 2024 & 2032
- Figure 13: Asia Pacific Viscosupplementation Industry Revenue Share (%), by Country 2024 & 2032
- Figure 14: Asia Pacific Viscosupplementation Industry Volume Share (%), by Country 2024 & 2032
- Figure 15: Middle East and Africa Viscosupplementation Industry Revenue (Million), by Country 2024 & 2032
- Figure 16: Middle East and Africa Viscosupplementation Industry Volume (K Unit), by Country 2024 & 2032
- Figure 17: Middle East and Africa Viscosupplementation Industry Revenue Share (%), by Country 2024 & 2032
- Figure 18: Middle East and Africa Viscosupplementation Industry Volume Share (%), by Country 2024 & 2032
- Figure 19: South America Viscosupplementation Industry Revenue (Million), by Country 2024 & 2032
- Figure 20: South America Viscosupplementation Industry Volume (K Unit), by Country 2024 & 2032
- Figure 21: South America Viscosupplementation Industry Revenue Share (%), by Country 2024 & 2032
- Figure 22: South America Viscosupplementation Industry Volume Share (%), by Country 2024 & 2032
- Figure 23: North America Viscosupplementation Industry Revenue (Million), by Dosage 2024 & 2032
- Figure 24: North America Viscosupplementation Industry Volume (K Unit), by Dosage 2024 & 2032
- Figure 25: North America Viscosupplementation Industry Revenue Share (%), by Dosage 2024 & 2032
- Figure 26: North America Viscosupplementation Industry Volume Share (%), by Dosage 2024 & 2032
- Figure 27: North America Viscosupplementation Industry Revenue (Million), by End-User 2024 & 2032
- Figure 28: North America Viscosupplementation Industry Volume (K Unit), by End-User 2024 & 2032
- Figure 29: North America Viscosupplementation Industry Revenue Share (%), by End-User 2024 & 2032
- Figure 30: North America Viscosupplementation Industry Volume Share (%), by End-User 2024 & 2032
- Figure 31: North America Viscosupplementation Industry Revenue (Million), by Country 2024 & 2032
- Figure 32: North America Viscosupplementation Industry Volume (K Unit), by Country 2024 & 2032
- Figure 33: North America Viscosupplementation Industry Revenue Share (%), by Country 2024 & 2032
- Figure 34: North America Viscosupplementation Industry Volume Share (%), by Country 2024 & 2032
- Figure 35: Europe Viscosupplementation Industry Revenue (Million), by Dosage 2024 & 2032
- Figure 36: Europe Viscosupplementation Industry Volume (K Unit), by Dosage 2024 & 2032
- Figure 37: Europe Viscosupplementation Industry Revenue Share (%), by Dosage 2024 & 2032
- Figure 38: Europe Viscosupplementation Industry Volume Share (%), by Dosage 2024 & 2032
- Figure 39: Europe Viscosupplementation Industry Revenue (Million), by End-User 2024 & 2032
- Figure 40: Europe Viscosupplementation Industry Volume (K Unit), by End-User 2024 & 2032
- Figure 41: Europe Viscosupplementation Industry Revenue Share (%), by End-User 2024 & 2032
- Figure 42: Europe Viscosupplementation Industry Volume Share (%), by End-User 2024 & 2032
- Figure 43: Europe Viscosupplementation Industry Revenue (Million), by Country 2024 & 2032
- Figure 44: Europe Viscosupplementation Industry Volume (K Unit), by Country 2024 & 2032
- Figure 45: Europe Viscosupplementation Industry Revenue Share (%), by Country 2024 & 2032
- Figure 46: Europe Viscosupplementation Industry Volume Share (%), by Country 2024 & 2032
- Figure 47: Asia Pacific Viscosupplementation Industry Revenue (Million), by Dosage 2024 & 2032
- Figure 48: Asia Pacific Viscosupplementation Industry Volume (K Unit), by Dosage 2024 & 2032
- Figure 49: Asia Pacific Viscosupplementation Industry Revenue Share (%), by Dosage 2024 & 2032
- Figure 50: Asia Pacific Viscosupplementation Industry Volume Share (%), by Dosage 2024 & 2032
- Figure 51: Asia Pacific Viscosupplementation Industry Revenue (Million), by End-User 2024 & 2032
- Figure 52: Asia Pacific Viscosupplementation Industry Volume (K Unit), by End-User 2024 & 2032
- Figure 53: Asia Pacific Viscosupplementation Industry Revenue Share (%), by End-User 2024 & 2032
- Figure 54: Asia Pacific Viscosupplementation Industry Volume Share (%), by End-User 2024 & 2032
- Figure 55: Asia Pacific Viscosupplementation Industry Revenue (Million), by Country 2024 & 2032
- Figure 56: Asia Pacific Viscosupplementation Industry Volume (K Unit), by Country 2024 & 2032
- Figure 57: Asia Pacific Viscosupplementation Industry Revenue Share (%), by Country 2024 & 2032
- Figure 58: Asia Pacific Viscosupplementation Industry Volume Share (%), by Country 2024 & 2032
- Figure 59: Middle East and Africa Viscosupplementation Industry Revenue (Million), by Dosage 2024 & 2032
- Figure 60: Middle East and Africa Viscosupplementation Industry Volume (K Unit), by Dosage 2024 & 2032
- Figure 61: Middle East and Africa Viscosupplementation Industry Revenue Share (%), by Dosage 2024 & 2032
- Figure 62: Middle East and Africa Viscosupplementation Industry Volume Share (%), by Dosage 2024 & 2032
- Figure 63: Middle East and Africa Viscosupplementation Industry Revenue (Million), by End-User 2024 & 2032
- Figure 64: Middle East and Africa Viscosupplementation Industry Volume (K Unit), by End-User 2024 & 2032
- Figure 65: Middle East and Africa Viscosupplementation Industry Revenue Share (%), by End-User 2024 & 2032
- Figure 66: Middle East and Africa Viscosupplementation Industry Volume Share (%), by End-User 2024 & 2032
- Figure 67: Middle East and Africa Viscosupplementation Industry Revenue (Million), by Country 2024 & 2032
- Figure 68: Middle East and Africa Viscosupplementation Industry Volume (K Unit), by Country 2024 & 2032
- Figure 69: Middle East and Africa Viscosupplementation Industry Revenue Share (%), by Country 2024 & 2032
- Figure 70: Middle East and Africa Viscosupplementation Industry Volume Share (%), by Country 2024 & 2032
- Figure 71: South America Viscosupplementation Industry Revenue (Million), by Dosage 2024 & 2032
- Figure 72: South America Viscosupplementation Industry Volume (K Unit), by Dosage 2024 & 2032
- Figure 73: South America Viscosupplementation Industry Revenue Share (%), by Dosage 2024 & 2032
- Figure 74: South America Viscosupplementation Industry Volume Share (%), by Dosage 2024 & 2032
- Figure 75: South America Viscosupplementation Industry Revenue (Million), by End-User 2024 & 2032
- Figure 76: South America Viscosupplementation Industry Volume (K Unit), by End-User 2024 & 2032
- Figure 77: South America Viscosupplementation Industry Revenue Share (%), by End-User 2024 & 2032
- Figure 78: South America Viscosupplementation Industry Volume Share (%), by End-User 2024 & 2032
- Figure 79: South America Viscosupplementation Industry Revenue (Million), by Country 2024 & 2032
- Figure 80: South America Viscosupplementation Industry Volume (K Unit), by Country 2024 & 2032
- Figure 81: South America Viscosupplementation Industry Revenue Share (%), by Country 2024 & 2032
- Figure 82: South America Viscosupplementation Industry Volume Share (%), by Country 2024 & 2032
List of Tables
- Table 1: Global Viscosupplementation Industry Revenue Million Forecast, by Region 2019 & 2032
- Table 2: Global Viscosupplementation Industry Volume K Unit Forecast, by Region 2019 & 2032
- Table 3: Global Viscosupplementation Industry Revenue Million Forecast, by Dosage 2019 & 2032
- Table 4: Global Viscosupplementation Industry Volume K Unit Forecast, by Dosage 2019 & 2032
- Table 5: Global Viscosupplementation Industry Revenue Million Forecast, by End-User 2019 & 2032
- Table 6: Global Viscosupplementation Industry Volume K Unit Forecast, by End-User 2019 & 2032
- Table 7: Global Viscosupplementation Industry Revenue Million Forecast, by Region 2019 & 2032
- Table 8: Global Viscosupplementation Industry Volume K Unit Forecast, by Region 2019 & 2032
- Table 9: Global Viscosupplementation Industry Revenue Million Forecast, by Country 2019 & 2032
- Table 10: Global Viscosupplementation Industry Volume K Unit Forecast, by Country 2019 & 2032
- Table 11: Global Viscosupplementation Industry Revenue Million Forecast, by Country 2019 & 2032
- Table 12: Global Viscosupplementation Industry Volume K Unit Forecast, by Country 2019 & 2032
- Table 13: Global Viscosupplementation Industry Revenue Million Forecast, by Country 2019 & 2032
- Table 14: Global Viscosupplementation Industry Volume K Unit Forecast, by Country 2019 & 2032
- Table 15: Global Viscosupplementation Industry Revenue Million Forecast, by Country 2019 & 2032
- Table 16: Global Viscosupplementation Industry Volume K Unit Forecast, by Country 2019 & 2032
- Table 17: Global Viscosupplementation Industry Revenue Million Forecast, by Country 2019 & 2032
- Table 18: Global Viscosupplementation Industry Volume K Unit Forecast, by Country 2019 & 2032
- Table 19: Global Viscosupplementation Industry Revenue Million Forecast, by Dosage 2019 & 2032
- Table 20: Global Viscosupplementation Industry Volume K Unit Forecast, by Dosage 2019 & 2032
- Table 21: Global Viscosupplementation Industry Revenue Million Forecast, by End-User 2019 & 2032
- Table 22: Global Viscosupplementation Industry Volume K Unit Forecast, by End-User 2019 & 2032
- Table 23: Global Viscosupplementation Industry Revenue Million Forecast, by Country 2019 & 2032
- Table 24: Global Viscosupplementation Industry Volume K Unit Forecast, by Country 2019 & 2032
- Table 25: United States Viscosupplementation Industry Revenue (Million) Forecast, by Application 2019 & 2032
- Table 26: United States Viscosupplementation Industry Volume (K Unit) Forecast, by Application 2019 & 2032
- Table 27: Canada Viscosupplementation Industry Revenue (Million) Forecast, by Application 2019 & 2032
- Table 28: Canada Viscosupplementation Industry Volume (K Unit) Forecast, by Application 2019 & 2032
- Table 29: Mexico Viscosupplementation Industry Revenue (Million) Forecast, by Application 2019 & 2032
- Table 30: Mexico Viscosupplementation Industry Volume (K Unit) Forecast, by Application 2019 & 2032
- Table 31: Global Viscosupplementation Industry Revenue Million Forecast, by Dosage 2019 & 2032
- Table 32: Global Viscosupplementation Industry Volume K Unit Forecast, by Dosage 2019 & 2032
- Table 33: Global Viscosupplementation Industry Revenue Million Forecast, by End-User 2019 & 2032
- Table 34: Global Viscosupplementation Industry Volume K Unit Forecast, by End-User 2019 & 2032
- Table 35: Global Viscosupplementation Industry Revenue Million Forecast, by Country 2019 & 2032
- Table 36: Global Viscosupplementation Industry Volume K Unit Forecast, by Country 2019 & 2032
- Table 37: Germany Viscosupplementation Industry Revenue (Million) Forecast, by Application 2019 & 2032
- Table 38: Germany Viscosupplementation Industry Volume (K Unit) Forecast, by Application 2019 & 2032
- Table 39: United Kingdom Viscosupplementation Industry Revenue (Million) Forecast, by Application 2019 & 2032
- Table 40: United Kingdom Viscosupplementation Industry Volume (K Unit) Forecast, by Application 2019 & 2032
- Table 41: France Viscosupplementation Industry Revenue (Million) Forecast, by Application 2019 & 2032
- Table 42: France Viscosupplementation Industry Volume (K Unit) Forecast, by Application 2019 & 2032
- Table 43: Italy Viscosupplementation Industry Revenue (Million) Forecast, by Application 2019 & 2032
- Table 44: Italy Viscosupplementation Industry Volume (K Unit) Forecast, by Application 2019 & 2032
- Table 45: Spain Viscosupplementation Industry Revenue (Million) Forecast, by Application 2019 & 2032
- Table 46: Spain Viscosupplementation Industry Volume (K Unit) Forecast, by Application 2019 & 2032
- Table 47: Rest of Europe Viscosupplementation Industry Revenue (Million) Forecast, by Application 2019 & 2032
- Table 48: Rest of Europe Viscosupplementation Industry Volume (K Unit) Forecast, by Application 2019 & 2032
- Table 49: Global Viscosupplementation Industry Revenue Million Forecast, by Dosage 2019 & 2032
- Table 50: Global Viscosupplementation Industry Volume K Unit Forecast, by Dosage 2019 & 2032
- Table 51: Global Viscosupplementation Industry Revenue Million Forecast, by End-User 2019 & 2032
- Table 52: Global Viscosupplementation Industry Volume K Unit Forecast, by End-User 2019 & 2032
- Table 53: Global Viscosupplementation Industry Revenue Million Forecast, by Country 2019 & 2032
- Table 54: Global Viscosupplementation Industry Volume K Unit Forecast, by Country 2019 & 2032
- Table 55: China Viscosupplementation Industry Revenue (Million) Forecast, by Application 2019 & 2032
- Table 56: China Viscosupplementation Industry Volume (K Unit) Forecast, by Application 2019 & 2032
- Table 57: Japan Viscosupplementation Industry Revenue (Million) Forecast, by Application 2019 & 2032
- Table 58: Japan Viscosupplementation Industry Volume (K Unit) Forecast, by Application 2019 & 2032
- Table 59: India Viscosupplementation Industry Revenue (Million) Forecast, by Application 2019 & 2032
- Table 60: India Viscosupplementation Industry Volume (K Unit) Forecast, by Application 2019 & 2032
- Table 61: Australia Viscosupplementation Industry Revenue (Million) Forecast, by Application 2019 & 2032
- Table 62: Australia Viscosupplementation Industry Volume (K Unit) Forecast, by Application 2019 & 2032
- Table 63: South Korea Viscosupplementation Industry Revenue (Million) Forecast, by Application 2019 & 2032
- Table 64: South Korea Viscosupplementation Industry Volume (K Unit) Forecast, by Application 2019 & 2032
- Table 65: Rest of Asia Pacific Viscosupplementation Industry Revenue (Million) Forecast, by Application 2019 & 2032
- Table 66: Rest of Asia Pacific Viscosupplementation Industry Volume (K Unit) Forecast, by Application 2019 & 2032
- Table 67: Global Viscosupplementation Industry Revenue Million Forecast, by Dosage 2019 & 2032
- Table 68: Global Viscosupplementation Industry Volume K Unit Forecast, by Dosage 2019 & 2032
- Table 69: Global Viscosupplementation Industry Revenue Million Forecast, by End-User 2019 & 2032
- Table 70: Global Viscosupplementation Industry Volume K Unit Forecast, by End-User 2019 & 2032
- Table 71: Global Viscosupplementation Industry Revenue Million Forecast, by Country 2019 & 2032
- Table 72: Global Viscosupplementation Industry Volume K Unit Forecast, by Country 2019 & 2032
- Table 73: GCC Viscosupplementation Industry Revenue (Million) Forecast, by Application 2019 & 2032
- Table 74: GCC Viscosupplementation Industry Volume (K Unit) Forecast, by Application 2019 & 2032
- Table 75: South Africa Viscosupplementation Industry Revenue (Million) Forecast, by Application 2019 & 2032
- Table 76: South Africa Viscosupplementation Industry Volume (K Unit) Forecast, by Application 2019 & 2032
- Table 77: Rest of Middle East and Africa Viscosupplementation Industry Revenue (Million) Forecast, by Application 2019 & 2032
- Table 78: Rest of Middle East and Africa Viscosupplementation Industry Volume (K Unit) Forecast, by Application 2019 & 2032
- Table 79: Global Viscosupplementation Industry Revenue Million Forecast, by Dosage 2019 & 2032
- Table 80: Global Viscosupplementation Industry Volume K Unit Forecast, by Dosage 2019 & 2032
- Table 81: Global Viscosupplementation Industry Revenue Million Forecast, by End-User 2019 & 2032
- Table 82: Global Viscosupplementation Industry Volume K Unit Forecast, by End-User 2019 & 2032
- Table 83: Global Viscosupplementation Industry Revenue Million Forecast, by Country 2019 & 2032
- Table 84: Global Viscosupplementation Industry Volume K Unit Forecast, by Country 2019 & 2032
- Table 85: Brazil Viscosupplementation Industry Revenue (Million) Forecast, by Application 2019 & 2032
- Table 86: Brazil Viscosupplementation Industry Volume (K Unit) Forecast, by Application 2019 & 2032
- Table 87: Argentina Viscosupplementation Industry Revenue (Million) Forecast, by Application 2019 & 2032
- Table 88: Argentina Viscosupplementation Industry Volume (K Unit) Forecast, by Application 2019 & 2032
- Table 89: Rest of South America Viscosupplementation Industry Revenue (Million) Forecast, by Application 2019 & 2032
- Table 90: Rest of South America Viscosupplementation Industry Volume (K Unit) Forecast, by Application 2019 & 2032
Frequently Asked Questions
1. What is the projected Compound Annual Growth Rate (CAGR) of the Viscosupplementation Industry?
The projected CAGR is approximately 5.80%.
2. Which companies are prominent players in the Viscosupplementation Industry?
Key companies in the market include Wellchem Pharmaceuticals Pte Ltd , Sanofi SA, OrthogenRx Inc, Aptissen, Fidia Farmaceutici s p a, Anika Therapeutics Inc, Johnson & Johnson Services Inc, Ferring Pharmaceuticals, Bioventus LLC, Seikagaku Corporation, Chugai Pharmaceuticals Co Ltd (Roche), Zimmer Biomet.
3. What are the main segments of the Viscosupplementation Industry?
The market segments include Dosage, End-User.
4. Can you provide details about the market size?
The market size is estimated to be USD XX Million as of 2022.
5. What are some drivers contributing to market growth?
Rising Patient Pool Suffering from Osteoarthritis; Introduction of Advanced and Combination Products.
6. What are the notable trends driving market growth?
Single Injection Segment Expects to Register a High CAGR in the Forecast Period.
7. Are there any restraints impacting market growth?
Regulatory Issues and Lack of Awareness.
8. Can you provide examples of recent developments in the market?
N/A
9. What pricing options are available for accessing the report?
Pricing options include single-user, multi-user, and enterprise licenses priced at USD 4750, USD 5250, and USD 8750 respectively.
10. Is the market size provided in terms of value or volume?
The market size is provided in terms of value, measured in Million and volume, measured in K Unit.
11. Are there any specific market keywords associated with the report?
Yes, the market keyword associated with the report is "Viscosupplementation Industry," which aids in identifying and referencing the specific market segment covered.
12. How do I determine which pricing option suits my needs best?
The pricing options vary based on user requirements and access needs. Individual users may opt for single-user licenses, while businesses requiring broader access may choose multi-user or enterprise licenses for cost-effective access to the report.
13. Are there any additional resources or data provided in the Viscosupplementation Industry report?
While the report offers comprehensive insights, it's advisable to review the specific contents or supplementary materials provided to ascertain if additional resources or data are available.
14. How can I stay updated on further developments or reports in the Viscosupplementation Industry?
To stay informed about further developments, trends, and reports in the Viscosupplementation Industry, consider subscribing to industry newsletters, following relevant companies and organizations, or regularly checking reputable industry news sources and publications.
Methodology
Step 1 - Identification of Relevant Samples Size from Population Database


Step 2 - Approaches for Defining Global Market Size (Value, Volume* & Price*)

Note*: In applicable scenarios
Step 3 - Data Sources
Primary Research
- Web Analytics
- Survey Reports
- Research Institute
- Latest Research Reports
- Opinion Leaders
Secondary Research
- Annual Reports
- White Paper
- Latest Press Release
- Industry Association
- Paid Database
- Investor Presentations

Step 4 - Data Triangulation
Involves using different sources of information in order to increase the validity of a study
These sources are likely to be stakeholders in a program - participants, other researchers, program staff, other community members, and so on.
Then we put all data in single framework & apply various statistical tools to find out the dynamic on the market.
During the analysis stage, feedback from the stakeholder groups would be compared to determine areas of agreement as well as areas of divergence


