

Key Insights
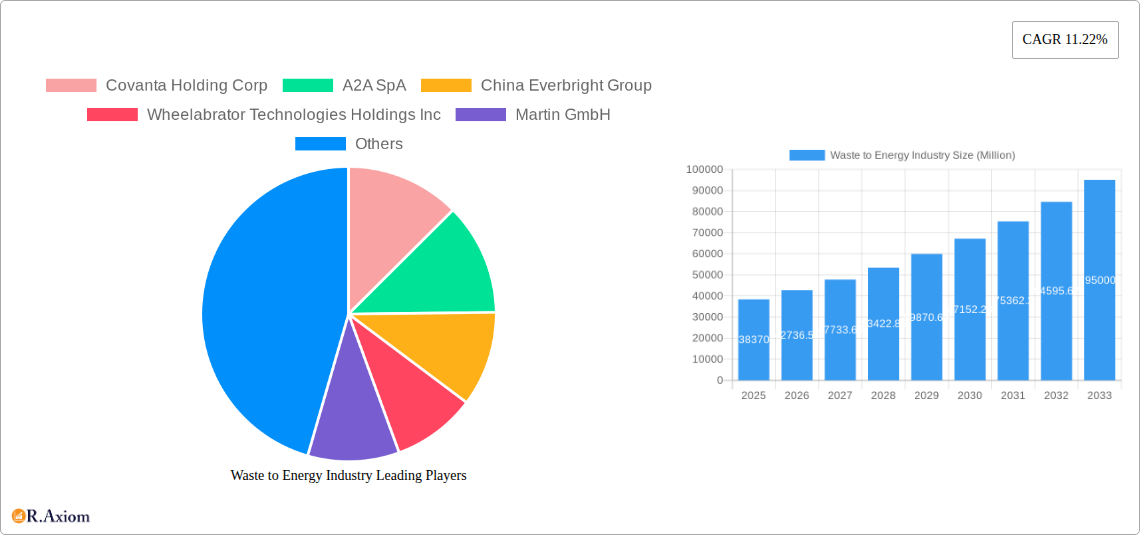
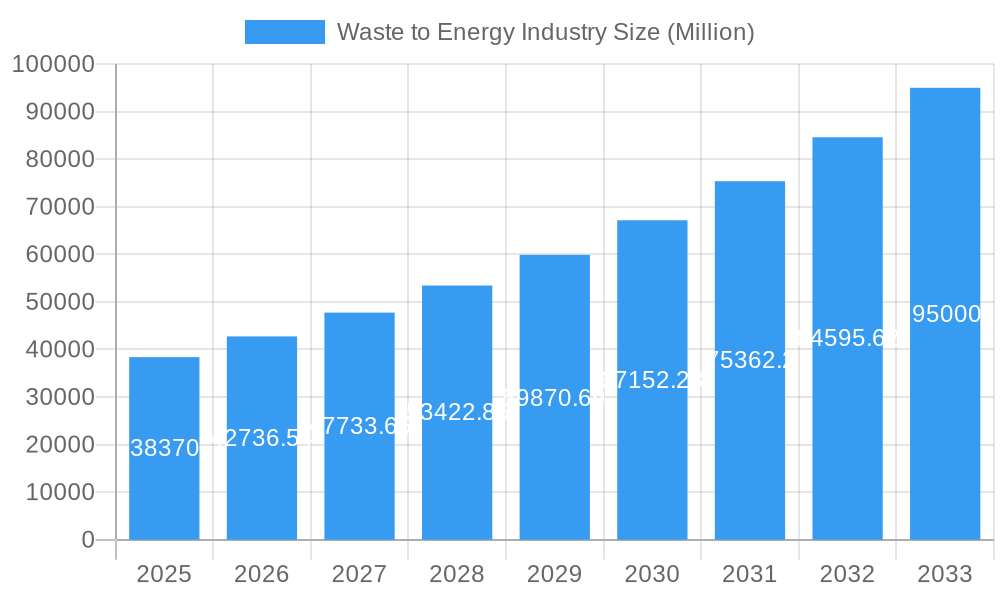
The global waste-to-energy (WtE) market is experiencing robust growth, projected to reach a market size of $38.37 billion in 2025 and exhibiting a Compound Annual Growth Rate (CAGR) of 11.22% from 2025 to 2033. This expansion is driven by several key factors. Stringent environmental regulations globally are pushing for sustainable waste management solutions, reducing reliance on landfills and promoting resource recovery. Increasing urbanization and population growth contribute to a rising volume of waste, creating a greater need for efficient WtE technologies. Furthermore, the escalating costs associated with traditional waste disposal methods are making WtE a more economically viable option. Technological advancements in WtE processes, such as improved energy efficiency and reduced emissions, are also contributing to market growth. The adoption of advanced thermal technologies like gasification and pyrolysis is enhancing the overall efficiency and environmental sustainability of WtE plants. Finally, government incentives and supportive policies aimed at promoting renewable energy sources are further accelerating the adoption of WtE technologies.
Waste to Energy Industry Market Size (In Billion)
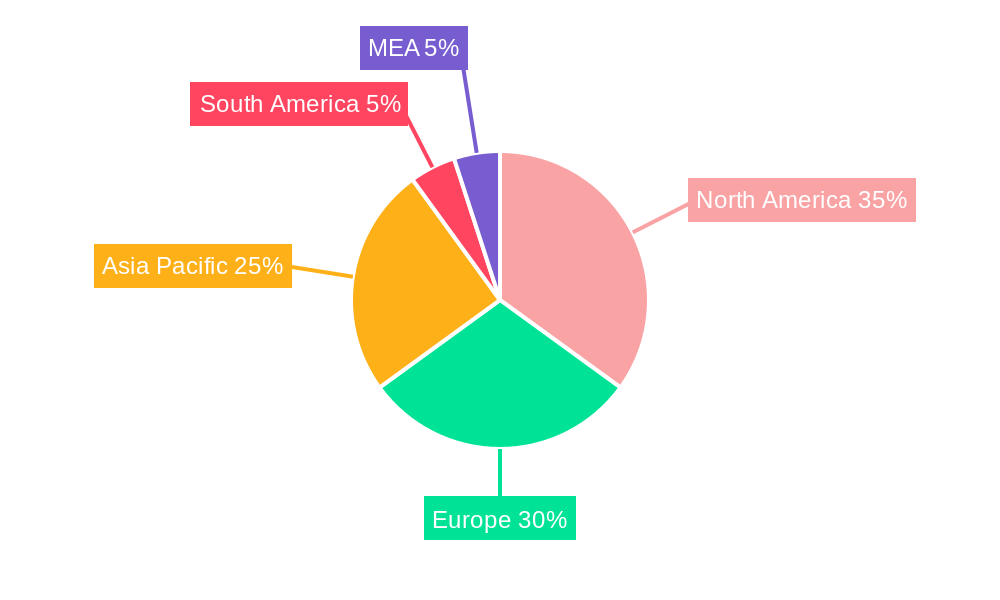
The market is segmented by technology (physical, thermal, biological) and geographically spread across North America, Europe, Asia Pacific, South America, and the Middle East & Africa. North America and Europe currently hold significant market shares, driven by established infrastructure and stringent environmental regulations. However, the Asia-Pacific region is poised for substantial growth, fueled by rapid industrialization, increasing waste generation, and government initiatives promoting renewable energy. Competition within the market is fierce, with major players including Covanta Holding Corp, A2A SpA, China Everbright Group, and Waste Management Inc. These companies are actively investing in research and development, expanding their operational capacity, and pursuing strategic partnerships to gain a competitive edge. The future of the WtE market hinges on continued technological innovation, supportive government policies, and rising environmental awareness among consumers and businesses alike. The focus on achieving carbon neutrality and circular economy principles will further drive the adoption of sustainable waste management solutions, ensuring continued growth in this vital sector.
Waste to Energy Industry Company Market Share
Waste-to-Energy Industry Market Report: 2019-2033
This comprehensive report provides an in-depth analysis of the global waste-to-energy industry, offering invaluable insights for stakeholders, investors, and industry professionals. With a focus on market trends, technological advancements, and key players, this report covers the period from 2019 to 2033, with a base year of 2025 and a forecast period of 2025-2033. The report is structured to deliver actionable insights and includes detailed market sizing, growth projections, and competitive landscape analysis, focusing on key players like Covanta Holding Corp, A2A SpA, and others. This report is crucial for navigating the complexities of this rapidly evolving sector and capitalizing on emerging opportunities. The total market value is projected to reach xx Million by 2033.
Waste to Energy Industry Market Concentration & Innovation
The waste-to-energy market exhibits a moderately concentrated landscape, with a few major players commanding significant market share. Covanta Holding Corp, A2A SpA, and China Everbright Group are among the leading companies, collectively holding an estimated xx% of the global market share in 2025. Market concentration is influenced by factors such as technological expertise, economies of scale, and geographical reach.
Innovation in the sector is driven by the increasing need for sustainable waste management solutions and the growing demand for renewable energy. Key innovations include advancements in waste gasification technologies, improved energy efficiency in thermal processes, and the development of advanced biological treatment methods. Stringent environmental regulations globally are further pushing innovation toward cleaner and more efficient waste-to-energy solutions.
The regulatory framework significantly shapes market dynamics, with differing policies and standards across regions. The presence of substitute technologies, such as landfill disposal and anaerobic digestion, poses competitive pressure, while end-user trends are shifting towards environmentally conscious solutions. Mergers and acquisitions (M&A) activities are frequent, with deal values reaching xx Million in recent years, indicating consolidation and expansion efforts within the industry. For example, recent M&A activities have focused on expanding geographical reach and acquiring specialized technologies.
Waste to Energy Industry Industry Trends & Insights
The waste-to-energy market is experiencing robust growth, driven by factors such as increasing waste generation, stricter environmental regulations, and the rising demand for renewable energy sources. The global market is expected to exhibit a Compound Annual Growth Rate (CAGR) of xx% during the forecast period (2025-2033). Market penetration is gradually increasing, with waste-to-energy technologies becoming increasingly adopted in both developed and developing economies. However, challenges remain, including high capital investment costs, technological limitations in handling certain waste streams, and public perception concerns regarding potential environmental impacts. Technological disruptions, particularly in the areas of gasification and plasma arc technologies, are transforming the landscape, creating new opportunities for efficiency and output. Consumer preferences are shifting towards eco-friendly energy sources and responsible waste management practices, providing further impetus to market growth. Competitive dynamics are characterized by both collaboration and rivalry, with leading companies investing heavily in R&D to enhance their technological advantage and market position.
Dominant Markets & Segments in Waste to Energy Industry
The Asia-Pacific region is projected to dominate the waste-to-energy market during the forecast period, driven by factors such as rapid urbanization, increasing industrialization, and supportive government policies. China, India, and Japan are key contributors to this regional dominance.
- Key Drivers in Asia-Pacific:
- Rapid urbanization and industrialization leading to increased waste generation.
- Stringent environmental regulations promoting sustainable waste management solutions.
- Government incentives and investments in renewable energy projects.
- Growing awareness of environmental concerns among consumers.
The thermal technology segment holds the largest market share, owing to its established technology base, relatively lower capital costs, and proven effectiveness in energy generation. However, the biological segment is witnessing significant growth, propelled by the advancements in anaerobic digestion and other biological treatment technologies, especially for organic waste streams. The physical segment remains niche, with applications concentrated in specific waste streams requiring specialized treatment.
Waste to Energy Industry Product Developments
Recent product innovations have focused on improving efficiency, reducing emissions, and expanding the range of treatable waste streams. Advanced gasification technologies offer enhanced energy recovery and reduced environmental impact. Hybrid systems, integrating thermal and biological processes, are gaining traction, enabling greater flexibility and efficiency. These advancements are driving the adoption of waste-to-energy technologies, enhancing market competitiveness, and improving the overall sustainability of waste management.
Report Scope & Segmentation Analysis
This report segments the waste-to-energy market by technology type: Physical, Thermal, and Biological.
Physical: This segment focuses on mechanical processes for waste treatment and resource recovery. The market size for physical technologies is expected to reach xx Million by 2033, driven by advancements in material sorting and recovery techniques.
Thermal: This segment, dominated by incineration and gasification, is projected to maintain the largest market share throughout the forecast period, reaching xx Million by 2033. The competitive landscape is characterized by established players and technological advancements leading to higher efficiency and reduced emissions.
Biological: This segment, encompassing anaerobic digestion and composting, is experiencing rapid growth, projected to reach xx Million by 2033, driven by the increasing focus on organic waste management and renewable energy production from biogas. Technological advancements in biogas upgrading and process optimization are shaping this segment's competitive dynamics.
Key Drivers of Waste to Energy Industry Growth
The growth of the waste-to-energy industry is driven by several key factors:
- Stringent environmental regulations: Governments worldwide are enacting stricter regulations to reduce landfill reliance and promote sustainable waste management practices.
- Rising energy demand: The increasing global demand for renewable energy sources creates a market for waste-to-energy technologies as a sustainable alternative.
- Technological advancements: Continuous innovation in waste treatment and energy conversion technologies improves efficiency and reduces environmental impact.
- Economic incentives: Government subsidies, tax breaks, and feed-in tariffs support the adoption of waste-to-energy projects. The Egyptian contract for the Abou Rawash plant is a prime example.
Challenges in the Waste to Energy Industry Sector
The waste-to-energy sector faces several challenges:
- High capital investment costs: The initial investment required for building waste-to-energy plants can be substantial, hindering widespread adoption, especially in developing countries.
- Public perception and NIMBYism: Concerns regarding potential environmental impacts, such as air pollution and ash disposal, can lead to public opposition and delay project implementation.
- Fluctuating waste composition: The variability in waste composition can impact the efficiency and reliability of waste-to-energy plants.
- Competition from other waste management solutions: The industry faces competition from other waste management technologies, such as landfill and recycling.
Emerging Opportunities in Waste to Energy Industry
Several emerging opportunities exist within the waste-to-energy sector:
- Advanced gasification technologies: These technologies offer improved efficiency and resource recovery, leading to a more sustainable solution.
- Integration with other renewable energy sources: Combining waste-to-energy with solar or wind power can create hybrid energy systems.
- Waste-to-chemicals: Converting waste into valuable chemicals offers a promising avenue for resource recovery and enhanced economic viability.
- Expanding into developing markets: Developing economies offer significant growth potential due to their increasing waste generation and demand for sustainable energy solutions.
Leading Players in the Waste to Energy Industry Market
- Covanta Holding Corp
- A2A SpA
- China Everbright Group
- Wheelabrator Technologies Holdings Inc
- Martin GmbH
- Hitachi Zosen Corp
- Suez Group
- China Jinjiang Environment Holding Co Ltd
- Veolia Environnement SA
- Waste Management Inc
- Babcock & Wilcox Enterprises Inc
- Xcel Energy Inc
- MVV Energie AG
- Mitsubishi Heavy Industries Ltd
Key Developments in Waste to Energy Industry Industry
- January 2023: Lostock Sustainable Energy Plant awarded Babcock & Wilcox a USD 65 Million contract for a waste-to-energy plant in the UK, increasing energy generation capacity and processing 600,000 metric tons of waste annually. This highlights the significant investment in large-scale projects and technology upgrades.
- April 2023: Egypt signed a USD 120 Million contract for its first solid waste-to-electricity facility. This development signifies the growing interest in waste-to-energy solutions in developing nations and contributes to Egypt's Vision 2030 goals.
Strategic Outlook for Waste to Energy Industry Market
The waste-to-energy market is poised for significant growth, driven by global environmental concerns and the increasing need for sustainable energy solutions. Technological innovations, coupled with supportive government policies and rising consumer awareness, will drive market expansion. The focus on circular economy principles, optimizing resource recovery, and reducing greenhouse gas emissions will be key drivers of future growth. Expanding into new markets and diversifying waste streams will present substantial opportunities for companies to enhance their market positions. The industry's future success hinges on addressing challenges related to public acceptance, cost-effectiveness, and technological advancements.
Waste to Energy Industry Segmentation
-
1. Technology
- 1.1. Physical
- 1.2. Thermal
- 1.3. Biological
Waste to Energy Industry Segmentation By Geography
-
1. North America
- 1.1. United States
- 1.2. Canada
- 1.3. Rest of North America
-
2. Asia Pacific
- 2.1. China
- 2.2. India
- 2.3. Japan
- 2.4. Malaysia
- 2.5. Thailand
- 2.6. Indonesia
- 2.7. Vietnam
- 2.8. Rest of Asia Pacific
-
3. Europe
- 3.1. Spain
- 3.2. Nordic
- 3.3. United Kingdom
- 3.4. Russia
- 3.5. Turkey
- 3.6. Germany
- 3.7. Italy
- 3.8. Rest of Europe
-
4. Middle East and Africa
- 4.1. United Arab Emirates
- 4.2. Saudi Arabia
- 4.3. South Africa
- 4.4. Nigeria
- 4.5. Qatar
- 4.6. Egypt
- 4.7. Rest of Middle East and Africa
-
5. South America
- 5.1. Brazil
- 5.2. Argentina
- 5.3. Colombia
- 5.4. Rest of South America
Waste to Energy Industry Regional Market Share
Geographic Coverage of Waste to Energy Industry
Waste to Energy Industry REPORT HIGHLIGHTS
| Aspects | Details |
|---|---|
| Study Period | 2020-2034 |
| Base Year | 2025 |
| Estimated Year | 2026 |
| Forecast Period | 2026-2034 |
| Historical Period | 2020-2025 |
| Growth Rate | CAGR of 11.22% from 2020-2034 |
| Segmentation |
|
Table of Contents
- 1. Introduction
- 1.1. Research Scope
- 1.2. Market Segmentation
- 1.3. Research Objective
- 1.4. Definitions and Assumptions
- 2. Executive Summary
- 2.1. Market Snapshot
- 3. Market Dynamics
- 3.1. Market Drivers
- 3.2. Market Restrains
- 3.3. Market Trends
- 3.4. Market Opportunities
- 4. Market Factor Analysis
- 4.1. Porters Five Forces
- 4.1.1. Bargaining Power of Suppliers
- 4.1.2. Bargaining Power of Buyers
- 4.1.3. Threat of New Entrants
- 4.1.4. Threat of Substitutes
- 4.1.5. Competitive Rivalry
- 4.2. PESTEL analysis
- 4.3. BCG Analysis
- 4.3.1. Stars (High Growth, High Market Share)
- 4.3.2. Cash Cows (Low Growth, High Market Share)
- 4.3.3. Question Mark (High Growth, Low Market Share)
- 4.3.4. Dogs (Low Growth, Low Market Share)
- 4.4. Ansoff Matrix Analysis
- 4.5. Supply Chain Analysis
- 4.6. Regulatory Landscape
- 4.7. Current Market Potential and Opportunity Assessment (TAM–SAM–SOM Framework)
- 4.8. RAX Analyst Note
- 4.1. Porters Five Forces
- 5. Market Analysis, Insights and Forecast 2021-2033
- 5.1. Market Analysis, Insights and Forecast - by Technology
- 5.1.1. Physical
- 5.1.2. Thermal
- 5.1.3. Biological
- 5.2. Market Analysis, Insights and Forecast - by Region
- 5.2.1. North America
- 5.2.2. Asia Pacific
- 5.2.3. Europe
- 5.2.4. Middle East and Africa
- 5.2.5. South America
- 5.1. Market Analysis, Insights and Forecast - by Technology
- 6. Global Waste to Energy Industry Analysis, Insights and Forecast, 2021-2033
- 6.1. Market Analysis, Insights and Forecast - by Technology
- 6.1.1. Physical
- 6.1.2. Thermal
- 6.1.3. Biological
- 6.1. Market Analysis, Insights and Forecast - by Technology
- 7. North America Waste to Energy Industry Analysis, Insights and Forecast, 2020-2032
- 7.1. Market Analysis, Insights and Forecast - by Technology
- 7.1.1. Physical
- 7.1.2. Thermal
- 7.1.3. Biological
- 7.1. Market Analysis, Insights and Forecast - by Technology
- 8. Asia Pacific Waste to Energy Industry Analysis, Insights and Forecast, 2020-2032
- 8.1. Market Analysis, Insights and Forecast - by Technology
- 8.1.1. Physical
- 8.1.2. Thermal
- 8.1.3. Biological
- 8.1. Market Analysis, Insights and Forecast - by Technology
- 9. Europe Waste to Energy Industry Analysis, Insights and Forecast, 2020-2032
- 9.1. Market Analysis, Insights and Forecast - by Technology
- 9.1.1. Physical
- 9.1.2. Thermal
- 9.1.3. Biological
- 9.1. Market Analysis, Insights and Forecast - by Technology
- 10. Middle East and Africa Waste to Energy Industry Analysis, Insights and Forecast, 2020-2032
- 10.1. Market Analysis, Insights and Forecast - by Technology
- 10.1.1. Physical
- 10.1.2. Thermal
- 10.1.3. Biological
- 10.1. Market Analysis, Insights and Forecast - by Technology
- 11. South America Waste to Energy Industry Analysis, Insights and Forecast, 2020-2032
- 11.1. Market Analysis, Insights and Forecast - by Technology
- 11.1.1. Physical
- 11.1.2. Thermal
- 11.1.3. Biological
- 11.1. Market Analysis, Insights and Forecast - by Technology
- 12. Competitive Analysis
- 12.1. Company Profiles
- 12.1.1 Covanta Holding Corp
- 12.1.1.1. Company Overview
- 12.1.1.2. Products
- 12.1.1.3. Company Financials
- 12.1.1.4. SWOT Analysis
- 12.1.2 A2A SpA
- 12.1.2.1. Company Overview
- 12.1.2.2. Products
- 12.1.2.3. Company Financials
- 12.1.2.4. SWOT Analysis
- 12.1.3 China Everbright Group
- 12.1.3.1. Company Overview
- 12.1.3.2. Products
- 12.1.3.3. Company Financials
- 12.1.3.4. SWOT Analysis
- 12.1.4 Wheelabrator Technologies Holdings Inc
- 12.1.4.1. Company Overview
- 12.1.4.2. Products
- 12.1.4.3. Company Financials
- 12.1.4.4. SWOT Analysis
- 12.1.5 Martin GmbH
- 12.1.5.1. Company Overview
- 12.1.5.2. Products
- 12.1.5.3. Company Financials
- 12.1.5.4. SWOT Analysis
- 12.1.6 Hitachi Zosen Corp
- 12.1.6.1. Company Overview
- 12.1.6.2. Products
- 12.1.6.3. Company Financials
- 12.1.6.4. SWOT Analysis
- 12.1.7 Suez Group
- 12.1.7.1. Company Overview
- 12.1.7.2. Products
- 12.1.7.3. Company Financials
- 12.1.7.4. SWOT Analysis
- 12.1.8 China Jinjiang Environment Holding Co Ltd
- 12.1.8.1. Company Overview
- 12.1.8.2. Products
- 12.1.8.3. Company Financials
- 12.1.8.4. SWOT Analysis
- 12.1.9 Veolia Environnement SA
- 12.1.9.1. Company Overview
- 12.1.9.2. Products
- 12.1.9.3. Company Financials
- 12.1.9.4. SWOT Analysis
- 12.1.10 Waste Management Inc
- 12.1.10.1. Company Overview
- 12.1.10.2. Products
- 12.1.10.3. Company Financials
- 12.1.10.4. SWOT Analysis
- 12.1.11 Babcock & Wilcox Enterprises Inc
- 12.1.11.1. Company Overview
- 12.1.11.2. Products
- 12.1.11.3. Company Financials
- 12.1.11.4. SWOT Analysis
- 12.1.12 Xcel Energy Inc
- 12.1.12.1. Company Overview
- 12.1.12.2. Products
- 12.1.12.3. Company Financials
- 12.1.12.4. SWOT Analysis
- 12.1.13 MVV Energie AG
- 12.1.13.1. Company Overview
- 12.1.13.2. Products
- 12.1.13.3. Company Financials
- 12.1.13.4. SWOT Analysis
- 12.1.14 Mitsubishi Heavy Industries Ltd
- 12.1.14.1. Company Overview
- 12.1.14.2. Products
- 12.1.14.3. Company Financials
- 12.1.14.4. SWOT Analysis
- 12.1.1 Covanta Holding Corp
- 12.2. Market Entropy
- 12.2.1 Company's Key Areas Served
- 12.2.2 Recent Developments
- 12.3. Company Market Share Analysis 2025
- 12.3.1 Top 5 Companies Market Share Analysis
- 12.3.2 Top 3 Companies Market Share Analysis
- 12.4. List of Potential Customers
- 13. Research Methodology
List of Figures
- Figure 1: Global Waste to Energy Industry Revenue Breakdown (Million, %) by Region 2025 & 2033
- Figure 2: Global Waste to Energy Industry Volume Breakdown (Gigawatt, %) by Region 2025 & 2033
- Figure 3: North America Waste to Energy Industry Revenue (Million), by Technology 2025 & 2033
- Figure 4: North America Waste to Energy Industry Volume (Gigawatt), by Technology 2025 & 2033
- Figure 5: North America Waste to Energy Industry Revenue Share (%), by Technology 2025 & 2033
- Figure 6: North America Waste to Energy Industry Volume Share (%), by Technology 2025 & 2033
- Figure 7: North America Waste to Energy Industry Revenue (Million), by Country 2025 & 2033
- Figure 8: North America Waste to Energy Industry Volume (Gigawatt), by Country 2025 & 2033
- Figure 9: North America Waste to Energy Industry Revenue Share (%), by Country 2025 & 2033
- Figure 10: North America Waste to Energy Industry Volume Share (%), by Country 2025 & 2033
- Figure 11: Asia Pacific Waste to Energy Industry Revenue (Million), by Technology 2025 & 2033
- Figure 12: Asia Pacific Waste to Energy Industry Volume (Gigawatt), by Technology 2025 & 2033
- Figure 13: Asia Pacific Waste to Energy Industry Revenue Share (%), by Technology 2025 & 2033
- Figure 14: Asia Pacific Waste to Energy Industry Volume Share (%), by Technology 2025 & 2033
- Figure 15: Asia Pacific Waste to Energy Industry Revenue (Million), by Country 2025 & 2033
- Figure 16: Asia Pacific Waste to Energy Industry Volume (Gigawatt), by Country 2025 & 2033
- Figure 17: Asia Pacific Waste to Energy Industry Revenue Share (%), by Country 2025 & 2033
- Figure 18: Asia Pacific Waste to Energy Industry Volume Share (%), by Country 2025 & 2033
- Figure 19: Europe Waste to Energy Industry Revenue (Million), by Technology 2025 & 2033
- Figure 20: Europe Waste to Energy Industry Volume (Gigawatt), by Technology 2025 & 2033
- Figure 21: Europe Waste to Energy Industry Revenue Share (%), by Technology 2025 & 2033
- Figure 22: Europe Waste to Energy Industry Volume Share (%), by Technology 2025 & 2033
- Figure 23: Europe Waste to Energy Industry Revenue (Million), by Country 2025 & 2033
- Figure 24: Europe Waste to Energy Industry Volume (Gigawatt), by Country 2025 & 2033
- Figure 25: Europe Waste to Energy Industry Revenue Share (%), by Country 2025 & 2033
- Figure 26: Europe Waste to Energy Industry Volume Share (%), by Country 2025 & 2033
- Figure 27: Middle East and Africa Waste to Energy Industry Revenue (Million), by Technology 2025 & 2033
- Figure 28: Middle East and Africa Waste to Energy Industry Volume (Gigawatt), by Technology 2025 & 2033
- Figure 29: Middle East and Africa Waste to Energy Industry Revenue Share (%), by Technology 2025 & 2033
- Figure 30: Middle East and Africa Waste to Energy Industry Volume Share (%), by Technology 2025 & 2033
- Figure 31: Middle East and Africa Waste to Energy Industry Revenue (Million), by Country 2025 & 2033
- Figure 32: Middle East and Africa Waste to Energy Industry Volume (Gigawatt), by Country 2025 & 2033
- Figure 33: Middle East and Africa Waste to Energy Industry Revenue Share (%), by Country 2025 & 2033
- Figure 34: Middle East and Africa Waste to Energy Industry Volume Share (%), by Country 2025 & 2033
- Figure 35: South America Waste to Energy Industry Revenue (Million), by Technology 2025 & 2033
- Figure 36: South America Waste to Energy Industry Volume (Gigawatt), by Technology 2025 & 2033
- Figure 37: South America Waste to Energy Industry Revenue Share (%), by Technology 2025 & 2033
- Figure 38: South America Waste to Energy Industry Volume Share (%), by Technology 2025 & 2033
- Figure 39: South America Waste to Energy Industry Revenue (Million), by Country 2025 & 2033
- Figure 40: South America Waste to Energy Industry Volume (Gigawatt), by Country 2025 & 2033
- Figure 41: South America Waste to Energy Industry Revenue Share (%), by Country 2025 & 2033
- Figure 42: South America Waste to Energy Industry Volume Share (%), by Country 2025 & 2033
List of Tables
- Table 1: Global Waste to Energy Industry Revenue Million Forecast, by Technology 2020 & 2033
- Table 2: Global Waste to Energy Industry Volume Gigawatt Forecast, by Technology 2020 & 2033
- Table 3: Global Waste to Energy Industry Revenue Million Forecast, by Region 2020 & 2033
- Table 4: Global Waste to Energy Industry Volume Gigawatt Forecast, by Region 2020 & 2033
- Table 5: Global Waste to Energy Industry Revenue Million Forecast, by Technology 2020 & 2033
- Table 6: Global Waste to Energy Industry Volume Gigawatt Forecast, by Technology 2020 & 2033
- Table 7: Global Waste to Energy Industry Revenue Million Forecast, by Country 2020 & 2033
- Table 8: Global Waste to Energy Industry Volume Gigawatt Forecast, by Country 2020 & 2033
- Table 9: United States Waste to Energy Industry Revenue (Million) Forecast, by Application 2020 & 2033
- Table 10: United States Waste to Energy Industry Volume (Gigawatt) Forecast, by Application 2020 & 2033
- Table 11: Canada Waste to Energy Industry Revenue (Million) Forecast, by Application 2020 & 2033
- Table 12: Canada Waste to Energy Industry Volume (Gigawatt) Forecast, by Application 2020 & 2033
- Table 13: Rest of North America Waste to Energy Industry Revenue (Million) Forecast, by Application 2020 & 2033
- Table 14: Rest of North America Waste to Energy Industry Volume (Gigawatt) Forecast, by Application 2020 & 2033
- Table 15: Global Waste to Energy Industry Revenue Million Forecast, by Technology 2020 & 2033
- Table 16: Global Waste to Energy Industry Volume Gigawatt Forecast, by Technology 2020 & 2033
- Table 17: Global Waste to Energy Industry Revenue Million Forecast, by Country 2020 & 2033
- Table 18: Global Waste to Energy Industry Volume Gigawatt Forecast, by Country 2020 & 2033
- Table 19: China Waste to Energy Industry Revenue (Million) Forecast, by Application 2020 & 2033
- Table 20: China Waste to Energy Industry Volume (Gigawatt) Forecast, by Application 2020 & 2033
- Table 21: India Waste to Energy Industry Revenue (Million) Forecast, by Application 2020 & 2033
- Table 22: India Waste to Energy Industry Volume (Gigawatt) Forecast, by Application 2020 & 2033
- Table 23: Japan Waste to Energy Industry Revenue (Million) Forecast, by Application 2020 & 2033
- Table 24: Japan Waste to Energy Industry Volume (Gigawatt) Forecast, by Application 2020 & 2033
- Table 25: Malaysia Waste to Energy Industry Revenue (Million) Forecast, by Application 2020 & 2033
- Table 26: Malaysia Waste to Energy Industry Volume (Gigawatt) Forecast, by Application 2020 & 2033
- Table 27: Thailand Waste to Energy Industry Revenue (Million) Forecast, by Application 2020 & 2033
- Table 28: Thailand Waste to Energy Industry Volume (Gigawatt) Forecast, by Application 2020 & 2033
- Table 29: Indonesia Waste to Energy Industry Revenue (Million) Forecast, by Application 2020 & 2033
- Table 30: Indonesia Waste to Energy Industry Volume (Gigawatt) Forecast, by Application 2020 & 2033
- Table 31: Vietnam Waste to Energy Industry Revenue (Million) Forecast, by Application 2020 & 2033
- Table 32: Vietnam Waste to Energy Industry Volume (Gigawatt) Forecast, by Application 2020 & 2033
- Table 33: Rest of Asia Pacific Waste to Energy Industry Revenue (Million) Forecast, by Application 2020 & 2033
- Table 34: Rest of Asia Pacific Waste to Energy Industry Volume (Gigawatt) Forecast, by Application 2020 & 2033
- Table 35: Global Waste to Energy Industry Revenue Million Forecast, by Technology 2020 & 2033
- Table 36: Global Waste to Energy Industry Volume Gigawatt Forecast, by Technology 2020 & 2033
- Table 37: Global Waste to Energy Industry Revenue Million Forecast, by Country 2020 & 2033
- Table 38: Global Waste to Energy Industry Volume Gigawatt Forecast, by Country 2020 & 2033
- Table 39: Spain Waste to Energy Industry Revenue (Million) Forecast, by Application 2020 & 2033
- Table 40: Spain Waste to Energy Industry Volume (Gigawatt) Forecast, by Application 2020 & 2033
- Table 41: Nordic Waste to Energy Industry Revenue (Million) Forecast, by Application 2020 & 2033
- Table 42: Nordic Waste to Energy Industry Volume (Gigawatt) Forecast, by Application 2020 & 2033
- Table 43: United Kingdom Waste to Energy Industry Revenue (Million) Forecast, by Application 2020 & 2033
- Table 44: United Kingdom Waste to Energy Industry Volume (Gigawatt) Forecast, by Application 2020 & 2033
- Table 45: Russia Waste to Energy Industry Revenue (Million) Forecast, by Application 2020 & 2033
- Table 46: Russia Waste to Energy Industry Volume (Gigawatt) Forecast, by Application 2020 & 2033
- Table 47: Turkey Waste to Energy Industry Revenue (Million) Forecast, by Application 2020 & 2033
- Table 48: Turkey Waste to Energy Industry Volume (Gigawatt) Forecast, by Application 2020 & 2033
- Table 49: Germany Waste to Energy Industry Revenue (Million) Forecast, by Application 2020 & 2033
- Table 50: Germany Waste to Energy Industry Volume (Gigawatt) Forecast, by Application 2020 & 2033
- Table 51: Italy Waste to Energy Industry Revenue (Million) Forecast, by Application 2020 & 2033
- Table 52: Italy Waste to Energy Industry Volume (Gigawatt) Forecast, by Application 2020 & 2033
- Table 53: Rest of Europe Waste to Energy Industry Revenue (Million) Forecast, by Application 2020 & 2033
- Table 54: Rest of Europe Waste to Energy Industry Volume (Gigawatt) Forecast, by Application 2020 & 2033
- Table 55: Global Waste to Energy Industry Revenue Million Forecast, by Technology 2020 & 2033
- Table 56: Global Waste to Energy Industry Volume Gigawatt Forecast, by Technology 2020 & 2033
- Table 57: Global Waste to Energy Industry Revenue Million Forecast, by Country 2020 & 2033
- Table 58: Global Waste to Energy Industry Volume Gigawatt Forecast, by Country 2020 & 2033
- Table 59: United Arab Emirates Waste to Energy Industry Revenue (Million) Forecast, by Application 2020 & 2033
- Table 60: United Arab Emirates Waste to Energy Industry Volume (Gigawatt) Forecast, by Application 2020 & 2033
- Table 61: Saudi Arabia Waste to Energy Industry Revenue (Million) Forecast, by Application 2020 & 2033
- Table 62: Saudi Arabia Waste to Energy Industry Volume (Gigawatt) Forecast, by Application 2020 & 2033
- Table 63: South Africa Waste to Energy Industry Revenue (Million) Forecast, by Application 2020 & 2033
- Table 64: South Africa Waste to Energy Industry Volume (Gigawatt) Forecast, by Application 2020 & 2033
- Table 65: Nigeria Waste to Energy Industry Revenue (Million) Forecast, by Application 2020 & 2033
- Table 66: Nigeria Waste to Energy Industry Volume (Gigawatt) Forecast, by Application 2020 & 2033
- Table 67: Qatar Waste to Energy Industry Revenue (Million) Forecast, by Application 2020 & 2033
- Table 68: Qatar Waste to Energy Industry Volume (Gigawatt) Forecast, by Application 2020 & 2033
- Table 69: Egypt Waste to Energy Industry Revenue (Million) Forecast, by Application 2020 & 2033
- Table 70: Egypt Waste to Energy Industry Volume (Gigawatt) Forecast, by Application 2020 & 2033
- Table 71: Rest of Middle East and Africa Waste to Energy Industry Revenue (Million) Forecast, by Application 2020 & 2033
- Table 72: Rest of Middle East and Africa Waste to Energy Industry Volume (Gigawatt) Forecast, by Application 2020 & 2033
- Table 73: Global Waste to Energy Industry Revenue Million Forecast, by Technology 2020 & 2033
- Table 74: Global Waste to Energy Industry Volume Gigawatt Forecast, by Technology 2020 & 2033
- Table 75: Global Waste to Energy Industry Revenue Million Forecast, by Country 2020 & 2033
- Table 76: Global Waste to Energy Industry Volume Gigawatt Forecast, by Country 2020 & 2033
- Table 77: Brazil Waste to Energy Industry Revenue (Million) Forecast, by Application 2020 & 2033
- Table 78: Brazil Waste to Energy Industry Volume (Gigawatt) Forecast, by Application 2020 & 2033
- Table 79: Argentina Waste to Energy Industry Revenue (Million) Forecast, by Application 2020 & 2033
- Table 80: Argentina Waste to Energy Industry Volume (Gigawatt) Forecast, by Application 2020 & 2033
- Table 81: Colombia Waste to Energy Industry Revenue (Million) Forecast, by Application 2020 & 2033
- Table 82: Colombia Waste to Energy Industry Volume (Gigawatt) Forecast, by Application 2020 & 2033
- Table 83: Rest of South America Waste to Energy Industry Revenue (Million) Forecast, by Application 2020 & 2033
- Table 84: Rest of South America Waste to Energy Industry Volume (Gigawatt) Forecast, by Application 2020 & 2033
Frequently Asked Questions
1. What is the projected Compound Annual Growth Rate (CAGR) of the Waste to Energy Industry?
The projected CAGR is approximately 11.22%.
2. Which companies are prominent players in the Waste to Energy Industry?
Key companies in the market include Covanta Holding Corp, A2A SpA, China Everbright Group, Wheelabrator Technologies Holdings Inc, Martin GmbH, Hitachi Zosen Corp, Suez Group, China Jinjiang Environment Holding Co Ltd, Veolia Environnement SA, Waste Management Inc, Babcock & Wilcox Enterprises Inc, Xcel Energy Inc, MVV Energie AG, Mitsubishi Heavy Industries Ltd.
3. What are the main segments of the Waste to Energy Industry?
The market segments include Technology.
4. Can you provide details about the market size?
The market size is estimated to be USD 38.37 Million as of 2022.
5. What are some drivers contributing to market growth?
4.; Increasing Amount of Waste Generation. Growing Concern for Waste Management to Meet the Needs for Sustainable Urban Living4.; Increasing Focus on Non-fossil Fuel Sources of Energy.
6. What are the notable trends driving market growth?
Thermal-based Waste-to-Energy Segment to Dominate the Market.
7. Are there any restraints impacting market growth?
4.; Expensive Nature of Incinerators.
8. Can you provide examples of recent developments in the market?
April 2023: Egypt signed a USD 120 million contract to design, develop, own, and manage the country's first solid waste-to-electricity facility. The contract was signed by the Giza governorate and a partnership consisting of Renergy Egypt and the National Authority for Military Production. As part of Egypt Vision 2030, the Abou Rawash, Giza plant would convert 1,200 metric tons of household solid waste per day to power.
9. What pricing options are available for accessing the report?
Pricing options include single-user, multi-user, and enterprise licenses priced at USD 4750, USD 5250, and USD 8750 respectively.
10. Is the market size provided in terms of value or volume?
The market size is provided in terms of value, measured in Million and volume, measured in Gigawatt.
11. Are there any specific market keywords associated with the report?
Yes, the market keyword associated with the report is "Waste to Energy Industry," which aids in identifying and referencing the specific market segment covered.
12. How do I determine which pricing option suits my needs best?
The pricing options vary based on user requirements and access needs. Individual users may opt for single-user licenses, while businesses requiring broader access may choose multi-user or enterprise licenses for cost-effective access to the report.
13. Are there any additional resources or data provided in the Waste to Energy Industry report?
While the report offers comprehensive insights, it's advisable to review the specific contents or supplementary materials provided to ascertain if additional resources or data are available.
14. How can I stay updated on further developments or reports in the Waste to Energy Industry?
To stay informed about further developments, trends, and reports in the Waste to Energy Industry, consider subscribing to industry newsletters, following relevant companies and organizations, or regularly checking reputable industry news sources and publications.
Methodology
Step 1 - Identification of Relevant Samples Size from Population Database


Step 2 - Approaches for Defining Global Market Size (Value, Volume* & Price*)

Note*: In applicable scenarios
Step 3 - Data Sources
Primary Research
- Web Analytics
- Survey Reports
- Research Institute
- Latest Research Reports
- Opinion Leaders
Secondary Research
- Annual Reports
- White Paper
- Latest Press Release
- Industry Association
- Paid Database
- Investor Presentations

Step 4 - Data Triangulation
Involves using different sources of information in order to increase the validity of a study
These sources are likely to be stakeholders in a program - participants, other researchers, program staff, other community members, and so on.
Then we put all data in single framework & apply various statistical tools to find out the dynamic on the market.
During the analysis stage, feedback from the stakeholder groups would be compared to determine areas of agreement as well as areas of divergence