
Key Insights
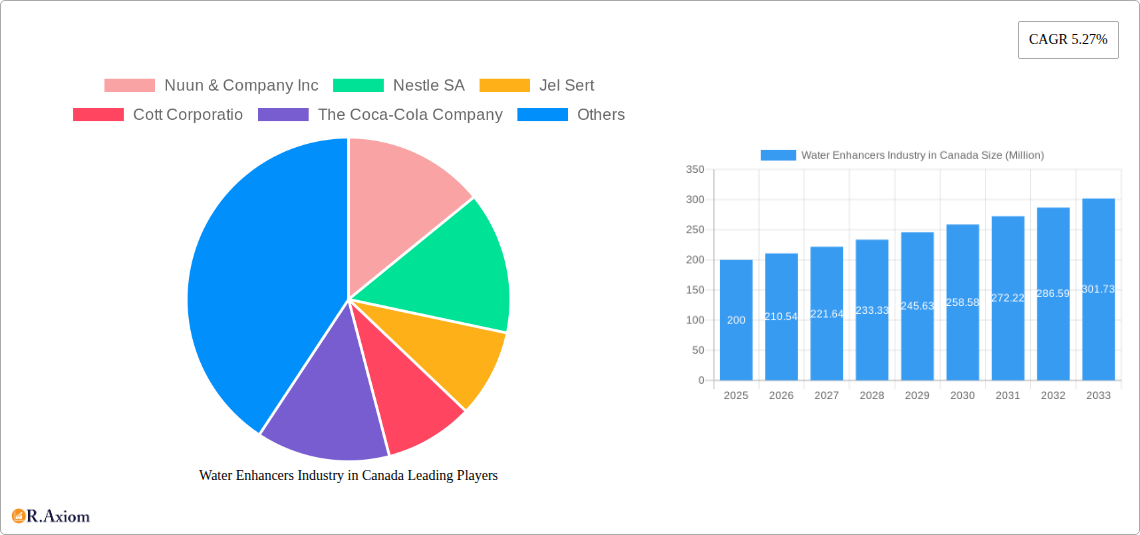
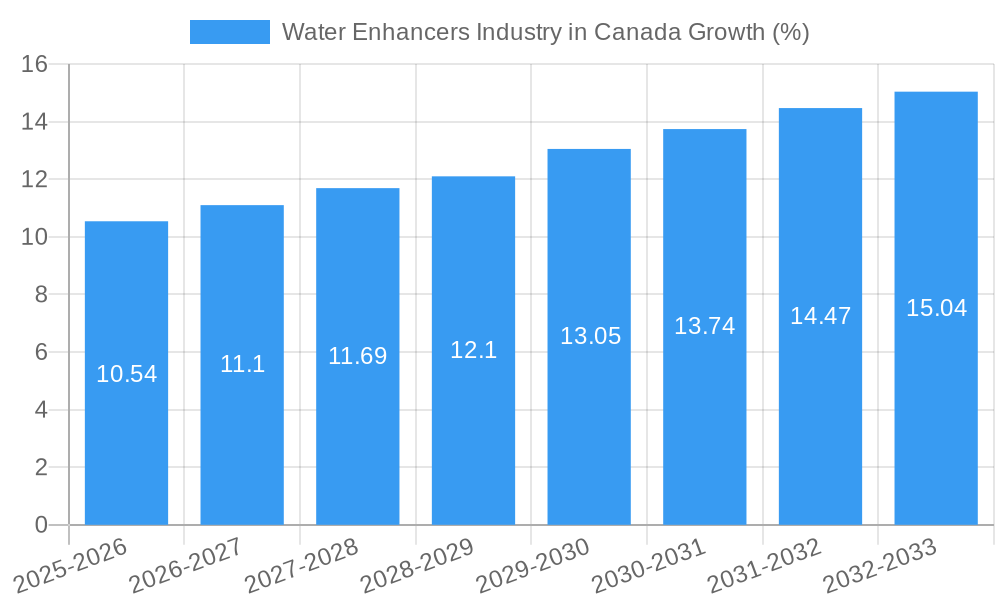
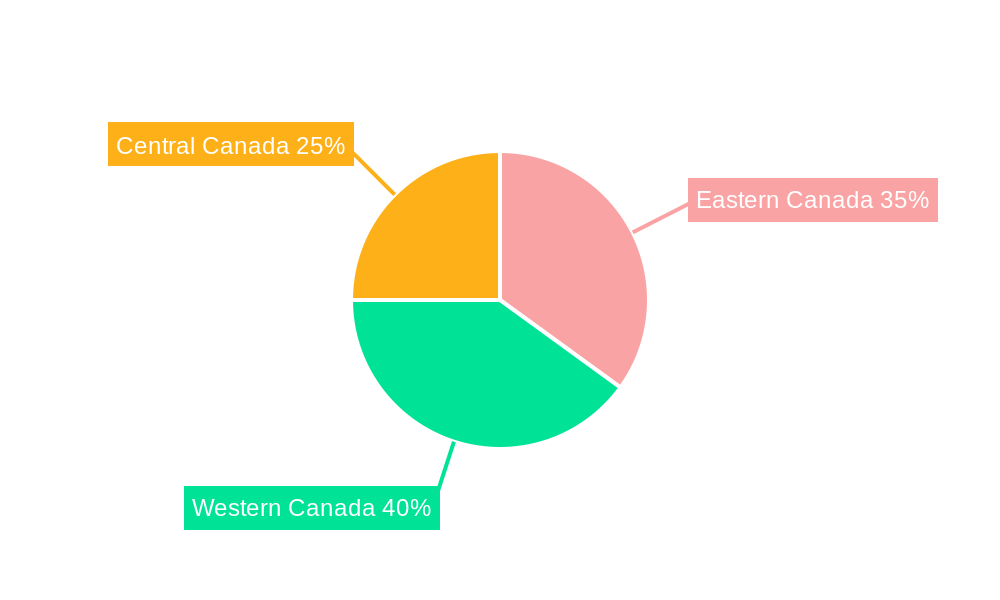
The Canadian water enhancer market, valued at approximately $200 million in 2025, is projected to experience robust growth, driven by increasing health consciousness among consumers and a rising preference for healthier beverage options. The market's Compound Annual Growth Rate (CAGR) of 5.27% from 2025 to 2033 signifies a considerable expansion, with the market expected to surpass $300 million by 2033. Key drivers include the growing popularity of customized beverages, rising demand for functional drinks offering added vitamins and electrolytes, and increased awareness of the negative health impacts of sugary sodas. Trends such as the introduction of innovative flavors, the use of natural sweeteners, and the increasing availability of water enhancers through online channels are further fueling market growth. While price sensitivity and the presence of established beverage brands present some restraints, the overall market outlook remains positive. The segment breakdown shows strong growth in online channels and pharmacies/health stores, reflecting consumer preference for convenience and health-focused product sourcing. Major players like Nuun & Company Inc., Nestle SA, and Coca-Cola are capitalizing on this growth by launching new products and expanding their distribution networks. Regional variations in market performance are anticipated, with Western Canada potentially exhibiting faster growth due to its higher concentration of health-conscious consumers.
The competitive landscape in the Canadian water enhancer market is characterized by a mix of established multinational corporations and smaller niche players. The presence of major players ensures a high level of product innovation and marketing efforts, which helps drive market growth. However, smaller companies offering specialized or organic options are also carving a niche for themselves. Future growth will depend heavily on successful product differentiation, effective marketing strategies targeting specific consumer demographics (e.g., athletes, health-conscious individuals), and the continued expansion of online retail channels. The market's success will also hinge on addressing consumer concerns about artificial sweeteners and the overall transparency of ingredients. Further research into regional preferences and consumer behavior will be crucial for companies to optimize their strategies and capture market share.
Water Enhancers Industry in Canada: A Comprehensive Market Report (2019-2033)
This comprehensive report provides an in-depth analysis of the Canadian water enhancers industry, offering invaluable insights for businesses, investors, and stakeholders. Covering the period from 2019 to 2033, with a base year of 2025 and a forecast period of 2025-2033, this report meticulously examines market dynamics, competitive landscapes, and future growth potential. The report leverages data from the historical period (2019-2024) to provide accurate projections. Key players analyzed include Nuun & Company Inc, Nestle SA, Jel Sert, Cott Corporation, The Coca-Cola Company, PepsiCo INC, Loblaw Inc, Wisdom Natural Brands, and Kraft Heinz Company.
Water Enhancers Industry in Canada Market Concentration & Innovation
This section analyzes the level of market concentration within the Canadian water enhancers industry, identifying key players and their market share. We assess the role of innovation, including new product development and technological advancements, in driving market growth. The report also examines the regulatory landscape, the presence of substitute products, evolving end-user trends (health-conscious consumers, for example), and merger & acquisition (M&A) activities within the sector. We will quantify market share for key players and provide details on notable M&A deals and their values (in Millions). For example, a xx% market share may be attributed to Nestle SA in 2024, while M&A activity in the period may have totaled approximately xx Million. This analysis will further highlight the impact of these factors on market competition and future growth. The influence of government regulations on product formulation and labeling will also be addressed. The analysis will include:
- Market share analysis of top 10 players.
- Detailed overview of recent M&A activities with estimated deal values (in Millions).
- Assessment of innovation drivers, including technological advancements and product diversification.
- Analysis of regulatory frameworks and their impact on market dynamics.
- Evaluation of substitute products and their competitive threat.
- Examination of end-user trends and their implications for industry growth.
Water Enhancers Industry in Canada Industry Trends & Insights
This section delves into the key trends and insights shaping the Canadian water enhancers market. We will analyze market growth drivers (e.g., increasing health consciousness, rising disposable incomes), examine the impact of technological disruptions (e.g., e-commerce growth, innovative packaging), assess evolving consumer preferences (e.g., demand for natural and organic products, functional beverages), and explore the competitive dynamics between major players. We will quantify market growth using the Compound Annual Growth Rate (CAGR) for the forecast period and analyze market penetration rates across various segments. The impact of economic fluctuations and changing consumer buying patterns will also be investigated. The analysis will show projected market sizes and CAGR, showcasing the dynamism of the sector. For example, the market is projected to grow at a CAGR of xx% between 2025 and 2033, achieving a market size of xx Million by 2033.
Dominant Markets & Segments in Water Enhancers Industry in Canada
This section identifies the dominant market segment within the Canadian water enhancers industry based on distribution channels. We’ll conduct a detailed analysis of the leading segment, exploring its growth drivers and competitive dynamics. The report will assess the relative performance of Pharmacies & Health Stores, Convenience Stores, Hypermarkets/Supermarkets, Online Channels, and Other distribution channels. The dominance analysis will be supported by key factors like:
- Pharmacies & Health Stores: Focus on the health-conscious consumer base and the role of professional recommendations.
- Convenience Stores: Emphasize accessibility and impulse purchases.
- Hypermarkets/Supermarkets: Highlight volume sales and competitive pricing strategies.
- Online Channels: Analyze the rise of e-commerce and its impact on consumer reach.
- Other distribution channels: Identify niche markets and emerging distribution models.
The dominant segment's analysis will include economic policies, infrastructure development, and consumer behavior patterns that contribute to its market leadership. For instance, the strong growth of online channels could be attributed to factors such as rising internet penetration and increasing preference for home delivery. A detailed explanation and quantitative data of market share for each segment will be provided.
Water Enhancers Industry in Canada Product Developments
This section summarizes recent product innovations, highlighting key applications and competitive advantages. We will emphasize technological trends such as the incorporation of natural sweeteners, functional ingredients (vitamins, electrolytes), and sustainable packaging options. The analysis will assess how these innovations meet market demand and provide competitive edge to the manufacturers.
Report Scope & Segmentation Analysis
This section details the market segmentation by distribution channel: Pharmacies & Health Stores, Convenience Stores, Hypermarkets/Supermarkets, Online Channels, and Other distribution channels. Each segment's analysis will include growth projections, market size (in Millions), and competitive dynamics. We will forecast segment-specific market growth and provide insights into the competitive landscape within each channel. For example, we may predict that the Online Channels segment will experience the highest growth rate, driven by changing consumer habits.
Key Drivers of Water Enhancers Industry in Canada Growth
This section outlines the key factors driving growth in the Canadian water enhancers industry. We will focus on technological advancements (e.g., improved formulations, innovative packaging), economic factors (e.g., rising disposable incomes, health and wellness trends), and favorable regulatory environments. Specific examples of each driver will be included to illustrate their impact on market expansion.
Challenges in the Water Enhancers Industry in Canada Sector
This section identifies and analyzes the challenges facing the Canadian water enhancers industry. This includes regulatory hurdles (e.g., labeling requirements, ingredient restrictions), supply chain disruptions (e.g., sourcing of raw materials, logistics), and intense competition. We will quantify the impact of these challenges on market growth, if possible, through the use of data and figures.
Emerging Opportunities in Water Enhancers Industry in Canada
This section highlights emerging trends and opportunities within the Canadian water enhancers market. We will focus on new market segments (e.g., specialized sports drinks), innovative technologies (e.g., personalized beverage formulations), and evolving consumer preferences (e.g., growing demand for functional beverages). Specific examples will be used to illustrate the potential for growth in these areas.
Leading Players in the Water Enhancers Industry in Canada Market
- Nuun & Company Inc
- Nestle SA
- Jel Sert
- Cott Corporation
- The Coca-Cola Company
- PepsiCo INC
- Loblaw Inc
- Wisdom Natural Brands
- Kraft Heinz Company
Key Developments in Water Enhancers Industry in Canada Industry
- [Month, Year]: Launch of a new line of organic water enhancers by [Company Name]. This impacted the market by increasing consumer choice in the organic segment.
- [Month, Year]: Acquisition of [Company A] by [Company B] for xx Million. This led to increased market consolidation.
- [Month, Year]: Introduction of new packaging technology focusing on sustainability by [Company Name]. This improved the environmental profile of the product line.
- [Month, Year]: New health regulations implemented affecting water enhancer labeling and ingredient usage. This prompted reformulations across many products.
Strategic Outlook for Water Enhancers Industry in Canada Market
The Canadian water enhancers market presents significant growth potential driven by increasing health awareness, the rising popularity of functional beverages, and ongoing innovation. Future market expansion will likely be fueled by the development of new product formulations, increased penetration of online sales channels, and the strategic expansion of existing players. The focus on sustainability and health-conscious offerings will continue to shape the industry's trajectory, presenting exciting opportunities for both established and emerging players.
Water Enhancers Industry in Canada Segmentation
-
1. Distribution Channel
- 1.1. Pharmacies & Health Stores
- 1.2. Convenience Stores
- 1.3. Hypermarkets/Supermarkets
- 1.4. Online Channels
- 1.5. Other distribution channels
Water Enhancers Industry in Canada Segmentation By Geography
-
1. North America
- 1.1. United States
- 1.2. Canada
- 1.3. Mexico
-
2. South America
- 2.1. Brazil
- 2.2. Argentina
- 2.3. Rest of South America
-
3. Europe
- 3.1. United Kingdom
- 3.2. Germany
- 3.3. France
- 3.4. Italy
- 3.5. Spain
- 3.6. Russia
- 3.7. Benelux
- 3.8. Nordics
- 3.9. Rest of Europe
-
4. Middle East & Africa
- 4.1. Turkey
- 4.2. Israel
- 4.3. GCC
- 4.4. North Africa
- 4.5. South Africa
- 4.6. Rest of Middle East & Africa
-
5. Asia Pacific
- 5.1. China
- 5.2. India
- 5.3. Japan
- 5.4. South Korea
- 5.5. ASEAN
- 5.6. Oceania
- 5.7. Rest of Asia Pacific
Water Enhancers Industry in Canada REPORT HIGHLIGHTS
| Aspects | Details |
|---|---|
| Study Period | 2019-2033 |
| Base Year | 2024 |
| Estimated Year | 2025 |
| Forecast Period | 2025-2033 |
| Historical Period | 2019-2024 |
| Growth Rate | CAGR of 5.27% from 2019-2033 |
| Segmentation |
|
Table of Contents
- 1. Introduction
- 1.1. Research Scope
- 1.2. Market Segmentation
- 1.3. Research Methodology
- 1.4. Definitions and Assumptions
- 2. Executive Summary
- 2.1. Introduction
- 3. Market Dynamics
- 3.1. Introduction
- 3.2. Market Drivers
- 3.2.1. Increasing Sports Participation; Increasing Awareness about Health and Fitness
- 3.3. Market Restrains
- 3.3.1. Adverse Effects of Overconsumption of Products
- 3.4. Market Trends
- 3.4.1. The Popularization of Functional Beverages is Likely to Foster the Market Growth
- 4. Market Factor Analysis
- 4.1. Porters Five Forces
- 4.2. Supply/Value Chain
- 4.3. PESTEL analysis
- 4.4. Market Entropy
- 4.5. Patent/Trademark Analysis
- 5. Global Water Enhancers Industry in Canada Analysis, Insights and Forecast, 2019-2031
- 5.1. Market Analysis, Insights and Forecast - by Distribution Channel
- 5.1.1. Pharmacies & Health Stores
- 5.1.2. Convenience Stores
- 5.1.3. Hypermarkets/Supermarkets
- 5.1.4. Online Channels
- 5.1.5. Other distribution channels
- 5.2. Market Analysis, Insights and Forecast - by Region
- 5.2.1. North America
- 5.2.2. South America
- 5.2.3. Europe
- 5.2.4. Middle East & Africa
- 5.2.5. Asia Pacific
- 5.1. Market Analysis, Insights and Forecast - by Distribution Channel
- 6. North America Water Enhancers Industry in Canada Analysis, Insights and Forecast, 2019-2031
- 6.1. Market Analysis, Insights and Forecast - by Distribution Channel
- 6.1.1. Pharmacies & Health Stores
- 6.1.2. Convenience Stores
- 6.1.3. Hypermarkets/Supermarkets
- 6.1.4. Online Channels
- 6.1.5. Other distribution channels
- 6.1. Market Analysis, Insights and Forecast - by Distribution Channel
- 7. South America Water Enhancers Industry in Canada Analysis, Insights and Forecast, 2019-2031
- 7.1. Market Analysis, Insights and Forecast - by Distribution Channel
- 7.1.1. Pharmacies & Health Stores
- 7.1.2. Convenience Stores
- 7.1.3. Hypermarkets/Supermarkets
- 7.1.4. Online Channels
- 7.1.5. Other distribution channels
- 7.1. Market Analysis, Insights and Forecast - by Distribution Channel
- 8. Europe Water Enhancers Industry in Canada Analysis, Insights and Forecast, 2019-2031
- 8.1. Market Analysis, Insights and Forecast - by Distribution Channel
- 8.1.1. Pharmacies & Health Stores
- 8.1.2. Convenience Stores
- 8.1.3. Hypermarkets/Supermarkets
- 8.1.4. Online Channels
- 8.1.5. Other distribution channels
- 8.1. Market Analysis, Insights and Forecast - by Distribution Channel
- 9. Middle East & Africa Water Enhancers Industry in Canada Analysis, Insights and Forecast, 2019-2031
- 9.1. Market Analysis, Insights and Forecast - by Distribution Channel
- 9.1.1. Pharmacies & Health Stores
- 9.1.2. Convenience Stores
- 9.1.3. Hypermarkets/Supermarkets
- 9.1.4. Online Channels
- 9.1.5. Other distribution channels
- 9.1. Market Analysis, Insights and Forecast - by Distribution Channel
- 10. Asia Pacific Water Enhancers Industry in Canada Analysis, Insights and Forecast, 2019-2031
- 10.1. Market Analysis, Insights and Forecast - by Distribution Channel
- 10.1.1. Pharmacies & Health Stores
- 10.1.2. Convenience Stores
- 10.1.3. Hypermarkets/Supermarkets
- 10.1.4. Online Channels
- 10.1.5. Other distribution channels
- 10.1. Market Analysis, Insights and Forecast - by Distribution Channel
- 11. Eastern Canada Water Enhancers Industry in Canada Analysis, Insights and Forecast, 2019-2031
- 12. Western Canada Water Enhancers Industry in Canada Analysis, Insights and Forecast, 2019-2031
- 13. Central Canada Water Enhancers Industry in Canada Analysis, Insights and Forecast, 2019-2031
- 14. Competitive Analysis
- 14.1. Global Market Share Analysis 2024
- 14.2. Company Profiles
- 14.2.1 Nuun & Company Inc
- 14.2.1.1. Overview
- 14.2.1.2. Products
- 14.2.1.3. SWOT Analysis
- 14.2.1.4. Recent Developments
- 14.2.1.5. Financials (Based on Availability)
- 14.2.2 Nestle SA
- 14.2.2.1. Overview
- 14.2.2.2. Products
- 14.2.2.3. SWOT Analysis
- 14.2.2.4. Recent Developments
- 14.2.2.5. Financials (Based on Availability)
- 14.2.3 Jel Sert
- 14.2.3.1. Overview
- 14.2.3.2. Products
- 14.2.3.3. SWOT Analysis
- 14.2.3.4. Recent Developments
- 14.2.3.5. Financials (Based on Availability)
- 14.2.4 Cott Corporatio
- 14.2.4.1. Overview
- 14.2.4.2. Products
- 14.2.4.3. SWOT Analysis
- 14.2.4.4. Recent Developments
- 14.2.4.5. Financials (Based on Availability)
- 14.2.5 The Coca-Cola Company
- 14.2.5.1. Overview
- 14.2.5.2. Products
- 14.2.5.3. SWOT Analysis
- 14.2.5.4. Recent Developments
- 14.2.5.5. Financials (Based on Availability)
- 14.2.6 PepsiCo INC
- 14.2.6.1. Overview
- 14.2.6.2. Products
- 14.2.6.3. SWOT Analysis
- 14.2.6.4. Recent Developments
- 14.2.6.5. Financials (Based on Availability)
- 14.2.7 Loblaw Inc
- 14.2.7.1. Overview
- 14.2.7.2. Products
- 14.2.7.3. SWOT Analysis
- 14.2.7.4. Recent Developments
- 14.2.7.5. Financials (Based on Availability)
- 14.2.8 Wisdom Natural Brands
- 14.2.8.1. Overview
- 14.2.8.2. Products
- 14.2.8.3. SWOT Analysis
- 14.2.8.4. Recent Developments
- 14.2.8.5. Financials (Based on Availability)
- 14.2.9 Kraft Heinz Company
- 14.2.9.1. Overview
- 14.2.9.2. Products
- 14.2.9.3. SWOT Analysis
- 14.2.9.4. Recent Developments
- 14.2.9.5. Financials (Based on Availability)
- 14.2.1 Nuun & Company Inc
List of Figures
- Figure 1: Global Water Enhancers Industry in Canada Revenue Breakdown (Million, %) by Region 2024 & 2032
- Figure 2: Canada Water Enhancers Industry in Canada Revenue (Million), by Country 2024 & 2032
- Figure 3: Canada Water Enhancers Industry in Canada Revenue Share (%), by Country 2024 & 2032
- Figure 4: North America Water Enhancers Industry in Canada Revenue (Million), by Distribution Channel 2024 & 2032
- Figure 5: North America Water Enhancers Industry in Canada Revenue Share (%), by Distribution Channel 2024 & 2032
- Figure 6: North America Water Enhancers Industry in Canada Revenue (Million), by Country 2024 & 2032
- Figure 7: North America Water Enhancers Industry in Canada Revenue Share (%), by Country 2024 & 2032
- Figure 8: South America Water Enhancers Industry in Canada Revenue (Million), by Distribution Channel 2024 & 2032
- Figure 9: South America Water Enhancers Industry in Canada Revenue Share (%), by Distribution Channel 2024 & 2032
- Figure 10: South America Water Enhancers Industry in Canada Revenue (Million), by Country 2024 & 2032
- Figure 11: South America Water Enhancers Industry in Canada Revenue Share (%), by Country 2024 & 2032
- Figure 12: Europe Water Enhancers Industry in Canada Revenue (Million), by Distribution Channel 2024 & 2032
- Figure 13: Europe Water Enhancers Industry in Canada Revenue Share (%), by Distribution Channel 2024 & 2032
- Figure 14: Europe Water Enhancers Industry in Canada Revenue (Million), by Country 2024 & 2032
- Figure 15: Europe Water Enhancers Industry in Canada Revenue Share (%), by Country 2024 & 2032
- Figure 16: Middle East & Africa Water Enhancers Industry in Canada Revenue (Million), by Distribution Channel 2024 & 2032
- Figure 17: Middle East & Africa Water Enhancers Industry in Canada Revenue Share (%), by Distribution Channel 2024 & 2032
- Figure 18: Middle East & Africa Water Enhancers Industry in Canada Revenue (Million), by Country 2024 & 2032
- Figure 19: Middle East & Africa Water Enhancers Industry in Canada Revenue Share (%), by Country 2024 & 2032
- Figure 20: Asia Pacific Water Enhancers Industry in Canada Revenue (Million), by Distribution Channel 2024 & 2032
- Figure 21: Asia Pacific Water Enhancers Industry in Canada Revenue Share (%), by Distribution Channel 2024 & 2032
- Figure 22: Asia Pacific Water Enhancers Industry in Canada Revenue (Million), by Country 2024 & 2032
- Figure 23: Asia Pacific Water Enhancers Industry in Canada Revenue Share (%), by Country 2024 & 2032
List of Tables
- Table 1: Global Water Enhancers Industry in Canada Revenue Million Forecast, by Region 2019 & 2032
- Table 2: Global Water Enhancers Industry in Canada Revenue Million Forecast, by Distribution Channel 2019 & 2032
- Table 3: Global Water Enhancers Industry in Canada Revenue Million Forecast, by Region 2019 & 2032
- Table 4: Global Water Enhancers Industry in Canada Revenue Million Forecast, by Country 2019 & 2032
- Table 5: Eastern Canada Water Enhancers Industry in Canada Revenue (Million) Forecast, by Application 2019 & 2032
- Table 6: Western Canada Water Enhancers Industry in Canada Revenue (Million) Forecast, by Application 2019 & 2032
- Table 7: Central Canada Water Enhancers Industry in Canada Revenue (Million) Forecast, by Application 2019 & 2032
- Table 8: Global Water Enhancers Industry in Canada Revenue Million Forecast, by Distribution Channel 2019 & 2032
- Table 9: Global Water Enhancers Industry in Canada Revenue Million Forecast, by Country 2019 & 2032
- Table 10: United States Water Enhancers Industry in Canada Revenue (Million) Forecast, by Application 2019 & 2032
- Table 11: Canada Water Enhancers Industry in Canada Revenue (Million) Forecast, by Application 2019 & 2032
- Table 12: Mexico Water Enhancers Industry in Canada Revenue (Million) Forecast, by Application 2019 & 2032
- Table 13: Global Water Enhancers Industry in Canada Revenue Million Forecast, by Distribution Channel 2019 & 2032
- Table 14: Global Water Enhancers Industry in Canada Revenue Million Forecast, by Country 2019 & 2032
- Table 15: Brazil Water Enhancers Industry in Canada Revenue (Million) Forecast, by Application 2019 & 2032
- Table 16: Argentina Water Enhancers Industry in Canada Revenue (Million) Forecast, by Application 2019 & 2032
- Table 17: Rest of South America Water Enhancers Industry in Canada Revenue (Million) Forecast, by Application 2019 & 2032
- Table 18: Global Water Enhancers Industry in Canada Revenue Million Forecast, by Distribution Channel 2019 & 2032
- Table 19: Global Water Enhancers Industry in Canada Revenue Million Forecast, by Country 2019 & 2032
- Table 20: United Kingdom Water Enhancers Industry in Canada Revenue (Million) Forecast, by Application 2019 & 2032
- Table 21: Germany Water Enhancers Industry in Canada Revenue (Million) Forecast, by Application 2019 & 2032
- Table 22: France Water Enhancers Industry in Canada Revenue (Million) Forecast, by Application 2019 & 2032
- Table 23: Italy Water Enhancers Industry in Canada Revenue (Million) Forecast, by Application 2019 & 2032
- Table 24: Spain Water Enhancers Industry in Canada Revenue (Million) Forecast, by Application 2019 & 2032
- Table 25: Russia Water Enhancers Industry in Canada Revenue (Million) Forecast, by Application 2019 & 2032
- Table 26: Benelux Water Enhancers Industry in Canada Revenue (Million) Forecast, by Application 2019 & 2032
- Table 27: Nordics Water Enhancers Industry in Canada Revenue (Million) Forecast, by Application 2019 & 2032
- Table 28: Rest of Europe Water Enhancers Industry in Canada Revenue (Million) Forecast, by Application 2019 & 2032
- Table 29: Global Water Enhancers Industry in Canada Revenue Million Forecast, by Distribution Channel 2019 & 2032
- Table 30: Global Water Enhancers Industry in Canada Revenue Million Forecast, by Country 2019 & 2032
- Table 31: Turkey Water Enhancers Industry in Canada Revenue (Million) Forecast, by Application 2019 & 2032
- Table 32: Israel Water Enhancers Industry in Canada Revenue (Million) Forecast, by Application 2019 & 2032
- Table 33: GCC Water Enhancers Industry in Canada Revenue (Million) Forecast, by Application 2019 & 2032
- Table 34: North Africa Water Enhancers Industry in Canada Revenue (Million) Forecast, by Application 2019 & 2032
- Table 35: South Africa Water Enhancers Industry in Canada Revenue (Million) Forecast, by Application 2019 & 2032
- Table 36: Rest of Middle East & Africa Water Enhancers Industry in Canada Revenue (Million) Forecast, by Application 2019 & 2032
- Table 37: Global Water Enhancers Industry in Canada Revenue Million Forecast, by Distribution Channel 2019 & 2032
- Table 38: Global Water Enhancers Industry in Canada Revenue Million Forecast, by Country 2019 & 2032
- Table 39: China Water Enhancers Industry in Canada Revenue (Million) Forecast, by Application 2019 & 2032
- Table 40: India Water Enhancers Industry in Canada Revenue (Million) Forecast, by Application 2019 & 2032
- Table 41: Japan Water Enhancers Industry in Canada Revenue (Million) Forecast, by Application 2019 & 2032
- Table 42: South Korea Water Enhancers Industry in Canada Revenue (Million) Forecast, by Application 2019 & 2032
- Table 43: ASEAN Water Enhancers Industry in Canada Revenue (Million) Forecast, by Application 2019 & 2032
- Table 44: Oceania Water Enhancers Industry in Canada Revenue (Million) Forecast, by Application 2019 & 2032
- Table 45: Rest of Asia Pacific Water Enhancers Industry in Canada Revenue (Million) Forecast, by Application 2019 & 2032
Frequently Asked Questions
1. What is the projected Compound Annual Growth Rate (CAGR) of the Water Enhancers Industry in Canada?
The projected CAGR is approximately 5.27%.
2. Which companies are prominent players in the Water Enhancers Industry in Canada?
Key companies in the market include Nuun & Company Inc, Nestle SA, Jel Sert, Cott Corporatio, The Coca-Cola Company, PepsiCo INC, Loblaw Inc, Wisdom Natural Brands, Kraft Heinz Company.
3. What are the main segments of the Water Enhancers Industry in Canada?
The market segments include Distribution Channel.
4. Can you provide details about the market size?
The market size is estimated to be USD XX Million as of 2022.
5. What are some drivers contributing to market growth?
Increasing Sports Participation; Increasing Awareness about Health and Fitness.
6. What are the notable trends driving market growth?
The Popularization of Functional Beverages is Likely to Foster the Market Growth.
7. Are there any restraints impacting market growth?
Adverse Effects of Overconsumption of Products.
8. Can you provide examples of recent developments in the market?
N/A
9. What pricing options are available for accessing the report?
Pricing options include single-user, multi-user, and enterprise licenses priced at USD 3800, USD 4500, and USD 5800 respectively.
10. Is the market size provided in terms of value or volume?
The market size is provided in terms of value, measured in Million.
11. Are there any specific market keywords associated with the report?
Yes, the market keyword associated with the report is "Water Enhancers Industry in Canada," which aids in identifying and referencing the specific market segment covered.
12. How do I determine which pricing option suits my needs best?
The pricing options vary based on user requirements and access needs. Individual users may opt for single-user licenses, while businesses requiring broader access may choose multi-user or enterprise licenses for cost-effective access to the report.
13. Are there any additional resources or data provided in the Water Enhancers Industry in Canada report?
While the report offers comprehensive insights, it's advisable to review the specific contents or supplementary materials provided to ascertain if additional resources or data are available.
14. How can I stay updated on further developments or reports in the Water Enhancers Industry in Canada?
To stay informed about further developments, trends, and reports in the Water Enhancers Industry in Canada, consider subscribing to industry newsletters, following relevant companies and organizations, or regularly checking reputable industry news sources and publications.
Methodology
Step 1 - Identification of Relevant Samples Size from Population Database


Step 2 - Approaches for Defining Global Market Size (Value, Volume* & Price*)

Note*: In applicable scenarios
Step 3 - Data Sources
Primary Research
- Web Analytics
- Survey Reports
- Research Institute
- Latest Research Reports
- Opinion Leaders
Secondary Research
- Annual Reports
- White Paper
- Latest Press Release
- Industry Association
- Paid Database
- Investor Presentations

Step 4 - Data Triangulation
Involves using different sources of information in order to increase the validity of a study
These sources are likely to be stakeholders in a program - participants, other researchers, program staff, other community members, and so on.
Then we put all data in single framework & apply various statistical tools to find out the dynamic on the market.
During the analysis stage, feedback from the stakeholder groups would be compared to determine areas of agreement as well as areas of divergence


