
Key Insights
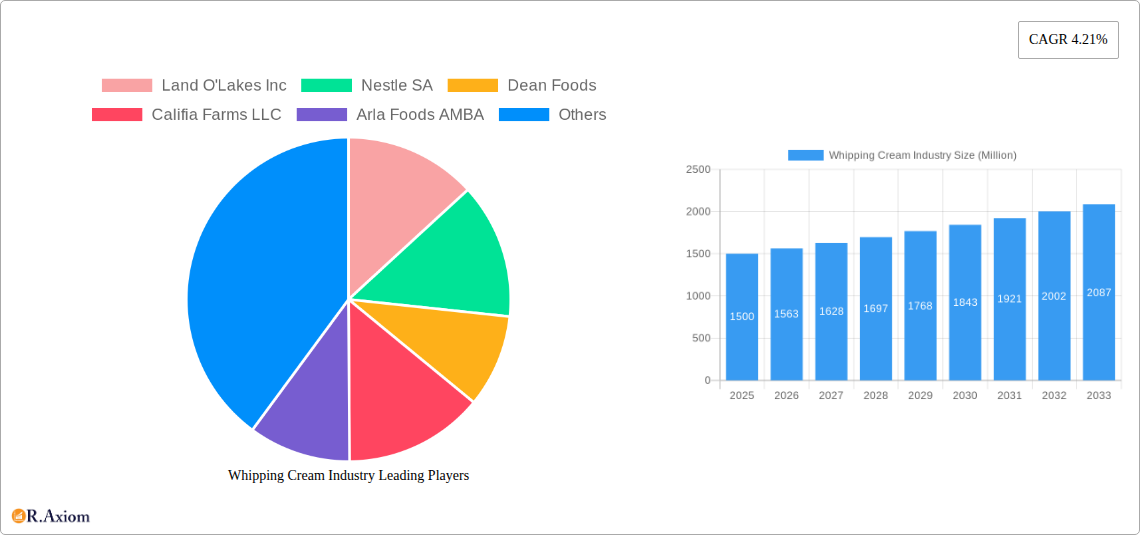
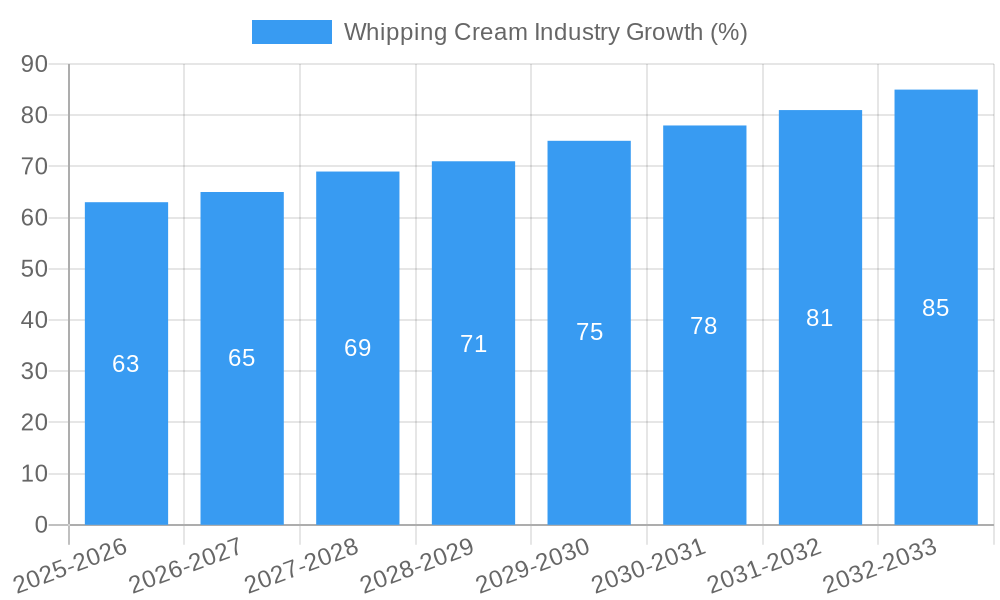
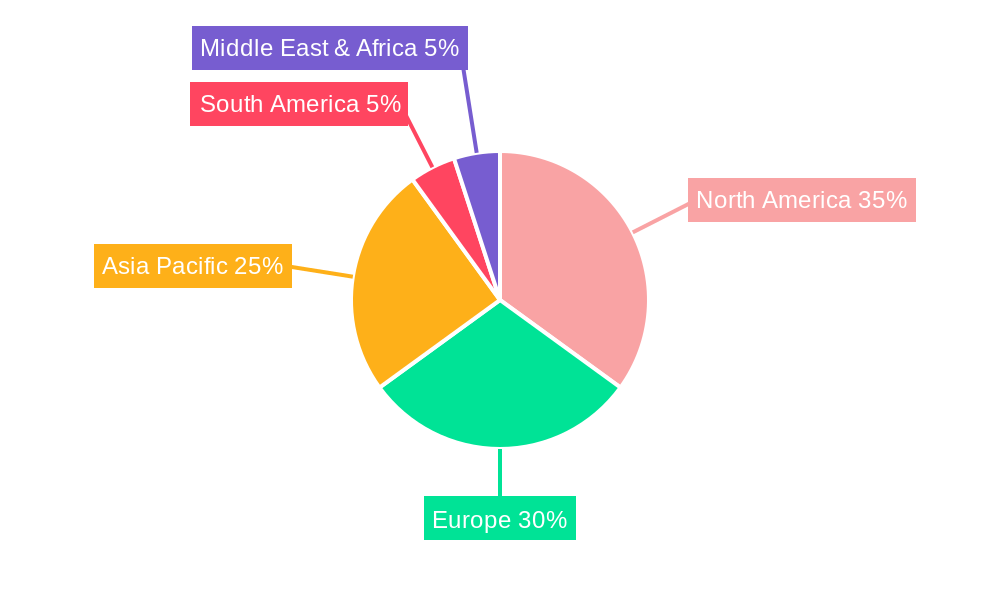
The global whipping cream market, valued at approximately $XX million in 2025, is projected to experience robust growth, driven by several key factors. The rising popularity of desserts and beverages incorporating whipped cream, particularly in developed nations with established café cultures and high disposable incomes, fuels substantial demand. The increasing preference for convenience foods and ready-to-use products further contributes to market expansion. Growth is also fueled by the diverse product offerings, encompassing dairy-based and non-dairy alternatives catering to various dietary needs and preferences, along with innovative product launches featuring unique flavors and textures. Supermarkets and hypermarkets remain the dominant distribution channels, but the online segment is witnessing significant expansion, driven by the rise of e-commerce and online grocery deliveries. While the market faces restraints such as fluctuating dairy prices and growing consumer health concerns related to high fat and sugar content, the introduction of lighter, healthier alternatives and the increasing demand for premium and specialty whipped creams are offsetting these challenges. The projected CAGR of 4.21% from 2025 to 2033 suggests a steady and consistent market expansion across diverse regions, with North America and Europe expected to maintain significant market share due to high consumption rates. The Asia Pacific region also presents a substantial growth opportunity due to increasing urbanization and changing consumer lifestyles.
The competitive landscape is characterized by a mix of established multinational players like Nestle SA and Land O'Lakes Inc., and smaller, specialized companies like Califia Farms LLC, focusing on niche segments like organic or plant-based whipping cream. These companies are continuously investing in research and development to innovate new product formulations and enhance their market positioning. Strategic partnerships, acquisitions, and new product launches are key competitive strategies adopted to gain a stronger foothold in the expanding market. The market segmentation by type (dairy-based and non-dairy-based) and distribution channel provides valuable insights for strategic market entry and expansion decisions for both existing and new players. Further regional analysis will reveal specific opportunities and challenges based on diverse consumption patterns and regulatory environments. Understanding these market dynamics is critical for stakeholders to capitalize on the ongoing growth trajectory of the whipping cream industry.
Whipping Cream Industry: A Comprehensive Market Report (2019-2033)
This in-depth report provides a comprehensive analysis of the global whipping cream industry, offering valuable insights for stakeholders across the value chain. The study covers the period 2019-2033, with 2025 as the base and estimated year. The report leverages extensive primary and secondary research to provide a detailed understanding of market dynamics, competitive landscape, and future growth potential. With a focus on key market segments and leading players, this report is an indispensable resource for strategic decision-making. The report uses Million as the unit for all values.
Whipping Cream Industry Market Concentration & Innovation
The global whipping cream market exhibits a moderately concentrated structure, with several multinational players holding significant market share. Key players like Nestle SA, Land O'Lakes Inc., and Dean Foods command substantial portions of the dairy-based segment. However, the emergence of innovative plant-based alternatives from companies such as Califia Farms LLC and Oatly is challenging the traditional dominance. Market share data from the historical period (2019-2024) indicates Nestle SA held approximately xx% market share, while Land O'Lakes Inc. held approximately xx%. The industry is characterized by continuous innovation driven by consumer demand for healthier, more sustainable options. Recent years have witnessed significant M&A activity, with deal values exceeding xx Million in the period 2019-2024. Regulatory frameworks related to food safety and labeling significantly influence market dynamics. The rise of vegan and other non-dairy alternatives presents a compelling substitute impacting market dynamics. End-user trends toward healthier lifestyles and convenience are reshaping the market.
- Key Players: Nestle SA, Land O'Lakes Inc., Dean Foods, Califia Farms LLC, Arla Foods AMBA, The Tatua Co-operative Dairy Company Limited, Conagra Brands Inc, FrieslandCampina, Fonterra Co-operative Group, Gay Lea Foods Co-operative Ltd. (List Not Exhaustive)
- Market Concentration: Moderately Concentrated (xx% market share held by top 5 players in 2024)
- Innovation Drivers: Consumer demand for healthier and more sustainable options, technological advancements in plant-based alternatives.
- M&A Activity: Deal values exceeding xx Million in 2019-2024.
Whipping Cream Industry Industry Trends & Insights
The global whipping cream market is experiencing robust growth, driven by increasing consumer demand for convenient and versatile food products. The CAGR for the historical period (2019-2024) was estimated at xx%, while the forecast period (2025-2033) projects a CAGR of xx%. Market penetration of non-dairy alternatives is rapidly increasing, driven by health consciousness, ethical considerations, and environmental concerns. Technological advancements in plant-based protein and fat alternatives have fueled the growth of the non-dairy segment, with companies continuously seeking more realistic flavor profiles and textures. Competitive dynamics are shaped by price competition, innovation in product offerings, and expansion into new geographic markets. The market is witnessing increased investment in sustainable and ethically sourced ingredients. The impact of economic fluctuations and changing consumer purchasing power remains a critical factor.
Dominant Markets & Segments in Whipping Cream Industry
The North American region currently dominates the global whipping cream market, driven by high per capita consumption and a well-established retail infrastructure. Within this region, the United States exhibits the largest market share, followed by Canada and Mexico.
By Type:
- Dairy-based: This segment remains dominant, accounting for approximately xx% of the market in 2024. Growth is driven by established consumer preferences and the wide availability of dairy products.
- Non-dairy-based: This segment is experiencing the fastest growth, with a CAGR of xx% during the forecast period. Growth is primarily fueled by the increasing adoption of vegan lifestyles and rising awareness of environmental concerns.
By Distribution Channel:
- Supermarkets/Hypermarkets: This channel represents the largest distribution channel, due to the high volume of sales and widespread availability.
- Online Stores: This channel shows strong growth potential, driven by increasing e-commerce penetration and the convenience of online shopping. Growth in this segment is projected at xx% CAGR during the forecast period.
Key Drivers:
- Strong retail infrastructure in North America.
- High per capita consumption in developed countries.
- Increasing demand for convenient food products.
- Rising disposable incomes in emerging markets.
Whipping Cream Industry Product Developments
Recent product developments in the whipping cream market highlight a clear trend towards healthier, more sustainable, and versatile options. The introduction of plant-based alternatives, such as California Farms' heavy whip cream and Oatly's whippable vegan cream, demonstrates the industry's commitment to catering to evolving consumer preferences. These innovations leverage technological advancements in plant-based ingredients to provide functional equivalents to traditional dairy-based whipping cream. This focus on creating dairy-free alternatives that maintain comparable taste and texture is driving significant growth in the non-dairy segment.
Report Scope & Segmentation Analysis
This report segments the whipping cream market by type (dairy-based and non-dairy-based) and by distribution channel (supermarkets/hypermarkets, convenience stores, specialist retailers, online stores, and other distribution channels). Each segment's growth projection, market size (in Million), and competitive dynamics are analyzed in detail. For instance, the dairy-based segment is expected to maintain a significant market share, while the non-dairy segment is anticipated to exhibit high growth due to increasing consumer preference for plant-based alternatives. Similarly, supermarkets and hypermarkets will remain the dominant distribution channel, but online stores are expected to show accelerated growth throughout the forecast period.
Key Drivers of Whipping Cream Industry Growth
The whipping cream industry’s growth is propelled by several factors. Firstly, the increasing demand for convenient and ready-to-use food products fuels market expansion. Secondly, the rising popularity of desserts and bakery items globally significantly impacts consumption. Thirdly, the development of innovative, plant-based alternatives caters to growing health consciousness and veganism. Finally, favorable economic conditions in various regions stimulate spending on food and beverages.
Challenges in the Whipping Cream Industry Sector
The whipping cream industry faces several challenges. Fluctuations in dairy prices and ingredient availability impact profitability. Stringent regulations regarding food safety and labeling increase production costs. Intense competition, particularly from emerging plant-based brands, necessitates continuous innovation. Supply chain disruptions can negatively affect production and distribution, potentially leading to shortages and increased pricing.
Emerging Opportunities in Whipping Cream Industry
The industry presents significant growth opportunities. Expanding into emerging markets with rising disposable incomes presents lucrative potential. Developing functional whipping cream varieties (e.g., those enriched with probiotics or added nutrients) can cater to specific health-conscious consumer segments. Investing in sustainable sourcing practices and reducing the environmental footprint can attract environmentally-conscious consumers.
Leading Players in the Whipping Cream Industry Market
- Land O'Lakes Inc
- Nestle SA
- Dean Foods
- Califia Farms LLC
- Arla Foods AMBA
- The Tatua Co-operative Dairy Company Limited
- Conagra Brands Inc
- FrieslandCampina
- Fonterra Co-operative Group
- Gay Lea Foods Co-operative Ltd
Key Developments in Whipping Cream Industry Industry
- November 2022: California Farms launched a heavy whip cream, a plant-based alternative impacting the market share of dairy-based products.
- January 2021: Oatly launched a "whippable" vegan cream, further intensifying competition and highlighting the growing preference for sustainable alternatives.
Strategic Outlook for Whipping Cream Industry Market
The whipping cream market presents substantial growth potential, driven by escalating demand, innovation in product offerings, and the expansion into new markets. The increasing adoption of plant-based alternatives will continue to reshape the market landscape, presenting opportunities for companies that can successfully cater to this segment. Strategic partnerships and acquisitions will play a crucial role in driving consolidation and expansion within the industry. A focus on sustainability and ethical sourcing will become increasingly important in attracting and retaining customers.
Whipping Cream Industry Segmentation
-
1. Type
- 1.1. Dairy-based
- 1.2. Non-Dairy-based
-
2. Distribution Channel
- 2.1. Supermarkets/Hypermarkets
- 2.2. Convenience Stores
- 2.3. Specialist Retailer
- 2.4. Online Stores
- 2.5. Other Distribution Channels
Whipping Cream Industry Segmentation By Geography
-
1. North America
- 1.1. United States
- 1.2. Canada
- 1.3. Mexico
- 1.4. Rest of North America
-
2. Europe
- 2.1. United Kingdom
- 2.2. Germany
- 2.3. Spain
- 2.4. France
- 2.5. Italy
- 2.6. Russia
- 2.7. Rest of Europe
-
3. Asia Pacific
- 3.1. China
- 3.2. Japan
- 3.3. India
- 3.4. Australia
- 3.5. Rest of Asia Pacific
-
4. South America
- 4.1. Brazil
- 4.2. Argentina
- 4.3. Rest of South America
- 5. Middle East
-
6. United Arab Emirates
- 6.1. South Africa
- 6.2. Rest of Middle East
Whipping Cream Industry REPORT HIGHLIGHTS
| Aspects | Details |
|---|---|
| Study Period | 2019-2033 |
| Base Year | 2024 |
| Estimated Year | 2025 |
| Forecast Period | 2025-2033 |
| Historical Period | 2019-2024 |
| Growth Rate | CAGR of 4.21% from 2019-2033 |
| Segmentation |
|
Table of Contents
- 1. Introduction
- 1.1. Research Scope
- 1.2. Market Segmentation
- 1.3. Research Methodology
- 1.4. Definitions and Assumptions
- 2. Executive Summary
- 2.1. Introduction
- 3. Market Dynamics
- 3.1. Introduction
- 3.2. Market Drivers
- 3.2.1. Rising Demand for Convenient Snacking Options; Increase in Demand for New and Innovative Flavored Meat Snacks
- 3.3. Market Restrains
- 3.3.1. Fluctuations in the Price of Raw Materials
- 3.4. Market Trends
- 3.4.1. Non-dairy based Whipping Cream Fueling Market Demand
- 4. Market Factor Analysis
- 4.1. Porters Five Forces
- 4.2. Supply/Value Chain
- 4.3. PESTEL analysis
- 4.4. Market Entropy
- 4.5. Patent/Trademark Analysis
- 5. Global Whipping Cream Industry Analysis, Insights and Forecast, 2019-2031
- 5.1. Market Analysis, Insights and Forecast - by Type
- 5.1.1. Dairy-based
- 5.1.2. Non-Dairy-based
- 5.2. Market Analysis, Insights and Forecast - by Distribution Channel
- 5.2.1. Supermarkets/Hypermarkets
- 5.2.2. Convenience Stores
- 5.2.3. Specialist Retailer
- 5.2.4. Online Stores
- 5.2.5. Other Distribution Channels
- 5.3. Market Analysis, Insights and Forecast - by Region
- 5.3.1. North America
- 5.3.2. Europe
- 5.3.3. Asia Pacific
- 5.3.4. South America
- 5.3.5. Middle East
- 5.3.6. United Arab Emirates
- 5.1. Market Analysis, Insights and Forecast - by Type
- 6. North America Whipping Cream Industry Analysis, Insights and Forecast, 2019-2031
- 6.1. Market Analysis, Insights and Forecast - by Type
- 6.1.1. Dairy-based
- 6.1.2. Non-Dairy-based
- 6.2. Market Analysis, Insights and Forecast - by Distribution Channel
- 6.2.1. Supermarkets/Hypermarkets
- 6.2.2. Convenience Stores
- 6.2.3. Specialist Retailer
- 6.2.4. Online Stores
- 6.2.5. Other Distribution Channels
- 6.1. Market Analysis, Insights and Forecast - by Type
- 7. Europe Whipping Cream Industry Analysis, Insights and Forecast, 2019-2031
- 7.1. Market Analysis, Insights and Forecast - by Type
- 7.1.1. Dairy-based
- 7.1.2. Non-Dairy-based
- 7.2. Market Analysis, Insights and Forecast - by Distribution Channel
- 7.2.1. Supermarkets/Hypermarkets
- 7.2.2. Convenience Stores
- 7.2.3. Specialist Retailer
- 7.2.4. Online Stores
- 7.2.5. Other Distribution Channels
- 7.1. Market Analysis, Insights and Forecast - by Type
- 8. Asia Pacific Whipping Cream Industry Analysis, Insights and Forecast, 2019-2031
- 8.1. Market Analysis, Insights and Forecast - by Type
- 8.1.1. Dairy-based
- 8.1.2. Non-Dairy-based
- 8.2. Market Analysis, Insights and Forecast - by Distribution Channel
- 8.2.1. Supermarkets/Hypermarkets
- 8.2.2. Convenience Stores
- 8.2.3. Specialist Retailer
- 8.2.4. Online Stores
- 8.2.5. Other Distribution Channels
- 8.1. Market Analysis, Insights and Forecast - by Type
- 9. South America Whipping Cream Industry Analysis, Insights and Forecast, 2019-2031
- 9.1. Market Analysis, Insights and Forecast - by Type
- 9.1.1. Dairy-based
- 9.1.2. Non-Dairy-based
- 9.2. Market Analysis, Insights and Forecast - by Distribution Channel
- 9.2.1. Supermarkets/Hypermarkets
- 9.2.2. Convenience Stores
- 9.2.3. Specialist Retailer
- 9.2.4. Online Stores
- 9.2.5. Other Distribution Channels
- 9.1. Market Analysis, Insights and Forecast - by Type
- 10. Middle East Whipping Cream Industry Analysis, Insights and Forecast, 2019-2031
- 10.1. Market Analysis, Insights and Forecast - by Type
- 10.1.1. Dairy-based
- 10.1.2. Non-Dairy-based
- 10.2. Market Analysis, Insights and Forecast - by Distribution Channel
- 10.2.1. Supermarkets/Hypermarkets
- 10.2.2. Convenience Stores
- 10.2.3. Specialist Retailer
- 10.2.4. Online Stores
- 10.2.5. Other Distribution Channels
- 10.1. Market Analysis, Insights and Forecast - by Type
- 11. United Arab Emirates Whipping Cream Industry Analysis, Insights and Forecast, 2019-2031
- 11.1. Market Analysis, Insights and Forecast - by Type
- 11.1.1. Dairy-based
- 11.1.2. Non-Dairy-based
- 11.2. Market Analysis, Insights and Forecast - by Distribution Channel
- 11.2.1. Supermarkets/Hypermarkets
- 11.2.2. Convenience Stores
- 11.2.3. Specialist Retailer
- 11.2.4. Online Stores
- 11.2.5. Other Distribution Channels
- 11.1. Market Analysis, Insights and Forecast - by Type
- 12. North America Whipping Cream Industry Analysis, Insights and Forecast, 2019-2031
- 12.1. Market Analysis, Insights and Forecast - By Country/Sub-region
- 12.1.1 United States
- 12.1.2 Canada
- 12.1.3 Mexico
- 12.1.4 Rest of North America
- 13. Europe Whipping Cream Industry Analysis, Insights and Forecast, 2019-2031
- 13.1. Market Analysis, Insights and Forecast - By Country/Sub-region
- 13.1.1 United Kingdom
- 13.1.2 Germany
- 13.1.3 Spain
- 13.1.4 France
- 13.1.5 Italy
- 13.1.6 Russia
- 13.1.7 Rest of Europe
- 14. Asia Pacific Whipping Cream Industry Analysis, Insights and Forecast, 2019-2031
- 14.1. Market Analysis, Insights and Forecast - By Country/Sub-region
- 14.1.1 China
- 14.1.2 Japan
- 14.1.3 India
- 14.1.4 Australia
- 14.1.5 Rest of Asia Pacific
- 15. South America Whipping Cream Industry Analysis, Insights and Forecast, 2019-2031
- 15.1. Market Analysis, Insights and Forecast - By Country/Sub-region
- 15.1.1 Brazil
- 15.1.2 Argentina
- 15.1.3 Rest of South America
- 16. Middle East Whipping Cream Industry Analysis, Insights and Forecast, 2019-2031
- 16.1. Market Analysis, Insights and Forecast - By Country/Sub-region
- 16.1.1.
- 17. United Arab Emirates Whipping Cream Industry Analysis, Insights and Forecast, 2019-2031
- 17.1. Market Analysis, Insights and Forecast - By Country/Sub-region
- 17.1.1 South Africa
- 17.1.2 Rest of Middle East
- 18. Competitive Analysis
- 18.1. Global Market Share Analysis 2024
- 18.2. Company Profiles
- 18.2.1 Land O'Lakes Inc
- 18.2.1.1. Overview
- 18.2.1.2. Products
- 18.2.1.3. SWOT Analysis
- 18.2.1.4. Recent Developments
- 18.2.1.5. Financials (Based on Availability)
- 18.2.2 Nestle SA
- 18.2.2.1. Overview
- 18.2.2.2. Products
- 18.2.2.3. SWOT Analysis
- 18.2.2.4. Recent Developments
- 18.2.2.5. Financials (Based on Availability)
- 18.2.3 Dean Foods
- 18.2.3.1. Overview
- 18.2.3.2. Products
- 18.2.3.3. SWOT Analysis
- 18.2.3.4. Recent Developments
- 18.2.3.5. Financials (Based on Availability)
- 18.2.4 Califia Farms LLC
- 18.2.4.1. Overview
- 18.2.4.2. Products
- 18.2.4.3. SWOT Analysis
- 18.2.4.4. Recent Developments
- 18.2.4.5. Financials (Based on Availability)
- 18.2.5 Arla Foods AMBA
- 18.2.5.1. Overview
- 18.2.5.2. Products
- 18.2.5.3. SWOT Analysis
- 18.2.5.4. Recent Developments
- 18.2.5.5. Financials (Based on Availability)
- 18.2.6 The Tatua Co-operative Dairy Company Limited
- 18.2.6.1. Overview
- 18.2.6.2. Products
- 18.2.6.3. SWOT Analysis
- 18.2.6.4. Recent Developments
- 18.2.6.5. Financials (Based on Availability)
- 18.2.7 Conagra Brands Inc
- 18.2.7.1. Overview
- 18.2.7.2. Products
- 18.2.7.3. SWOT Analysis
- 18.2.7.4. Recent Developments
- 18.2.7.5. Financials (Based on Availability)
- 18.2.8 FrieslandCampina*List Not Exhaustive
- 18.2.8.1. Overview
- 18.2.8.2. Products
- 18.2.8.3. SWOT Analysis
- 18.2.8.4. Recent Developments
- 18.2.8.5. Financials (Based on Availability)
- 18.2.9 Fonterra Co-operative Group
- 18.2.9.1. Overview
- 18.2.9.2. Products
- 18.2.9.3. SWOT Analysis
- 18.2.9.4. Recent Developments
- 18.2.9.5. Financials (Based on Availability)
- 18.2.10 Gay Lea Foods Co-operative Ltd
- 18.2.10.1. Overview
- 18.2.10.2. Products
- 18.2.10.3. SWOT Analysis
- 18.2.10.4. Recent Developments
- 18.2.10.5. Financials (Based on Availability)
- 18.2.1 Land O'Lakes Inc
List of Figures
- Figure 1: Global Whipping Cream Industry Revenue Breakdown (Million, %) by Region 2024 & 2032
- Figure 2: North America Whipping Cream Industry Revenue (Million), by Country 2024 & 2032
- Figure 3: North America Whipping Cream Industry Revenue Share (%), by Country 2024 & 2032
- Figure 4: Europe Whipping Cream Industry Revenue (Million), by Country 2024 & 2032
- Figure 5: Europe Whipping Cream Industry Revenue Share (%), by Country 2024 & 2032
- Figure 6: Asia Pacific Whipping Cream Industry Revenue (Million), by Country 2024 & 2032
- Figure 7: Asia Pacific Whipping Cream Industry Revenue Share (%), by Country 2024 & 2032
- Figure 8: South America Whipping Cream Industry Revenue (Million), by Country 2024 & 2032
- Figure 9: South America Whipping Cream Industry Revenue Share (%), by Country 2024 & 2032
- Figure 10: Middle East Whipping Cream Industry Revenue (Million), by Country 2024 & 2032
- Figure 11: Middle East Whipping Cream Industry Revenue Share (%), by Country 2024 & 2032
- Figure 12: United Arab Emirates Whipping Cream Industry Revenue (Million), by Country 2024 & 2032
- Figure 13: United Arab Emirates Whipping Cream Industry Revenue Share (%), by Country 2024 & 2032
- Figure 14: North America Whipping Cream Industry Revenue (Million), by Type 2024 & 2032
- Figure 15: North America Whipping Cream Industry Revenue Share (%), by Type 2024 & 2032
- Figure 16: North America Whipping Cream Industry Revenue (Million), by Distribution Channel 2024 & 2032
- Figure 17: North America Whipping Cream Industry Revenue Share (%), by Distribution Channel 2024 & 2032
- Figure 18: North America Whipping Cream Industry Revenue (Million), by Country 2024 & 2032
- Figure 19: North America Whipping Cream Industry Revenue Share (%), by Country 2024 & 2032
- Figure 20: Europe Whipping Cream Industry Revenue (Million), by Type 2024 & 2032
- Figure 21: Europe Whipping Cream Industry Revenue Share (%), by Type 2024 & 2032
- Figure 22: Europe Whipping Cream Industry Revenue (Million), by Distribution Channel 2024 & 2032
- Figure 23: Europe Whipping Cream Industry Revenue Share (%), by Distribution Channel 2024 & 2032
- Figure 24: Europe Whipping Cream Industry Revenue (Million), by Country 2024 & 2032
- Figure 25: Europe Whipping Cream Industry Revenue Share (%), by Country 2024 & 2032
- Figure 26: Asia Pacific Whipping Cream Industry Revenue (Million), by Type 2024 & 2032
- Figure 27: Asia Pacific Whipping Cream Industry Revenue Share (%), by Type 2024 & 2032
- Figure 28: Asia Pacific Whipping Cream Industry Revenue (Million), by Distribution Channel 2024 & 2032
- Figure 29: Asia Pacific Whipping Cream Industry Revenue Share (%), by Distribution Channel 2024 & 2032
- Figure 30: Asia Pacific Whipping Cream Industry Revenue (Million), by Country 2024 & 2032
- Figure 31: Asia Pacific Whipping Cream Industry Revenue Share (%), by Country 2024 & 2032
- Figure 32: South America Whipping Cream Industry Revenue (Million), by Type 2024 & 2032
- Figure 33: South America Whipping Cream Industry Revenue Share (%), by Type 2024 & 2032
- Figure 34: South America Whipping Cream Industry Revenue (Million), by Distribution Channel 2024 & 2032
- Figure 35: South America Whipping Cream Industry Revenue Share (%), by Distribution Channel 2024 & 2032
- Figure 36: South America Whipping Cream Industry Revenue (Million), by Country 2024 & 2032
- Figure 37: South America Whipping Cream Industry Revenue Share (%), by Country 2024 & 2032
- Figure 38: Middle East Whipping Cream Industry Revenue (Million), by Type 2024 & 2032
- Figure 39: Middle East Whipping Cream Industry Revenue Share (%), by Type 2024 & 2032
- Figure 40: Middle East Whipping Cream Industry Revenue (Million), by Distribution Channel 2024 & 2032
- Figure 41: Middle East Whipping Cream Industry Revenue Share (%), by Distribution Channel 2024 & 2032
- Figure 42: Middle East Whipping Cream Industry Revenue (Million), by Country 2024 & 2032
- Figure 43: Middle East Whipping Cream Industry Revenue Share (%), by Country 2024 & 2032
- Figure 44: United Arab Emirates Whipping Cream Industry Revenue (Million), by Type 2024 & 2032
- Figure 45: United Arab Emirates Whipping Cream Industry Revenue Share (%), by Type 2024 & 2032
- Figure 46: United Arab Emirates Whipping Cream Industry Revenue (Million), by Distribution Channel 2024 & 2032
- Figure 47: United Arab Emirates Whipping Cream Industry Revenue Share (%), by Distribution Channel 2024 & 2032
- Figure 48: United Arab Emirates Whipping Cream Industry Revenue (Million), by Country 2024 & 2032
- Figure 49: United Arab Emirates Whipping Cream Industry Revenue Share (%), by Country 2024 & 2032
List of Tables
- Table 1: Global Whipping Cream Industry Revenue Million Forecast, by Region 2019 & 2032
- Table 2: Global Whipping Cream Industry Revenue Million Forecast, by Type 2019 & 2032
- Table 3: Global Whipping Cream Industry Revenue Million Forecast, by Distribution Channel 2019 & 2032
- Table 4: Global Whipping Cream Industry Revenue Million Forecast, by Region 2019 & 2032
- Table 5: Global Whipping Cream Industry Revenue Million Forecast, by Country 2019 & 2032
- Table 6: United States Whipping Cream Industry Revenue (Million) Forecast, by Application 2019 & 2032
- Table 7: Canada Whipping Cream Industry Revenue (Million) Forecast, by Application 2019 & 2032
- Table 8: Mexico Whipping Cream Industry Revenue (Million) Forecast, by Application 2019 & 2032
- Table 9: Rest of North America Whipping Cream Industry Revenue (Million) Forecast, by Application 2019 & 2032
- Table 10: Global Whipping Cream Industry Revenue Million Forecast, by Country 2019 & 2032
- Table 11: United Kingdom Whipping Cream Industry Revenue (Million) Forecast, by Application 2019 & 2032
- Table 12: Germany Whipping Cream Industry Revenue (Million) Forecast, by Application 2019 & 2032
- Table 13: Spain Whipping Cream Industry Revenue (Million) Forecast, by Application 2019 & 2032
- Table 14: France Whipping Cream Industry Revenue (Million) Forecast, by Application 2019 & 2032
- Table 15: Italy Whipping Cream Industry Revenue (Million) Forecast, by Application 2019 & 2032
- Table 16: Russia Whipping Cream Industry Revenue (Million) Forecast, by Application 2019 & 2032
- Table 17: Rest of Europe Whipping Cream Industry Revenue (Million) Forecast, by Application 2019 & 2032
- Table 18: Global Whipping Cream Industry Revenue Million Forecast, by Country 2019 & 2032
- Table 19: China Whipping Cream Industry Revenue (Million) Forecast, by Application 2019 & 2032
- Table 20: Japan Whipping Cream Industry Revenue (Million) Forecast, by Application 2019 & 2032
- Table 21: India Whipping Cream Industry Revenue (Million) Forecast, by Application 2019 & 2032
- Table 22: Australia Whipping Cream Industry Revenue (Million) Forecast, by Application 2019 & 2032
- Table 23: Rest of Asia Pacific Whipping Cream Industry Revenue (Million) Forecast, by Application 2019 & 2032
- Table 24: Global Whipping Cream Industry Revenue Million Forecast, by Country 2019 & 2032
- Table 25: Brazil Whipping Cream Industry Revenue (Million) Forecast, by Application 2019 & 2032
- Table 26: Argentina Whipping Cream Industry Revenue (Million) Forecast, by Application 2019 & 2032
- Table 27: Rest of South America Whipping Cream Industry Revenue (Million) Forecast, by Application 2019 & 2032
- Table 28: Global Whipping Cream Industry Revenue Million Forecast, by Country 2019 & 2032
- Table 29: Whipping Cream Industry Revenue (Million) Forecast, by Application 2019 & 2032
- Table 30: Global Whipping Cream Industry Revenue Million Forecast, by Country 2019 & 2032
- Table 31: South Africa Whipping Cream Industry Revenue (Million) Forecast, by Application 2019 & 2032
- Table 32: Rest of Middle East Whipping Cream Industry Revenue (Million) Forecast, by Application 2019 & 2032
- Table 33: Global Whipping Cream Industry Revenue Million Forecast, by Type 2019 & 2032
- Table 34: Global Whipping Cream Industry Revenue Million Forecast, by Distribution Channel 2019 & 2032
- Table 35: Global Whipping Cream Industry Revenue Million Forecast, by Country 2019 & 2032
- Table 36: United States Whipping Cream Industry Revenue (Million) Forecast, by Application 2019 & 2032
- Table 37: Canada Whipping Cream Industry Revenue (Million) Forecast, by Application 2019 & 2032
- Table 38: Mexico Whipping Cream Industry Revenue (Million) Forecast, by Application 2019 & 2032
- Table 39: Rest of North America Whipping Cream Industry Revenue (Million) Forecast, by Application 2019 & 2032
- Table 40: Global Whipping Cream Industry Revenue Million Forecast, by Type 2019 & 2032
- Table 41: Global Whipping Cream Industry Revenue Million Forecast, by Distribution Channel 2019 & 2032
- Table 42: Global Whipping Cream Industry Revenue Million Forecast, by Country 2019 & 2032
- Table 43: United Kingdom Whipping Cream Industry Revenue (Million) Forecast, by Application 2019 & 2032
- Table 44: Germany Whipping Cream Industry Revenue (Million) Forecast, by Application 2019 & 2032
- Table 45: Spain Whipping Cream Industry Revenue (Million) Forecast, by Application 2019 & 2032
- Table 46: France Whipping Cream Industry Revenue (Million) Forecast, by Application 2019 & 2032
- Table 47: Italy Whipping Cream Industry Revenue (Million) Forecast, by Application 2019 & 2032
- Table 48: Russia Whipping Cream Industry Revenue (Million) Forecast, by Application 2019 & 2032
- Table 49: Rest of Europe Whipping Cream Industry Revenue (Million) Forecast, by Application 2019 & 2032
- Table 50: Global Whipping Cream Industry Revenue Million Forecast, by Type 2019 & 2032
- Table 51: Global Whipping Cream Industry Revenue Million Forecast, by Distribution Channel 2019 & 2032
- Table 52: Global Whipping Cream Industry Revenue Million Forecast, by Country 2019 & 2032
- Table 53: China Whipping Cream Industry Revenue (Million) Forecast, by Application 2019 & 2032
- Table 54: Japan Whipping Cream Industry Revenue (Million) Forecast, by Application 2019 & 2032
- Table 55: India Whipping Cream Industry Revenue (Million) Forecast, by Application 2019 & 2032
- Table 56: Australia Whipping Cream Industry Revenue (Million) Forecast, by Application 2019 & 2032
- Table 57: Rest of Asia Pacific Whipping Cream Industry Revenue (Million) Forecast, by Application 2019 & 2032
- Table 58: Global Whipping Cream Industry Revenue Million Forecast, by Type 2019 & 2032
- Table 59: Global Whipping Cream Industry Revenue Million Forecast, by Distribution Channel 2019 & 2032
- Table 60: Global Whipping Cream Industry Revenue Million Forecast, by Country 2019 & 2032
- Table 61: Brazil Whipping Cream Industry Revenue (Million) Forecast, by Application 2019 & 2032
- Table 62: Argentina Whipping Cream Industry Revenue (Million) Forecast, by Application 2019 & 2032
- Table 63: Rest of South America Whipping Cream Industry Revenue (Million) Forecast, by Application 2019 & 2032
- Table 64: Global Whipping Cream Industry Revenue Million Forecast, by Type 2019 & 2032
- Table 65: Global Whipping Cream Industry Revenue Million Forecast, by Distribution Channel 2019 & 2032
- Table 66: Global Whipping Cream Industry Revenue Million Forecast, by Country 2019 & 2032
- Table 67: Global Whipping Cream Industry Revenue Million Forecast, by Type 2019 & 2032
- Table 68: Global Whipping Cream Industry Revenue Million Forecast, by Distribution Channel 2019 & 2032
- Table 69: Global Whipping Cream Industry Revenue Million Forecast, by Country 2019 & 2032
- Table 70: South Africa Whipping Cream Industry Revenue (Million) Forecast, by Application 2019 & 2032
- Table 71: Rest of Middle East Whipping Cream Industry Revenue (Million) Forecast, by Application 2019 & 2032
Frequently Asked Questions
1. What is the projected Compound Annual Growth Rate (CAGR) of the Whipping Cream Industry?
The projected CAGR is approximately 4.21%.
2. Which companies are prominent players in the Whipping Cream Industry?
Key companies in the market include Land O'Lakes Inc, Nestle SA, Dean Foods, Califia Farms LLC, Arla Foods AMBA, The Tatua Co-operative Dairy Company Limited, Conagra Brands Inc, FrieslandCampina*List Not Exhaustive, Fonterra Co-operative Group, Gay Lea Foods Co-operative Ltd.
3. What are the main segments of the Whipping Cream Industry?
The market segments include Type, Distribution Channel.
4. Can you provide details about the market size?
The market size is estimated to be USD XX Million as of 2022.
5. What are some drivers contributing to market growth?
Rising Demand for Convenient Snacking Options; Increase in Demand for New and Innovative Flavored Meat Snacks.
6. What are the notable trends driving market growth?
Non-dairy based Whipping Cream Fueling Market Demand.
7. Are there any restraints impacting market growth?
Fluctuations in the Price of Raw Materials.
8. Can you provide examples of recent developments in the market?
November 2022: California Farms launched a heavy whip cream. It is a plant-based substitute for heavy whipping cream, which is used for whipping, cooking, and baking. The product is claimed to be unflavored and unsweetened and made from coconut oil and plant-based and dairy-free ingredients. It is also gluten-free, non-GMO certified, vegan, and kosher.
9. What pricing options are available for accessing the report?
Pricing options include single-user, multi-user, and enterprise licenses priced at USD 4750, USD 5250, and USD 8750 respectively.
10. Is the market size provided in terms of value or volume?
The market size is provided in terms of value, measured in Million.
11. Are there any specific market keywords associated with the report?
Yes, the market keyword associated with the report is "Whipping Cream Industry," which aids in identifying and referencing the specific market segment covered.
12. How do I determine which pricing option suits my needs best?
The pricing options vary based on user requirements and access needs. Individual users may opt for single-user licenses, while businesses requiring broader access may choose multi-user or enterprise licenses for cost-effective access to the report.
13. Are there any additional resources or data provided in the Whipping Cream Industry report?
While the report offers comprehensive insights, it's advisable to review the specific contents or supplementary materials provided to ascertain if additional resources or data are available.
14. How can I stay updated on further developments or reports in the Whipping Cream Industry?
To stay informed about further developments, trends, and reports in the Whipping Cream Industry, consider subscribing to industry newsletters, following relevant companies and organizations, or regularly checking reputable industry news sources and publications.
Methodology
Step 1 - Identification of Relevant Samples Size from Population Database


Step 2 - Approaches for Defining Global Market Size (Value, Volume* & Price*)

Note*: In applicable scenarios
Step 3 - Data Sources
Primary Research
- Web Analytics
- Survey Reports
- Research Institute
- Latest Research Reports
- Opinion Leaders
Secondary Research
- Annual Reports
- White Paper
- Latest Press Release
- Industry Association
- Paid Database
- Investor Presentations

Step 4 - Data Triangulation
Involves using different sources of information in order to increase the validity of a study
These sources are likely to be stakeholders in a program - participants, other researchers, program staff, other community members, and so on.
Then we put all data in single framework & apply various statistical tools to find out the dynamic on the market.
During the analysis stage, feedback from the stakeholder groups would be compared to determine areas of agreement as well as areas of divergence


