

Key Insights
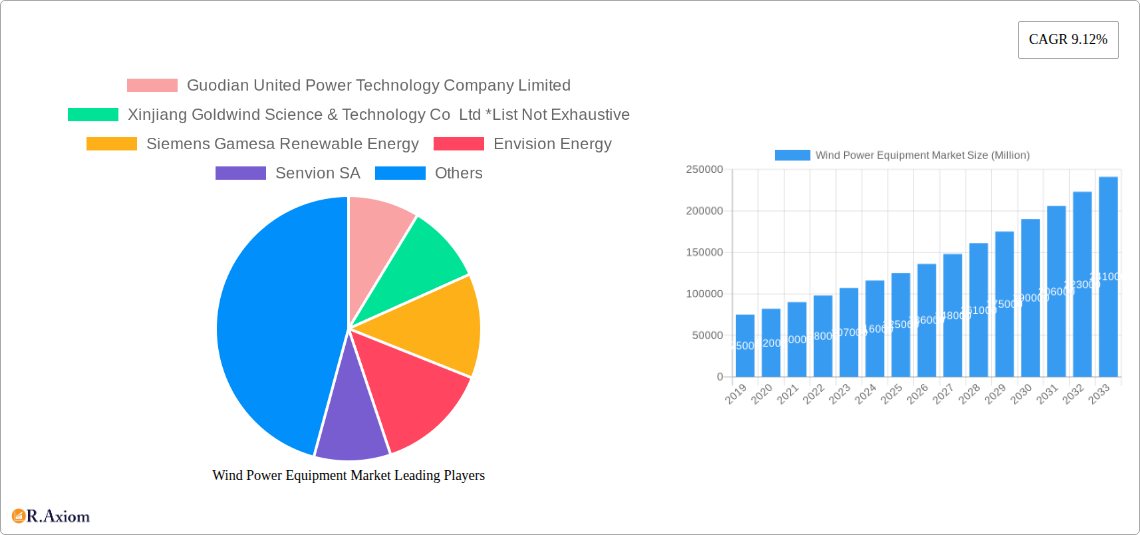
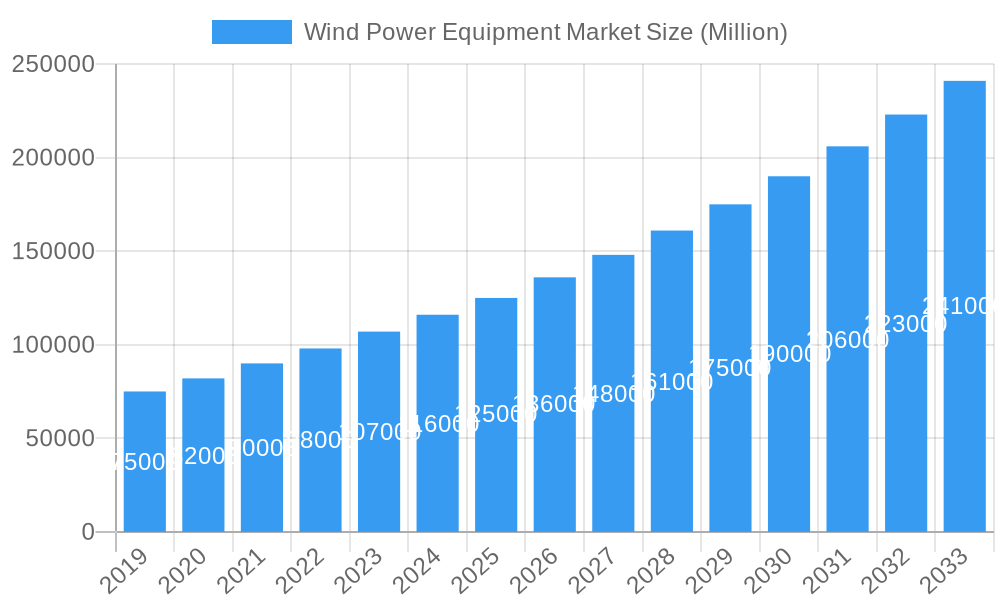
The global Wind Power Equipment Market is poised for substantial growth, projected to reach a market size of approximately USD 120 billion by 2025, expanding at a robust Compound Annual Growth Rate (CAGR) of 9.12% through 2033. This impressive trajectory is fueled by a confluence of powerful drivers, primarily the increasing global demand for clean and renewable energy sources to combat climate change and reduce reliance on fossil fuels. Supportive government policies, including tax incentives, subsidies, and renewable energy mandates, are further accelerating market expansion. Technological advancements in turbine efficiency, larger rotor diameters, and improved energy storage solutions are also playing a crucial role in driving adoption and lowering the levelized cost of electricity from wind. The ongoing expansion of both onshore and offshore wind farms, coupled with significant investments in grid infrastructure to accommodate renewable energy, underpins this optimistic outlook.
Wind Power Equipment Market Market Size (In Billion)
Key trends shaping the Wind Power Equipment Market include the burgeoning offshore wind sector, which offers vast untapped potential and larger turbine installations. There's also a discernible trend towards the development of taller towers and more advanced rotor designs to capture stronger winds at higher altitudes. The market is witnessing a growing emphasis on digitalization and predictive maintenance for wind turbines, leveraging IoT and AI to optimize performance and minimize downtime. However, certain restraints may temper this growth, such as the high initial capital investment required for wind farm development and the intermittent nature of wind power, necessitating robust energy storage solutions. Supply chain complexities and the need for skilled labor to install and maintain these sophisticated systems also present challenges. Geographically, the Asia Pacific region, particularly China, is expected to lead in terms of market share and growth, driven by ambitious renewable energy targets and significant manufacturing capabilities.
Wind Power Equipment Market Company Market Share
This in-depth report provides a detailed analysis of the global Wind Power Equipment Market, covering market size, trends, drivers, challenges, and key players from 2019 to 2033. With a base year of 2025 and a forecast period extending to 2033, this report offers actionable insights for stakeholders seeking to capitalize on the rapidly expanding renewable energy sector. We cover critical segments including onshore and offshore wind power generation, and analyze key equipment types such as rotor/blades, towers, generators, and other essential components. High-traffic keywords such as "wind turbine manufacturers," "renewable energy equipment," "offshore wind market," "onshore wind solutions," and "wind energy technology" are integrated to ensure maximum search visibility.
Wind Power Equipment Market Market Concentration & Innovation
The Wind Power Equipment Market exhibits a moderate to high level of concentration, driven by significant capital investments, complex manufacturing processes, and stringent regulatory requirements. Leading companies like Vestas Wind Systems AS, Siemens Gamesa Renewable Energy, and General Electric Company command substantial market share, estimated to be over 70% collectively in certain segments. Innovation is a primary catalyst for growth, with continuous advancements in turbine efficiency, blade design, and grid integration technologies. Research and development expenditure is substantial, focusing on increasing power output, reducing operational costs, and enhancing the reliability of wind energy systems. Regulatory frameworks play a crucial role, with government incentives, renewable energy mandates, and environmental policies shaping market dynamics and encouraging technological adoption. Product substitutes, while present in the broader energy landscape, are increasingly outcompeted by the declining levelized cost of energy (LCOE) from wind power. End-user trends indicate a strong preference for cleaner, sustainable energy sources, driven by corporate sustainability goals and growing public awareness. Mergers and acquisitions (M&A) activities are strategic plays for market consolidation and technology integration. For instance, the value of M&A deals in the renewable energy equipment sector has been in the billions of dollars annually, facilitating market expansion and competitive advantage.
Wind Power Equipment Market Industry Trends & Insights
The global Wind Power Equipment Market is poised for robust growth, projected to achieve a Compound Annual Growth Rate (CAGR) of approximately 7.5% over the forecast period. This expansion is fueled by a confluence of factors, including escalating global energy demand, a concerted push towards decarbonization by governments worldwide, and significant advancements in wind energy technology. The increasing competitiveness of wind power against fossil fuels, driven by reduced manufacturing costs and improved operational efficiencies, is a key market penetration driver. Technological disruptions are revolutionizing the sector, with the development of larger, more powerful wind turbines capable of generating higher energy yields. Innovations in materials science are leading to lighter and more durable rotor blades, while advancements in digital technologies, such as AI and IoT, are optimizing turbine performance, predictive maintenance, and grid integration. Consumer preferences are increasingly skewed towards renewable energy solutions, driven by environmental consciousness and the desire for energy independence. Businesses are actively investing in renewable energy to meet their sustainability targets, further stimulating demand for wind power equipment. The competitive landscape is dynamic, characterized by intense rivalry among established global players and the emergence of new entrants, particularly from Asia. This competition fosters innovation and drives down costs, making wind energy more accessible. The market penetration of wind power is steadily increasing, becoming a cornerstone of diversified energy portfolios.
Dominant Markets & Segments in Wind Power Equipment Market
The Onshore segment currently dominates the Wind Power Equipment Market, accounting for an estimated 80% of the global installed capacity. This dominance is driven by several key factors, including established infrastructure, lower installation costs compared to offshore projects, and supportive government policies in key regions. Economic policies such as production tax credits (PTCs) and investment tax credits (ITCs) in countries like the United States and favorable feed-in tariffs in Europe have significantly propelled onshore wind development.
Leading Regions & Countries:
- Asia Pacific: China stands as the undisputed leader in both manufacturing and installation of wind power equipment, driven by ambitious renewable energy targets and substantial government subsidies. The country's massive manufacturing base provides a significant cost advantage.
- Europe: Countries like Germany, Spain, and the UK have been pioneers in wind energy development, with strong policy support and a mature market for both onshore and offshore wind.
- North America: The United States, with its vast land resources and significant wind potential, represents a major market for onshore wind installations, heavily influenced by federal and state-level incentives.
Dominant Equipment Type: Rotor/Blade and Tower
- Rotor/Blade: The rotor and blade segment represents a significant portion of the wind turbine cost and is crucial for energy capture. Continuous innovation in blade design, materials (e.g., carbon fiber composites), and length is a key driver of increased efficiency and power output. The demand for larger blades to capture more wind is a constant trend.
- Tower: Tower construction, especially for larger turbines, requires robust engineering and logistics. Hybrid lattice tubular (HLT) towers, as seen in recent Suzlon orders, offer advantages in terms of transportation and installation in challenging terrains. The increasing height of turbines necessitates taller and stronger towers, driving demand for advanced materials and construction techniques.
The Offshore segment, while smaller in current market share, is projected to witness the fastest growth, driven by its potential for higher capacity factors and the availability of strong, consistent winds. The development of offshore wind farms in deeper waters and further from shore is becoming increasingly feasible due to technological advancements in turbine design and installation methods.
Wind Power Equipment Market Product Developments
Recent product developments in the Wind Power Equipment Market are characterized by a relentless pursuit of higher efficiency, improved reliability, and reduced cost of energy. Innovations in blade aerodynamics, materials science (such as advanced composites and recycling initiatives), and nacelle technology are central to these advancements. The trend towards larger capacity wind turbines, with individual units exceeding 10 MW for offshore applications and 4-6 MW for onshore, is a significant development. These larger turbines offer economies of scale, reducing the number of units required for a given capacity and thereby lowering installation and maintenance costs. Furthermore, advancements in digital technologies, including AI-powered control systems and predictive maintenance algorithms, are enhancing operational efficiency and minimizing downtime. The competitive advantage for manufacturers lies in their ability to deliver robust, scalable, and cost-effective solutions that meet evolving grid integration requirements and environmental standards.
Report Scope & Segmentation Analysis
This report comprehensively segments the Wind Power Equipment Market by Location and Equipment Type. The Location segmentation includes:
- Onshore: This segment focuses on wind turbines installed on land. It currently holds the largest market share due to established infrastructure and lower costs, with robust growth projected due to ongoing government support and technological improvements.
- Offshore: This segment pertains to wind turbines installed in bodies of water. It is anticipated to exhibit the highest growth rate owing to its potential for higher energy yields and government-driven initiatives for marine renewable energy deployment.
The Equipment Type segmentation encompasses:
- Rotor/Blade: This vital component captures wind energy and is a key area of innovation for increasing turbine efficiency.
- Tower: Essential for elevating the rotor to higher wind speeds, tower technology is evolving to support larger and heavier turbines.
- Generator: The generator converts mechanical energy into electrical energy, with advancements focused on efficiency and reliability.
- Other Equipment Types: This includes a range of components such as gearboxes, converters, control systems, and foundations, all crucial for the overall functionality and performance of wind power systems.
Key Drivers of Wind Power Equipment Market Growth
The Wind Power Equipment Market is propelled by several interconnected drivers:
- Global Decarbonization Initiatives: Ambitious climate targets set by governments worldwide are mandating a significant shift towards renewable energy sources, with wind power being a primary beneficiary.
- Technological Advancements: Continuous innovation in turbine design, materials, and digital technologies is enhancing efficiency, reducing costs, and improving the reliability of wind energy systems, making them increasingly competitive.
- Declining Levelized Cost of Energy (LCOE): Improvements in manufacturing, installation, and operational efficiency have led to a substantial decrease in the LCOE for wind power, making it an economically attractive alternative to fossil fuels.
- Energy Security Concerns: Countries are increasingly looking to diversify their energy portfolios and reduce reliance on imported fossil fuels, making wind power a strategic choice for enhanced energy security.
- Corporate Sustainability Goals: A growing number of corporations are committing to sourcing a significant portion of their energy from renewable sources, driving demand for wind power projects and associated equipment.
Challenges in the Wind Power Equipment Market Sector
Despite its strong growth trajectory, the Wind Power Equipment Market faces several challenges:
- Grid Integration and Infrastructure Limitations: The intermittent nature of wind power requires substantial investment in grid modernization, energy storage solutions, and transmission infrastructure to ensure stable supply and accommodate large-scale wind integration.
- Permitting and Siting Issues: Obtaining permits for wind farm development can be a lengthy and complex process, often facing local opposition, environmental concerns, and land-use restrictions, particularly for onshore projects.
- Supply Chain Volatility and Material Costs: Fluctuations in the prices of raw materials such as steel, copper, and rare earth elements, coupled with global supply chain disruptions, can impact manufacturing costs and project timelines.
- Competition and Price Pressures: Intense competition among global manufacturers leads to significant price pressures, requiring continuous efforts to optimize production costs and maintain profitability.
- Skilled Workforce Shortages: The growing demand for wind energy projects necessitates a skilled workforce for manufacturing, installation, operation, and maintenance, creating potential for labor shortages.
Emerging Opportunities in Wind Power Equipment Market
The Wind Power Equipment Market is ripe with emerging opportunities:
- Offshore Wind Expansion: The immense untapped potential of offshore wind resources, particularly in deep-water and floating offshore wind applications, presents a significant growth frontier.
- Repowering and Modernization: The aging fleet of existing wind turbines offers a substantial opportunity for repowering, where older turbines are replaced with newer, more efficient models, boosting overall energy output.
- Hybrid Energy Solutions: The integration of wind power with other renewable energy sources, such as solar and battery storage, is creating opportunities for hybrid energy systems that offer greater reliability and grid stability.
- Emerging Markets: Developing economies in Asia, Africa, and Latin America are increasingly investing in renewable energy, presenting untapped markets for wind power equipment manufacturers.
- Technological Innovations: Continued advancements in areas like artificial intelligence for turbine optimization, advanced blade recycling, and grid-forming inverters are creating new product and service opportunities.
Leading Players in the Wind Power Equipment Market Market
- Guodian United Power Technology Company Limited
- Xinjiang Goldwind Science & Technology Co Ltd
- Siemens Gamesa Renewable Energy
- Envision Energy
- Senvion SA
- Vestas Wind Systems AS
- General Electric Company
- Enercon GmbH
- Ming Yang Wind Power Group Limited
- Nordex SE
Key Developments in Wind Power Equipment Market Industry
- May 2023: Suzlon, a developer of renewable energy solutions, has received a 69 MW wind energy order from the Indian division of a renowned Nordic Energy Company. Suzlon will deploy 23 wind turbine generators (WTGs) with 3 MW rated capacity and a Hybrid Lattice Tubular (HLT) tower. This highlights the continued demand for mid-sized onshore turbines and innovative tower solutions in the Indian market.
- October 2022: Suzlon Group secured a new order to develop 144.9 MW wind power projects located at Gujarat and Madhya Pradesh sites for the Aditya Birla Group. As a part of the contract, the company will install around 69 units of wind turbine generators (Wind Turbines) with a Hybrid Lattice Tubular (HLT) tower with a rated capacity of 2.1 MW each. It is expected to commence operations by the end of 2023. This development underscores the ongoing expansion of wind energy in India and the utility of HLT towers for efficient project deployment.
- January 2022: The Blue Circle and its partner CleanTech Global Renewables Inc. signed a contract to construct an offshore wind project in the Philippines with a capacity of 1.2 GW located in Bulalacao, Oriental Mindoro. The wind farm will feature 100 turbines with a unit capacity of 12 MW. This signifies a major step forward in the development of large-scale offshore wind projects in Southeast Asia, indicating growing investment in higher-capacity offshore turbines and the region's potential.
Strategic Outlook for Wind Power Equipment Market Market
The strategic outlook for the Wind Power Equipment Market remains exceptionally strong, driven by a global imperative to transition towards sustainable energy sources. Future market potential is anchored in the continuous expansion of both onshore and offshore wind installations, fueled by supportive government policies and corporate climate commitments. Key growth catalysts include the development of next-generation wind turbines with higher capacity factors and increased efficiency, alongside advancements in energy storage and grid integration technologies that will mitigate intermittency challenges. The emergence of floating offshore wind technology is set to unlock vast new wind resources in deeper waters, significantly expanding the addressable market. Furthermore, the increasing focus on circular economy principles within the wind industry, including blade recycling and sustainable material sourcing, presents opportunities for innovation and competitive differentiation. Emerging markets are expected to play an increasingly significant role, offering substantial growth prospects for manufacturers who can adapt to local conditions and regulatory landscapes. The ongoing digitalization of the energy sector will also drive demand for smart wind turbines and integrated energy management solutions.
Wind Power Equipment Market Segmentation
-
1. Location
- 1.1. Onshore
- 1.2. Offshore
-
2. Equipment Type
- 2.1. Rotor/Blade
- 2.2. Tower
- 2.3. Generator
- 2.4. Other Equipment Types
Wind Power Equipment Market Segmentation By Geography
-
1. North America
- 1.1. United States of America
- 1.2. Canada
- 1.3. Rest of the North America
-
2. Europe
- 2.1. United Kingdom
- 2.2. France
- 2.3. Norway
- 2.4. Italy
- 2.5. Germany
- 2.6. Rest of the Europe
-
3. Asia Pacific
- 3.1. China
- 3.2. India
- 3.3. Japan
- 3.4. Rest of the Asia Pacific
-
4. Middle East and Africa
- 4.1. United Arab Emirates
- 4.2. Saudi Arabia
- 4.3. South Africa
- 4.4. Rest of the Middle East and Africa
-
5. South America
- 5.1. Brazil
- 5.2. Argentina
- 5.3. Rest of the South America
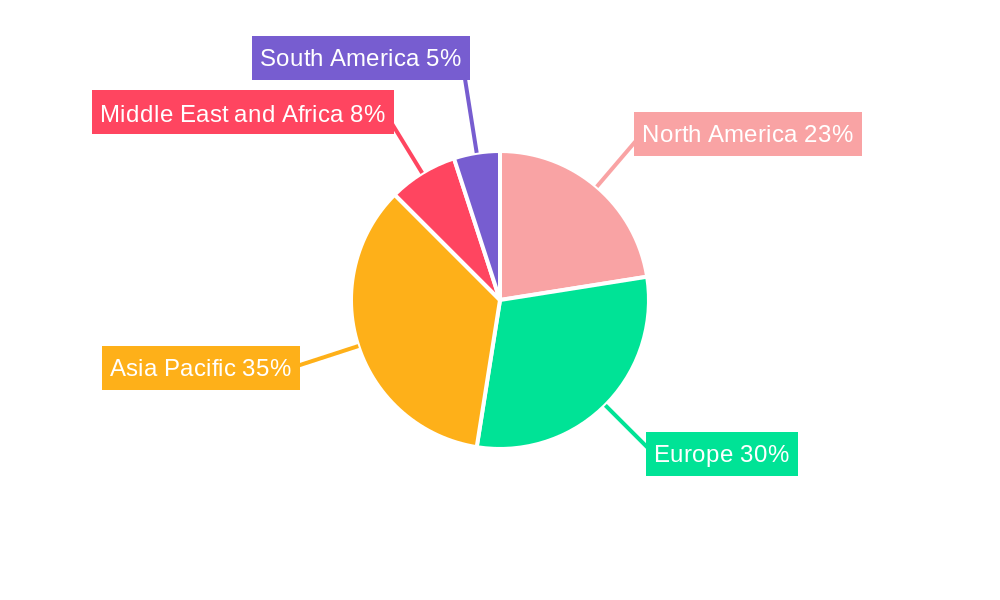
Wind Power Equipment Market Regional Market Share
Geographic Coverage of Wind Power Equipment Market
Wind Power Equipment Market REPORT HIGHLIGHTS
| Aspects | Details |
|---|---|
| Study Period | 2020-2034 |
| Base Year | 2025 |
| Estimated Year | 2026 |
| Forecast Period | 2026-2034 |
| Historical Period | 2020-2025 |
| Growth Rate | CAGR of 5.7% from 2020-2034 |
| Segmentation |
|
Table of Contents
- 1. Introduction
- 1.1. Research Scope
- 1.2. Market Segmentation
- 1.3. Research Objective
- 1.4. Definitions and Assumptions
- 2. Executive Summary
- 2.1. Market Snapshot
- 3. Market Dynamics
- 3.1. Market Drivers
- 3.2. Market Restrains
- 3.3. Market Trends
- 3.4. Market Opportunities
- 4. Market Factor Analysis
- 4.1. Porters Five Forces
- 4.1.1. Bargaining Power of Suppliers
- 4.1.2. Bargaining Power of Buyers
- 4.1.3. Threat of New Entrants
- 4.1.4. Threat of Substitutes
- 4.1.5. Competitive Rivalry
- 4.2. PESTEL analysis
- 4.3. BCG Analysis
- 4.3.1. Stars (High Growth, High Market Share)
- 4.3.2. Cash Cows (Low Growth, High Market Share)
- 4.3.3. Question Mark (High Growth, Low Market Share)
- 4.3.4. Dogs (Low Growth, Low Market Share)
- 4.4. Ansoff Matrix Analysis
- 4.5. Supply Chain Analysis
- 4.6. Regulatory Landscape
- 4.7. Current Market Potential and Opportunity Assessment (TAM–SAM–SOM Framework)
- 4.8. RAX Analyst Note
- 4.1. Porters Five Forces
- 5. Market Analysis, Insights and Forecast 2021-2033
- 5.1. Market Analysis, Insights and Forecast - by Location
- 5.1.1. Onshore
- 5.1.2. Offshore
- 5.2. Market Analysis, Insights and Forecast - by Equipment Type
- 5.2.1. Rotor/Blade
- 5.2.2. Tower
- 5.2.3. Generator
- 5.2.4. Other Equipment Types
- 5.3. Market Analysis, Insights and Forecast - by Region
- 5.3.1. North America
- 5.3.2. Europe
- 5.3.3. Asia Pacific
- 5.3.4. Middle East and Africa
- 5.3.5. South America
- 5.1. Market Analysis, Insights and Forecast - by Location
- 6. Global Wind Power Equipment Market Analysis, Insights and Forecast, 2021-2033
- 6.1. Market Analysis, Insights and Forecast - by Location
- 6.1.1. Onshore
- 6.1.2. Offshore
- 6.2. Market Analysis, Insights and Forecast - by Equipment Type
- 6.2.1. Rotor/Blade
- 6.2.2. Tower
- 6.2.3. Generator
- 6.2.4. Other Equipment Types
- 6.1. Market Analysis, Insights and Forecast - by Location
- 7. North America Wind Power Equipment Market Analysis, Insights and Forecast, 2020-2032
- 7.1. Market Analysis, Insights and Forecast - by Location
- 7.1.1. Onshore
- 7.1.2. Offshore
- 7.2. Market Analysis, Insights and Forecast - by Equipment Type
- 7.2.1. Rotor/Blade
- 7.2.2. Tower
- 7.2.3. Generator
- 7.2.4. Other Equipment Types
- 7.1. Market Analysis, Insights and Forecast - by Location
- 8. Europe Wind Power Equipment Market Analysis, Insights and Forecast, 2020-2032
- 8.1. Market Analysis, Insights and Forecast - by Location
- 8.1.1. Onshore
- 8.1.2. Offshore
- 8.2. Market Analysis, Insights and Forecast - by Equipment Type
- 8.2.1. Rotor/Blade
- 8.2.2. Tower
- 8.2.3. Generator
- 8.2.4. Other Equipment Types
- 8.1. Market Analysis, Insights and Forecast - by Location
- 9. Asia Pacific Wind Power Equipment Market Analysis, Insights and Forecast, 2020-2032
- 9.1. Market Analysis, Insights and Forecast - by Location
- 9.1.1. Onshore
- 9.1.2. Offshore
- 9.2. Market Analysis, Insights and Forecast - by Equipment Type
- 9.2.1. Rotor/Blade
- 9.2.2. Tower
- 9.2.3. Generator
- 9.2.4. Other Equipment Types
- 9.1. Market Analysis, Insights and Forecast - by Location
- 10. Middle East and Africa Wind Power Equipment Market Analysis, Insights and Forecast, 2020-2032
- 10.1. Market Analysis, Insights and Forecast - by Location
- 10.1.1. Onshore
- 10.1.2. Offshore
- 10.2. Market Analysis, Insights and Forecast - by Equipment Type
- 10.2.1. Rotor/Blade
- 10.2.2. Tower
- 10.2.3. Generator
- 10.2.4. Other Equipment Types
- 10.1. Market Analysis, Insights and Forecast - by Location
- 11. South America Wind Power Equipment Market Analysis, Insights and Forecast, 2020-2032
- 11.1. Market Analysis, Insights and Forecast - by Location
- 11.1.1. Onshore
- 11.1.2. Offshore
- 11.2. Market Analysis, Insights and Forecast - by Equipment Type
- 11.2.1. Rotor/Blade
- 11.2.2. Tower
- 11.2.3. Generator
- 11.2.4. Other Equipment Types
- 11.1. Market Analysis, Insights and Forecast - by Location
- 12. Competitive Analysis
- 12.1. Company Profiles
- 12.1.1 Guodian United Power Technology Company Limited
- 12.1.1.1. Company Overview
- 12.1.1.2. Products
- 12.1.1.3. Company Financials
- 12.1.1.4. SWOT Analysis
- 12.1.2 Xinjiang Goldwind Science & Technology Co Ltd *List Not Exhaustive
- 12.1.2.1. Company Overview
- 12.1.2.2. Products
- 12.1.2.3. Company Financials
- 12.1.2.4. SWOT Analysis
- 12.1.3 Siemens Gamesa Renewable Energy
- 12.1.3.1. Company Overview
- 12.1.3.2. Products
- 12.1.3.3. Company Financials
- 12.1.3.4. SWOT Analysis
- 12.1.4 Envision Energy
- 12.1.4.1. Company Overview
- 12.1.4.2. Products
- 12.1.4.3. Company Financials
- 12.1.4.4. SWOT Analysis
- 12.1.5 Senvion SA
- 12.1.5.1. Company Overview
- 12.1.5.2. Products
- 12.1.5.3. Company Financials
- 12.1.5.4. SWOT Analysis
- 12.1.6 Vestas Wind Systems AS
- 12.1.6.1. Company Overview
- 12.1.6.2. Products
- 12.1.6.3. Company Financials
- 12.1.6.4. SWOT Analysis
- 12.1.7 General Electric Company
- 12.1.7.1. Company Overview
- 12.1.7.2. Products
- 12.1.7.3. Company Financials
- 12.1.7.4. SWOT Analysis
- 12.1.8 Enercon GmbH
- 12.1.8.1. Company Overview
- 12.1.8.2. Products
- 12.1.8.3. Company Financials
- 12.1.8.4. SWOT Analysis
- 12.1.9 Ming Yang Wind Power Group Limited
- 12.1.9.1. Company Overview
- 12.1.9.2. Products
- 12.1.9.3. Company Financials
- 12.1.9.4. SWOT Analysis
- 12.1.10 Nordex SE
- 12.1.10.1. Company Overview
- 12.1.10.2. Products
- 12.1.10.3. Company Financials
- 12.1.10.4. SWOT Analysis
- 12.1.1 Guodian United Power Technology Company Limited
- 12.2. Market Entropy
- 12.2.1 Company's Key Areas Served
- 12.2.2 Recent Developments
- 12.3. Company Market Share Analysis 2025
- 12.3.1 Top 5 Companies Market Share Analysis
- 12.3.2 Top 3 Companies Market Share Analysis
- 12.4. List of Potential Customers
- 13. Research Methodology
List of Figures
- Figure 1: Global Wind Power Equipment Market Revenue Breakdown (billion, %) by Region 2025 & 2033
- Figure 2: Global Wind Power Equipment Market Volume Breakdown (K Units, %) by Region 2025 & 2033
- Figure 3: North America Wind Power Equipment Market Revenue (billion), by Location 2025 & 2033
- Figure 4: North America Wind Power Equipment Market Volume (K Units), by Location 2025 & 2033
- Figure 5: North America Wind Power Equipment Market Revenue Share (%), by Location 2025 & 2033
- Figure 6: North America Wind Power Equipment Market Volume Share (%), by Location 2025 & 2033
- Figure 7: North America Wind Power Equipment Market Revenue (billion), by Equipment Type 2025 & 2033
- Figure 8: North America Wind Power Equipment Market Volume (K Units), by Equipment Type 2025 & 2033
- Figure 9: North America Wind Power Equipment Market Revenue Share (%), by Equipment Type 2025 & 2033
- Figure 10: North America Wind Power Equipment Market Volume Share (%), by Equipment Type 2025 & 2033
- Figure 11: North America Wind Power Equipment Market Revenue (billion), by Country 2025 & 2033
- Figure 12: North America Wind Power Equipment Market Volume (K Units), by Country 2025 & 2033
- Figure 13: North America Wind Power Equipment Market Revenue Share (%), by Country 2025 & 2033
- Figure 14: North America Wind Power Equipment Market Volume Share (%), by Country 2025 & 2033
- Figure 15: Europe Wind Power Equipment Market Revenue (billion), by Location 2025 & 2033
- Figure 16: Europe Wind Power Equipment Market Volume (K Units), by Location 2025 & 2033
- Figure 17: Europe Wind Power Equipment Market Revenue Share (%), by Location 2025 & 2033
- Figure 18: Europe Wind Power Equipment Market Volume Share (%), by Location 2025 & 2033
- Figure 19: Europe Wind Power Equipment Market Revenue (billion), by Equipment Type 2025 & 2033
- Figure 20: Europe Wind Power Equipment Market Volume (K Units), by Equipment Type 2025 & 2033
- Figure 21: Europe Wind Power Equipment Market Revenue Share (%), by Equipment Type 2025 & 2033
- Figure 22: Europe Wind Power Equipment Market Volume Share (%), by Equipment Type 2025 & 2033
- Figure 23: Europe Wind Power Equipment Market Revenue (billion), by Country 2025 & 2033
- Figure 24: Europe Wind Power Equipment Market Volume (K Units), by Country 2025 & 2033
- Figure 25: Europe Wind Power Equipment Market Revenue Share (%), by Country 2025 & 2033
- Figure 26: Europe Wind Power Equipment Market Volume Share (%), by Country 2025 & 2033
- Figure 27: Asia Pacific Wind Power Equipment Market Revenue (billion), by Location 2025 & 2033
- Figure 28: Asia Pacific Wind Power Equipment Market Volume (K Units), by Location 2025 & 2033
- Figure 29: Asia Pacific Wind Power Equipment Market Revenue Share (%), by Location 2025 & 2033
- Figure 30: Asia Pacific Wind Power Equipment Market Volume Share (%), by Location 2025 & 2033
- Figure 31: Asia Pacific Wind Power Equipment Market Revenue (billion), by Equipment Type 2025 & 2033
- Figure 32: Asia Pacific Wind Power Equipment Market Volume (K Units), by Equipment Type 2025 & 2033
- Figure 33: Asia Pacific Wind Power Equipment Market Revenue Share (%), by Equipment Type 2025 & 2033
- Figure 34: Asia Pacific Wind Power Equipment Market Volume Share (%), by Equipment Type 2025 & 2033
- Figure 35: Asia Pacific Wind Power Equipment Market Revenue (billion), by Country 2025 & 2033
- Figure 36: Asia Pacific Wind Power Equipment Market Volume (K Units), by Country 2025 & 2033
- Figure 37: Asia Pacific Wind Power Equipment Market Revenue Share (%), by Country 2025 & 2033
- Figure 38: Asia Pacific Wind Power Equipment Market Volume Share (%), by Country 2025 & 2033
- Figure 39: Middle East and Africa Wind Power Equipment Market Revenue (billion), by Location 2025 & 2033
- Figure 40: Middle East and Africa Wind Power Equipment Market Volume (K Units), by Location 2025 & 2033
- Figure 41: Middle East and Africa Wind Power Equipment Market Revenue Share (%), by Location 2025 & 2033
- Figure 42: Middle East and Africa Wind Power Equipment Market Volume Share (%), by Location 2025 & 2033
- Figure 43: Middle East and Africa Wind Power Equipment Market Revenue (billion), by Equipment Type 2025 & 2033
- Figure 44: Middle East and Africa Wind Power Equipment Market Volume (K Units), by Equipment Type 2025 & 2033
- Figure 45: Middle East and Africa Wind Power Equipment Market Revenue Share (%), by Equipment Type 2025 & 2033
- Figure 46: Middle East and Africa Wind Power Equipment Market Volume Share (%), by Equipment Type 2025 & 2033
- Figure 47: Middle East and Africa Wind Power Equipment Market Revenue (billion), by Country 2025 & 2033
- Figure 48: Middle East and Africa Wind Power Equipment Market Volume (K Units), by Country 2025 & 2033
- Figure 49: Middle East and Africa Wind Power Equipment Market Revenue Share (%), by Country 2025 & 2033
- Figure 50: Middle East and Africa Wind Power Equipment Market Volume Share (%), by Country 2025 & 2033
- Figure 51: South America Wind Power Equipment Market Revenue (billion), by Location 2025 & 2033
- Figure 52: South America Wind Power Equipment Market Volume (K Units), by Location 2025 & 2033
- Figure 53: South America Wind Power Equipment Market Revenue Share (%), by Location 2025 & 2033
- Figure 54: South America Wind Power Equipment Market Volume Share (%), by Location 2025 & 2033
- Figure 55: South America Wind Power Equipment Market Revenue (billion), by Equipment Type 2025 & 2033
- Figure 56: South America Wind Power Equipment Market Volume (K Units), by Equipment Type 2025 & 2033
- Figure 57: South America Wind Power Equipment Market Revenue Share (%), by Equipment Type 2025 & 2033
- Figure 58: South America Wind Power Equipment Market Volume Share (%), by Equipment Type 2025 & 2033
- Figure 59: South America Wind Power Equipment Market Revenue (billion), by Country 2025 & 2033
- Figure 60: South America Wind Power Equipment Market Volume (K Units), by Country 2025 & 2033
- Figure 61: South America Wind Power Equipment Market Revenue Share (%), by Country 2025 & 2033
- Figure 62: South America Wind Power Equipment Market Volume Share (%), by Country 2025 & 2033
List of Tables
- Table 1: Global Wind Power Equipment Market Revenue billion Forecast, by Location 2020 & 2033
- Table 2: Global Wind Power Equipment Market Volume K Units Forecast, by Location 2020 & 2033
- Table 3: Global Wind Power Equipment Market Revenue billion Forecast, by Equipment Type 2020 & 2033
- Table 4: Global Wind Power Equipment Market Volume K Units Forecast, by Equipment Type 2020 & 2033
- Table 5: Global Wind Power Equipment Market Revenue billion Forecast, by Region 2020 & 2033
- Table 6: Global Wind Power Equipment Market Volume K Units Forecast, by Region 2020 & 2033
- Table 7: Global Wind Power Equipment Market Revenue billion Forecast, by Location 2020 & 2033
- Table 8: Global Wind Power Equipment Market Volume K Units Forecast, by Location 2020 & 2033
- Table 9: Global Wind Power Equipment Market Revenue billion Forecast, by Equipment Type 2020 & 2033
- Table 10: Global Wind Power Equipment Market Volume K Units Forecast, by Equipment Type 2020 & 2033
- Table 11: Global Wind Power Equipment Market Revenue billion Forecast, by Country 2020 & 2033
- Table 12: Global Wind Power Equipment Market Volume K Units Forecast, by Country 2020 & 2033
- Table 13: United States of America Wind Power Equipment Market Revenue (billion) Forecast, by Application 2020 & 2033
- Table 14: United States of America Wind Power Equipment Market Volume (K Units) Forecast, by Application 2020 & 2033
- Table 15: Canada Wind Power Equipment Market Revenue (billion) Forecast, by Application 2020 & 2033
- Table 16: Canada Wind Power Equipment Market Volume (K Units) Forecast, by Application 2020 & 2033
- Table 17: Rest of the North America Wind Power Equipment Market Revenue (billion) Forecast, by Application 2020 & 2033
- Table 18: Rest of the North America Wind Power Equipment Market Volume (K Units) Forecast, by Application 2020 & 2033
- Table 19: Global Wind Power Equipment Market Revenue billion Forecast, by Location 2020 & 2033
- Table 20: Global Wind Power Equipment Market Volume K Units Forecast, by Location 2020 & 2033
- Table 21: Global Wind Power Equipment Market Revenue billion Forecast, by Equipment Type 2020 & 2033
- Table 22: Global Wind Power Equipment Market Volume K Units Forecast, by Equipment Type 2020 & 2033
- Table 23: Global Wind Power Equipment Market Revenue billion Forecast, by Country 2020 & 2033
- Table 24: Global Wind Power Equipment Market Volume K Units Forecast, by Country 2020 & 2033
- Table 25: United Kingdom Wind Power Equipment Market Revenue (billion) Forecast, by Application 2020 & 2033
- Table 26: United Kingdom Wind Power Equipment Market Volume (K Units) Forecast, by Application 2020 & 2033
- Table 27: France Wind Power Equipment Market Revenue (billion) Forecast, by Application 2020 & 2033
- Table 28: France Wind Power Equipment Market Volume (K Units) Forecast, by Application 2020 & 2033
- Table 29: Norway Wind Power Equipment Market Revenue (billion) Forecast, by Application 2020 & 2033
- Table 30: Norway Wind Power Equipment Market Volume (K Units) Forecast, by Application 2020 & 2033
- Table 31: Italy Wind Power Equipment Market Revenue (billion) Forecast, by Application 2020 & 2033
- Table 32: Italy Wind Power Equipment Market Volume (K Units) Forecast, by Application 2020 & 2033
- Table 33: Germany Wind Power Equipment Market Revenue (billion) Forecast, by Application 2020 & 2033
- Table 34: Germany Wind Power Equipment Market Volume (K Units) Forecast, by Application 2020 & 2033
- Table 35: Rest of the Europe Wind Power Equipment Market Revenue (billion) Forecast, by Application 2020 & 2033
- Table 36: Rest of the Europe Wind Power Equipment Market Volume (K Units) Forecast, by Application 2020 & 2033
- Table 37: Global Wind Power Equipment Market Revenue billion Forecast, by Location 2020 & 2033
- Table 38: Global Wind Power Equipment Market Volume K Units Forecast, by Location 2020 & 2033
- Table 39: Global Wind Power Equipment Market Revenue billion Forecast, by Equipment Type 2020 & 2033
- Table 40: Global Wind Power Equipment Market Volume K Units Forecast, by Equipment Type 2020 & 2033
- Table 41: Global Wind Power Equipment Market Revenue billion Forecast, by Country 2020 & 2033
- Table 42: Global Wind Power Equipment Market Volume K Units Forecast, by Country 2020 & 2033
- Table 43: China Wind Power Equipment Market Revenue (billion) Forecast, by Application 2020 & 2033
- Table 44: China Wind Power Equipment Market Volume (K Units) Forecast, by Application 2020 & 2033
- Table 45: India Wind Power Equipment Market Revenue (billion) Forecast, by Application 2020 & 2033
- Table 46: India Wind Power Equipment Market Volume (K Units) Forecast, by Application 2020 & 2033
- Table 47: Japan Wind Power Equipment Market Revenue (billion) Forecast, by Application 2020 & 2033
- Table 48: Japan Wind Power Equipment Market Volume (K Units) Forecast, by Application 2020 & 2033
- Table 49: Rest of the Asia Pacific Wind Power Equipment Market Revenue (billion) Forecast, by Application 2020 & 2033
- Table 50: Rest of the Asia Pacific Wind Power Equipment Market Volume (K Units) Forecast, by Application 2020 & 2033
- Table 51: Global Wind Power Equipment Market Revenue billion Forecast, by Location 2020 & 2033
- Table 52: Global Wind Power Equipment Market Volume K Units Forecast, by Location 2020 & 2033
- Table 53: Global Wind Power Equipment Market Revenue billion Forecast, by Equipment Type 2020 & 2033
- Table 54: Global Wind Power Equipment Market Volume K Units Forecast, by Equipment Type 2020 & 2033
- Table 55: Global Wind Power Equipment Market Revenue billion Forecast, by Country 2020 & 2033
- Table 56: Global Wind Power Equipment Market Volume K Units Forecast, by Country 2020 & 2033
- Table 57: United Arab Emirates Wind Power Equipment Market Revenue (billion) Forecast, by Application 2020 & 2033
- Table 58: United Arab Emirates Wind Power Equipment Market Volume (K Units) Forecast, by Application 2020 & 2033
- Table 59: Saudi Arabia Wind Power Equipment Market Revenue (billion) Forecast, by Application 2020 & 2033
- Table 60: Saudi Arabia Wind Power Equipment Market Volume (K Units) Forecast, by Application 2020 & 2033
- Table 61: South Africa Wind Power Equipment Market Revenue (billion) Forecast, by Application 2020 & 2033
- Table 62: South Africa Wind Power Equipment Market Volume (K Units) Forecast, by Application 2020 & 2033
- Table 63: Rest of the Middle East and Africa Wind Power Equipment Market Revenue (billion) Forecast, by Application 2020 & 2033
- Table 64: Rest of the Middle East and Africa Wind Power Equipment Market Volume (K Units) Forecast, by Application 2020 & 2033
- Table 65: Global Wind Power Equipment Market Revenue billion Forecast, by Location 2020 & 2033
- Table 66: Global Wind Power Equipment Market Volume K Units Forecast, by Location 2020 & 2033
- Table 67: Global Wind Power Equipment Market Revenue billion Forecast, by Equipment Type 2020 & 2033
- Table 68: Global Wind Power Equipment Market Volume K Units Forecast, by Equipment Type 2020 & 2033
- Table 69: Global Wind Power Equipment Market Revenue billion Forecast, by Country 2020 & 2033
- Table 70: Global Wind Power Equipment Market Volume K Units Forecast, by Country 2020 & 2033
- Table 71: Brazil Wind Power Equipment Market Revenue (billion) Forecast, by Application 2020 & 2033
- Table 72: Brazil Wind Power Equipment Market Volume (K Units) Forecast, by Application 2020 & 2033
- Table 73: Argentina Wind Power Equipment Market Revenue (billion) Forecast, by Application 2020 & 2033
- Table 74: Argentina Wind Power Equipment Market Volume (K Units) Forecast, by Application 2020 & 2033
- Table 75: Rest of the South America Wind Power Equipment Market Revenue (billion) Forecast, by Application 2020 & 2033
- Table 76: Rest of the South America Wind Power Equipment Market Volume (K Units) Forecast, by Application 2020 & 2033
Frequently Asked Questions
1. What is the projected Compound Annual Growth Rate (CAGR) of the Wind Power Equipment Market?
The projected CAGR is approximately 5.7%.
2. Which companies are prominent players in the Wind Power Equipment Market?
Key companies in the market include Guodian United Power Technology Company Limited, Xinjiang Goldwind Science & Technology Co Ltd *List Not Exhaustive, Siemens Gamesa Renewable Energy, Envision Energy, Senvion SA, Vestas Wind Systems AS, General Electric Company, Enercon GmbH, Ming Yang Wind Power Group Limited, Nordex SE.
3. What are the main segments of the Wind Power Equipment Market?
The market segments include Location, Equipment Type.
4. Can you provide details about the market size?
The market size is estimated to be USD 111.2 billion as of 2022.
5. What are some drivers contributing to market growth?
4.; The Declining Cost of Wind Energy4.; Increasing Investments in the Wind Power Sector.
6. What are the notable trends driving market growth?
Increasing Demand from Onshore Wind Power Industry.
7. Are there any restraints impacting market growth?
4.; Substitution From Solar Energy and Gas-Fired Power Plants.
8. Can you provide examples of recent developments in the market?
May 2023: Suzlon, a developer of renewable energy solutions, has received a 69 MW wind energy order from the Indian division of a renowned Nordic Energy Company. Suzlon will deploy 23 wind turbine generators (WTGs) with 3 MW rated capacity and a Hybrid Lattice Tubular (HLT) tower.
9. What pricing options are available for accessing the report?
Pricing options include single-user, multi-user, and enterprise licenses priced at USD 4750, USD 5250, and USD 8750 respectively.
10. Is the market size provided in terms of value or volume?
The market size is provided in terms of value, measured in billion and volume, measured in K Units.
11. Are there any specific market keywords associated with the report?
Yes, the market keyword associated with the report is "Wind Power Equipment Market," which aids in identifying and referencing the specific market segment covered.
12. How do I determine which pricing option suits my needs best?
The pricing options vary based on user requirements and access needs. Individual users may opt for single-user licenses, while businesses requiring broader access may choose multi-user or enterprise licenses for cost-effective access to the report.
13. Are there any additional resources or data provided in the Wind Power Equipment Market report?
While the report offers comprehensive insights, it's advisable to review the specific contents or supplementary materials provided to ascertain if additional resources or data are available.
14. How can I stay updated on further developments or reports in the Wind Power Equipment Market?
To stay informed about further developments, trends, and reports in the Wind Power Equipment Market, consider subscribing to industry newsletters, following relevant companies and organizations, or regularly checking reputable industry news sources and publications.
Methodology
Step 1 - Identification of Relevant Samples Size from Population Database


Step 2 - Approaches for Defining Global Market Size (Value, Volume* & Price*)

Note*: In applicable scenarios
Step 3 - Data Sources
Primary Research
- Web Analytics
- Survey Reports
- Research Institute
- Latest Research Reports
- Opinion Leaders
Secondary Research
- Annual Reports
- White Paper
- Latest Press Release
- Industry Association
- Paid Database
- Investor Presentations

Step 4 - Data Triangulation
Involves using different sources of information in order to increase the validity of a study
These sources are likely to be stakeholders in a program - participants, other researchers, program staff, other community members, and so on.
Then we put all data in single framework & apply various statistical tools to find out the dynamic on the market.
During the analysis stage, feedback from the stakeholder groups would be compared to determine areas of agreement as well as areas of divergence