

Key Insights
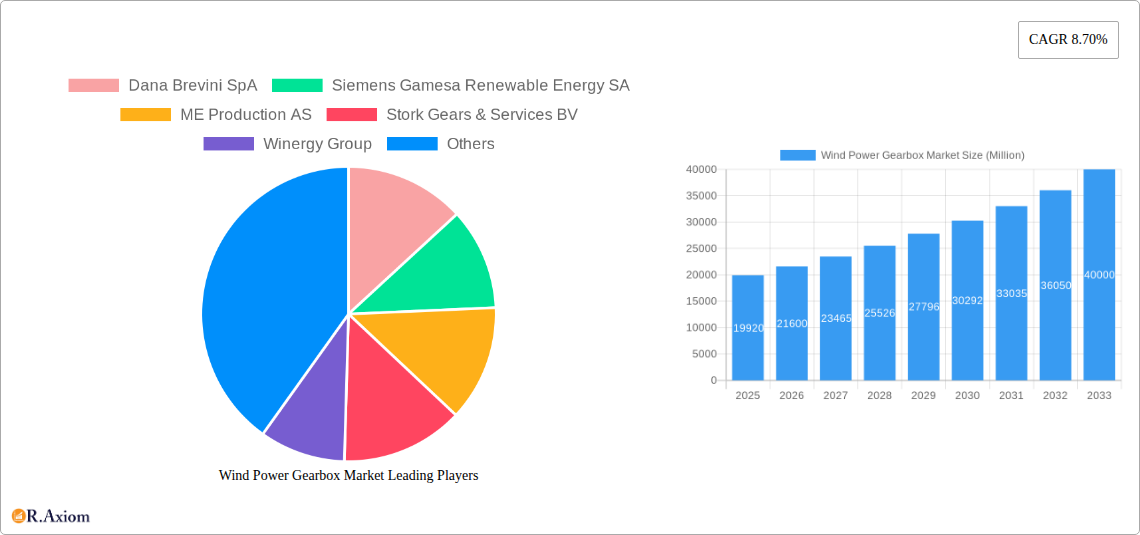
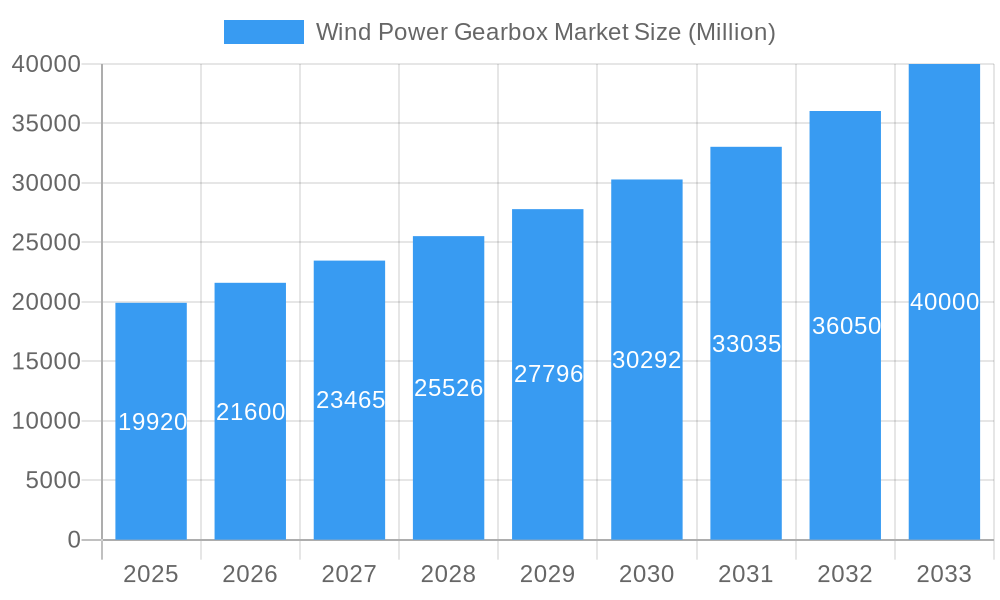
The global wind power gearbox market, valued at $19.92 billion in 2025, is projected to experience robust growth, driven by the escalating demand for renewable energy sources and the increasing installation of onshore and offshore wind turbines. A compound annual growth rate (CAGR) of 8.70% from 2025 to 2033 indicates a significant expansion of the market, reaching an estimated value exceeding $40 billion by 2033. This growth is fueled by several key factors. Government initiatives promoting renewable energy adoption, coupled with decreasing costs of wind energy technology, are major contributors. Furthermore, advancements in gearbox design, leading to improved efficiency, reliability, and durability, are attracting significant investments. The onshore segment currently dominates the market, but the offshore segment is witnessing rapid growth due to the increasing availability of suitable offshore locations and technological advancements enabling efficient operation in challenging marine environments. Key players like Dana Brevini SpA, Siemens Gamesa Renewable Energy SA, and ZF Friedrichshafen AG are strategically investing in research and development to enhance their product offerings and maintain a competitive edge. Geographic expansion, particularly in Asia-Pacific and North America, regions with significant wind energy potential, will further propel market growth.
Wind Power Gearbox Market Market Size (In Billion)
However, challenges remain. The high initial investment cost associated with wind power projects and the need for specialized maintenance and repair services can act as restraints. Moreover, the dependence on raw materials and the fluctuating prices of these commodities might impact manufacturing costs and overall market growth. Despite these challenges, the long-term outlook for the wind power gearbox market remains exceptionally positive, driven by the global imperative to transition towards cleaner energy sources and the continual technological advancements within the wind energy sector. The market's segmentation by deployment location (onshore and offshore) provides opportunities for specialized players to focus on specific technological advancements and market needs.
Wind Power Gearbox Market Company Market Share
Wind Power Gearbox Market: A Comprehensive Report (2019-2033)
This comprehensive report provides a detailed analysis of the global Wind Power Gearbox Market, offering in-depth insights into market dynamics, growth drivers, key players, and future trends. The study period covers 2019-2033, with 2025 serving as the base and estimated year. The report is essential for industry stakeholders, investors, and anyone seeking to understand this dynamic market.
Wind Power Gearbox Market Concentration & Innovation
The Wind Power Gearbox market exhibits a moderately concentrated landscape, with several major players holding significant market share. However, the presence of numerous smaller, specialized companies fosters innovation and competition. The market share of the top five players is estimated at xx%, indicating a competitive but not overly dominated environment. Mergers and acquisitions (M&A) activity has been moderate in recent years, with deal values averaging xx Million annually. Key M&A activities have primarily focused on expanding geographic reach and technological capabilities.
- Market Concentration: Top 5 players hold xx% market share.
- Innovation Drivers: Demand for higher efficiency gearboxes, advancements in materials science, and stringent environmental regulations.
- Regulatory Frameworks: Government policies promoting renewable energy adoption significantly influence market growth.
- Product Substitutes: Direct drive technology presents a significant challenge, but geared solutions still dominate due to cost-effectiveness and maturity.
- End-User Trends: A shift towards larger capacity wind turbines drives demand for robust and efficient gearboxes.
- M&A Activities: Focus on geographical expansion and technology integration; average deal value: xx Million.
Wind Power Gearbox Market Industry Trends & Insights
The Wind Power Gearbox market is experiencing robust growth, driven by the increasing global adoption of wind energy. The market is projected to register a Compound Annual Growth Rate (CAGR) of xx% during the forecast period (2025-2033). Technological advancements, such as the development of higher-efficiency gearboxes and the integration of advanced materials, are contributing to market expansion. Consumer preference for sustainable energy solutions fuels market demand. However, intense competition among established players and the emergence of new technologies like direct drive systems create challenges. Market penetration of gearboxes in new wind energy projects is estimated at xx% in 2025, expected to rise to xx% by 2033.
Dominant Markets & Segments in Wind Power Gearbox Market
The onshore segment currently dominates the Wind Power Gearbox market, accounting for xx% of total market revenue in 2025. However, the offshore segment is projected to experience faster growth during the forecast period, driven by government incentives and the exploration of deeper water resources.
Onshore Segment Dominance:
- Key Drivers: Lower installation costs, established infrastructure, and readily available land.
- Detailed Analysis: The established supply chain and extensive experience in onshore wind projects contribute to the segment’s current dominance. However, land availability constraints and grid integration challenges are potential limiting factors.
Offshore Segment Growth:
- Key Drivers: Vast untapped resources, government subsidies, and technological advancements enabling deeper water deployments.
- Detailed Analysis: Despite higher upfront investment costs, the offshore segment is poised for rapid growth due to its potential to generate substantial clean energy.
Wind Power Gearbox Market Product Developments
Recent product innovations focus on increasing efficiency, durability, and reducing weight. Advancements in materials science, such as the use of lighter alloys and advanced lubricants, are crucial in enhancing gearbox performance. The development of modular gearbox designs allows for greater flexibility in adapting to different turbine sizes and capacities. This enhances the market fit by offering customizable solutions to meet diverse project requirements.
Report Scope & Segmentation Analysis
This report segments the Wind Power Gearbox market primarily by Location of Deployment:
Onshore: This segment comprises gearboxes used in onshore wind turbines. Growth is projected at xx% CAGR from 2025 to 2033, driven by continuous expansion of onshore wind farms globally. The market size in 2025 is estimated at xx Million. Competition is intense with multiple players offering varying levels of customization and technological sophistication.
Offshore: This segment focuses on gearboxes specifically designed for offshore wind turbines. The offshore segment is anticipated to grow at a faster CAGR of xx% from 2025 to 2033, propelled by increasing investments in offshore wind energy projects. Market size in 2025 is estimated at xx Million. The competitive landscape here is less crowded compared to the onshore sector but is rapidly evolving with technological innovations.
Key Drivers of Wind Power Gearbox Market Growth
The growth of the Wind Power Gearbox market is propelled by several key factors:
- Increasing demand for renewable energy: Global efforts to reduce carbon emissions are driving investments in wind energy projects.
- Technological advancements: Innovations in gearbox design, materials, and manufacturing processes lead to higher efficiency and lower costs.
- Government policies and incentives: Supportive regulatory frameworks and financial incentives encourage wind energy development.
- Falling costs of wind energy: Continuous technological advancements and economies of scale are reducing the overall cost of wind power generation.
Challenges in the Wind Power Gearbox Market Sector
Several factors hinder the growth of the Wind Power Gearbox market:
- Competition from direct drive technology: Direct drive systems offer higher efficiency but are often more expensive.
- Supply chain disruptions: Global supply chain issues can impact the availability and cost of raw materials and components.
- High initial investment costs: The upfront cost of installing wind turbines can be significant, especially for offshore projects.
- Maintenance and repair costs: Gearboxes require regular maintenance, which can be expensive.
Emerging Opportunities in Wind Power Gearbox Market
The Wind Power Gearbox market presents several promising opportunities:
- Growth in offshore wind energy: The vast potential of offshore wind resources offers significant growth prospects.
- Development of next-generation gearboxes: Advancements in materials and design can lead to even higher efficiency and durability.
- Integration of smart technologies: The incorporation of sensors and data analytics enhances gearbox monitoring and maintenance.
- Expansion into emerging markets: Developing countries present significant opportunities for wind energy growth.
Leading Players in the Wind Power Gearbox Market
- Dana Brevini SpA
- Siemens Gamesa Renewable Energy SA
- ME Production AS
- Stork Gears & Services BV
- Winergy Group
- Turbine Repair Solutions
- Elecon Engineering Company Limited
- ZF Friedrichshafen AG
Key Developments in Wind Power Gearbox Market Industry
- September 2023: Sany Renewable Energy unveils its 919 wind turbine platform, featuring modular gearboxes for 8.5-11 MW turbines.
- June 2022: Eickhoff Wind Asia inaugurates a new gearbox assembly facility in Chennai, India.
- March 2022: SKF introduces innovative rolling bearing technology, enabling lighter and more efficient drivetrains.
Strategic Outlook for Wind Power Gearbox Market
The future of the Wind Power Gearbox market looks promising, driven by the increasing global demand for renewable energy and continuous technological advancements. The market is expected to witness significant growth, particularly in the offshore segment, as countries strive to meet their renewable energy targets. Companies that invest in innovation, optimize their supply chains, and offer cost-effective and reliable solutions are poised to capture significant market share.
Wind Power Gearbox Market Segmentation
-
1. Location of Deployment
- 1.1. Onshore
- 1.2. Offshore
Wind Power Gearbox Market Segmentation By Geography
-
1. North America
- 1.1. United States
- 1.2. Canada
- 1.3. Rest of North America
-
2. Asia Pacific
- 2.1. China
- 2.2. India
- 2.3. Japan
- 2.4. Asutralia
- 2.5. Rest of Asia Pacific
-
3. Europe
- 3.1. United Kingdom
- 3.2. Germany
- 3.3. France
- 3.4. Spain
- 3.5. Rest of Europe
-
4. South America
- 4.1. Brazil
- 4.2. Argentina
- 4.3. Chile
- 4.4. Rest of South America
-
5. Middle East and Africa
- 5.1. Saudi Arabia
- 5.2. United Arab Emirates
- 5.3. South Africa
- 5.4. Rest of Middle East
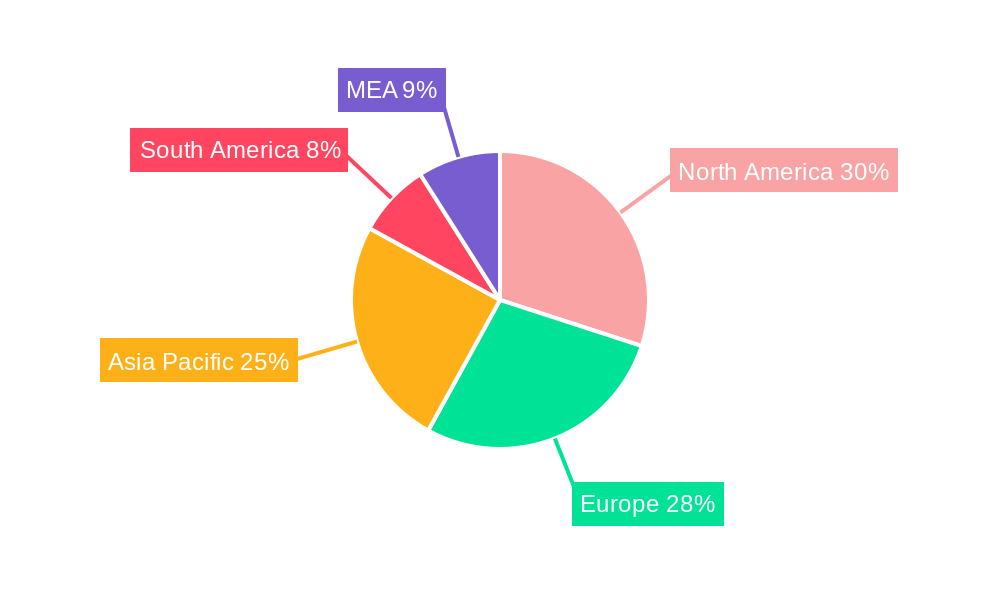
Wind Power Gearbox Market Regional Market Share
Geographic Coverage of Wind Power Gearbox Market
Wind Power Gearbox Market REPORT HIGHLIGHTS
| Aspects | Details |
|---|---|
| Study Period | 2020-2034 |
| Base Year | 2025 |
| Estimated Year | 2026 |
| Forecast Period | 2026-2034 |
| Historical Period | 2020-2025 |
| Growth Rate | CAGR of 8.70% from 2020-2034 |
| Segmentation |
|
Table of Contents
- 1. Introduction
- 1.1. Research Scope
- 1.2. Market Segmentation
- 1.3. Research Objective
- 1.4. Definitions and Assumptions
- 2. Executive Summary
- 2.1. Market Snapshot
- 3. Market Dynamics
- 3.1. Market Drivers
- 3.2. Market Restrains
- 3.3. Market Trends
- 3.4. Market Opportunities
- 4. Market Factor Analysis
- 4.1. Porters Five Forces
- 4.1.1. Bargaining Power of Suppliers
- 4.1.2. Bargaining Power of Buyers
- 4.1.3. Threat of New Entrants
- 4.1.4. Threat of Substitutes
- 4.1.5. Competitive Rivalry
- 4.2. PESTEL analysis
- 4.3. BCG Analysis
- 4.3.1. Stars (High Growth, High Market Share)
- 4.3.2. Cash Cows (Low Growth, High Market Share)
- 4.3.3. Question Mark (High Growth, Low Market Share)
- 4.3.4. Dogs (Low Growth, Low Market Share)
- 4.4. Ansoff Matrix Analysis
- 4.5. Supply Chain Analysis
- 4.6. Regulatory Landscape
- 4.7. Current Market Potential and Opportunity Assessment (TAM–SAM–SOM Framework)
- 4.8. RAX Analyst Note
- 4.1. Porters Five Forces
- 5. Market Analysis, Insights and Forecast 2021-2033
- 5.1. Market Analysis, Insights and Forecast - by Location of Deployment
- 5.1.1. Onshore
- 5.1.2. Offshore
- 5.2. Market Analysis, Insights and Forecast - by Region
- 5.2.1. North America
- 5.2.2. Asia Pacific
- 5.2.3. Europe
- 5.2.4. South America
- 5.2.5. Middle East and Africa
- 5.1. Market Analysis, Insights and Forecast - by Location of Deployment
- 6. Global Wind Power Gearbox Market Analysis, Insights and Forecast, 2021-2033
- 6.1. Market Analysis, Insights and Forecast - by Location of Deployment
- 6.1.1. Onshore
- 6.1.2. Offshore
- 6.1. Market Analysis, Insights and Forecast - by Location of Deployment
- 7. North America Wind Power Gearbox Market Analysis, Insights and Forecast, 2020-2032
- 7.1. Market Analysis, Insights and Forecast - by Location of Deployment
- 7.1.1. Onshore
- 7.1.2. Offshore
- 7.1. Market Analysis, Insights and Forecast - by Location of Deployment
- 8. Asia Pacific Wind Power Gearbox Market Analysis, Insights and Forecast, 2020-2032
- 8.1. Market Analysis, Insights and Forecast - by Location of Deployment
- 8.1.1. Onshore
- 8.1.2. Offshore
- 8.1. Market Analysis, Insights and Forecast - by Location of Deployment
- 9. Europe Wind Power Gearbox Market Analysis, Insights and Forecast, 2020-2032
- 9.1. Market Analysis, Insights and Forecast - by Location of Deployment
- 9.1.1. Onshore
- 9.1.2. Offshore
- 9.1. Market Analysis, Insights and Forecast - by Location of Deployment
- 10. South America Wind Power Gearbox Market Analysis, Insights and Forecast, 2020-2032
- 10.1. Market Analysis, Insights and Forecast - by Location of Deployment
- 10.1.1. Onshore
- 10.1.2. Offshore
- 10.1. Market Analysis, Insights and Forecast - by Location of Deployment
- 11. Middle East and Africa Wind Power Gearbox Market Analysis, Insights and Forecast, 2020-2032
- 11.1. Market Analysis, Insights and Forecast - by Location of Deployment
- 11.1.1. Onshore
- 11.1.2. Offshore
- 11.1. Market Analysis, Insights and Forecast - by Location of Deployment
- 12. Competitive Analysis
- 12.1. Company Profiles
- 12.1.1 Dana Brevini SpA
- 12.1.1.1. Company Overview
- 12.1.1.2. Products
- 12.1.1.3. Company Financials
- 12.1.1.4. SWOT Analysis
- 12.1.2 Siemens Gamesa Renewable Energy SA
- 12.1.2.1. Company Overview
- 12.1.2.2. Products
- 12.1.2.3. Company Financials
- 12.1.2.4. SWOT Analysis
- 12.1.3 ME Production AS
- 12.1.3.1. Company Overview
- 12.1.3.2. Products
- 12.1.3.3. Company Financials
- 12.1.3.4. SWOT Analysis
- 12.1.4 Stork Gears & Services BV
- 12.1.4.1. Company Overview
- 12.1.4.2. Products
- 12.1.4.3. Company Financials
- 12.1.4.4. SWOT Analysis
- 12.1.5 Winergy Group
- 12.1.5.1. Company Overview
- 12.1.5.2. Products
- 12.1.5.3. Company Financials
- 12.1.5.4. SWOT Analysis
- 12.1.6 Turbine Repair Solutions
- 12.1.6.1. Company Overview
- 12.1.6.2. Products
- 12.1.6.3. Company Financials
- 12.1.6.4. SWOT Analysis
- 12.1.7 Elecon Engineering Company Limited*List Not Exhaustive
- 12.1.7.1. Company Overview
- 12.1.7.2. Products
- 12.1.7.3. Company Financials
- 12.1.7.4. SWOT Analysis
- 12.1.8 ZF Friedrichshafen AG
- 12.1.8.1. Company Overview
- 12.1.8.2. Products
- 12.1.8.3. Company Financials
- 12.1.8.4. SWOT Analysis
- 12.1.1 Dana Brevini SpA
- 12.2. Market Entropy
- 12.2.1 Company's Key Areas Served
- 12.2.2 Recent Developments
- 12.3. Company Market Share Analysis 2025
- 12.3.1 Top 5 Companies Market Share Analysis
- 12.3.2 Top 3 Companies Market Share Analysis
- 12.4. List of Potential Customers
- 13. Research Methodology
List of Figures
- Figure 1: Global Wind Power Gearbox Market Revenue Breakdown (Million, %) by Region 2025 & 2033
- Figure 2: Global Wind Power Gearbox Market Volume Breakdown (K Unit, %) by Region 2025 & 2033
- Figure 3: North America Wind Power Gearbox Market Revenue (Million), by Location of Deployment 2025 & 2033
- Figure 4: North America Wind Power Gearbox Market Volume (K Unit), by Location of Deployment 2025 & 2033
- Figure 5: North America Wind Power Gearbox Market Revenue Share (%), by Location of Deployment 2025 & 2033
- Figure 6: North America Wind Power Gearbox Market Volume Share (%), by Location of Deployment 2025 & 2033
- Figure 7: North America Wind Power Gearbox Market Revenue (Million), by Country 2025 & 2033
- Figure 8: North America Wind Power Gearbox Market Volume (K Unit), by Country 2025 & 2033
- Figure 9: North America Wind Power Gearbox Market Revenue Share (%), by Country 2025 & 2033
- Figure 10: North America Wind Power Gearbox Market Volume Share (%), by Country 2025 & 2033
- Figure 11: Asia Pacific Wind Power Gearbox Market Revenue (Million), by Location of Deployment 2025 & 2033
- Figure 12: Asia Pacific Wind Power Gearbox Market Volume (K Unit), by Location of Deployment 2025 & 2033
- Figure 13: Asia Pacific Wind Power Gearbox Market Revenue Share (%), by Location of Deployment 2025 & 2033
- Figure 14: Asia Pacific Wind Power Gearbox Market Volume Share (%), by Location of Deployment 2025 & 2033
- Figure 15: Asia Pacific Wind Power Gearbox Market Revenue (Million), by Country 2025 & 2033
- Figure 16: Asia Pacific Wind Power Gearbox Market Volume (K Unit), by Country 2025 & 2033
- Figure 17: Asia Pacific Wind Power Gearbox Market Revenue Share (%), by Country 2025 & 2033
- Figure 18: Asia Pacific Wind Power Gearbox Market Volume Share (%), by Country 2025 & 2033
- Figure 19: Europe Wind Power Gearbox Market Revenue (Million), by Location of Deployment 2025 & 2033
- Figure 20: Europe Wind Power Gearbox Market Volume (K Unit), by Location of Deployment 2025 & 2033
- Figure 21: Europe Wind Power Gearbox Market Revenue Share (%), by Location of Deployment 2025 & 2033
- Figure 22: Europe Wind Power Gearbox Market Volume Share (%), by Location of Deployment 2025 & 2033
- Figure 23: Europe Wind Power Gearbox Market Revenue (Million), by Country 2025 & 2033
- Figure 24: Europe Wind Power Gearbox Market Volume (K Unit), by Country 2025 & 2033
- Figure 25: Europe Wind Power Gearbox Market Revenue Share (%), by Country 2025 & 2033
- Figure 26: Europe Wind Power Gearbox Market Volume Share (%), by Country 2025 & 2033
- Figure 27: South America Wind Power Gearbox Market Revenue (Million), by Location of Deployment 2025 & 2033
- Figure 28: South America Wind Power Gearbox Market Volume (K Unit), by Location of Deployment 2025 & 2033
- Figure 29: South America Wind Power Gearbox Market Revenue Share (%), by Location of Deployment 2025 & 2033
- Figure 30: South America Wind Power Gearbox Market Volume Share (%), by Location of Deployment 2025 & 2033
- Figure 31: South America Wind Power Gearbox Market Revenue (Million), by Country 2025 & 2033
- Figure 32: South America Wind Power Gearbox Market Volume (K Unit), by Country 2025 & 2033
- Figure 33: South America Wind Power Gearbox Market Revenue Share (%), by Country 2025 & 2033
- Figure 34: South America Wind Power Gearbox Market Volume Share (%), by Country 2025 & 2033
- Figure 35: Middle East and Africa Wind Power Gearbox Market Revenue (Million), by Location of Deployment 2025 & 2033
- Figure 36: Middle East and Africa Wind Power Gearbox Market Volume (K Unit), by Location of Deployment 2025 & 2033
- Figure 37: Middle East and Africa Wind Power Gearbox Market Revenue Share (%), by Location of Deployment 2025 & 2033
- Figure 38: Middle East and Africa Wind Power Gearbox Market Volume Share (%), by Location of Deployment 2025 & 2033
- Figure 39: Middle East and Africa Wind Power Gearbox Market Revenue (Million), by Country 2025 & 2033
- Figure 40: Middle East and Africa Wind Power Gearbox Market Volume (K Unit), by Country 2025 & 2033
- Figure 41: Middle East and Africa Wind Power Gearbox Market Revenue Share (%), by Country 2025 & 2033
- Figure 42: Middle East and Africa Wind Power Gearbox Market Volume Share (%), by Country 2025 & 2033
List of Tables
- Table 1: Global Wind Power Gearbox Market Revenue Million Forecast, by Location of Deployment 2020 & 2033
- Table 2: Global Wind Power Gearbox Market Volume K Unit Forecast, by Location of Deployment 2020 & 2033
- Table 3: Global Wind Power Gearbox Market Revenue Million Forecast, by Region 2020 & 2033
- Table 4: Global Wind Power Gearbox Market Volume K Unit Forecast, by Region 2020 & 2033
- Table 5: Global Wind Power Gearbox Market Revenue Million Forecast, by Location of Deployment 2020 & 2033
- Table 6: Global Wind Power Gearbox Market Volume K Unit Forecast, by Location of Deployment 2020 & 2033
- Table 7: Global Wind Power Gearbox Market Revenue Million Forecast, by Country 2020 & 2033
- Table 8: Global Wind Power Gearbox Market Volume K Unit Forecast, by Country 2020 & 2033
- Table 9: United States Wind Power Gearbox Market Revenue (Million) Forecast, by Application 2020 & 2033
- Table 10: United States Wind Power Gearbox Market Volume (K Unit) Forecast, by Application 2020 & 2033
- Table 11: Canada Wind Power Gearbox Market Revenue (Million) Forecast, by Application 2020 & 2033
- Table 12: Canada Wind Power Gearbox Market Volume (K Unit) Forecast, by Application 2020 & 2033
- Table 13: Rest of North America Wind Power Gearbox Market Revenue (Million) Forecast, by Application 2020 & 2033
- Table 14: Rest of North America Wind Power Gearbox Market Volume (K Unit) Forecast, by Application 2020 & 2033
- Table 15: Global Wind Power Gearbox Market Revenue Million Forecast, by Location of Deployment 2020 & 2033
- Table 16: Global Wind Power Gearbox Market Volume K Unit Forecast, by Location of Deployment 2020 & 2033
- Table 17: Global Wind Power Gearbox Market Revenue Million Forecast, by Country 2020 & 2033
- Table 18: Global Wind Power Gearbox Market Volume K Unit Forecast, by Country 2020 & 2033
- Table 19: China Wind Power Gearbox Market Revenue (Million) Forecast, by Application 2020 & 2033
- Table 20: China Wind Power Gearbox Market Volume (K Unit) Forecast, by Application 2020 & 2033
- Table 21: India Wind Power Gearbox Market Revenue (Million) Forecast, by Application 2020 & 2033
- Table 22: India Wind Power Gearbox Market Volume (K Unit) Forecast, by Application 2020 & 2033
- Table 23: Japan Wind Power Gearbox Market Revenue (Million) Forecast, by Application 2020 & 2033
- Table 24: Japan Wind Power Gearbox Market Volume (K Unit) Forecast, by Application 2020 & 2033
- Table 25: Asutralia Wind Power Gearbox Market Revenue (Million) Forecast, by Application 2020 & 2033
- Table 26: Asutralia Wind Power Gearbox Market Volume (K Unit) Forecast, by Application 2020 & 2033
- Table 27: Rest of Asia Pacific Wind Power Gearbox Market Revenue (Million) Forecast, by Application 2020 & 2033
- Table 28: Rest of Asia Pacific Wind Power Gearbox Market Volume (K Unit) Forecast, by Application 2020 & 2033
- Table 29: Global Wind Power Gearbox Market Revenue Million Forecast, by Location of Deployment 2020 & 2033
- Table 30: Global Wind Power Gearbox Market Volume K Unit Forecast, by Location of Deployment 2020 & 2033
- Table 31: Global Wind Power Gearbox Market Revenue Million Forecast, by Country 2020 & 2033
- Table 32: Global Wind Power Gearbox Market Volume K Unit Forecast, by Country 2020 & 2033
- Table 33: United Kingdom Wind Power Gearbox Market Revenue (Million) Forecast, by Application 2020 & 2033
- Table 34: United Kingdom Wind Power Gearbox Market Volume (K Unit) Forecast, by Application 2020 & 2033
- Table 35: Germany Wind Power Gearbox Market Revenue (Million) Forecast, by Application 2020 & 2033
- Table 36: Germany Wind Power Gearbox Market Volume (K Unit) Forecast, by Application 2020 & 2033
- Table 37: France Wind Power Gearbox Market Revenue (Million) Forecast, by Application 2020 & 2033
- Table 38: France Wind Power Gearbox Market Volume (K Unit) Forecast, by Application 2020 & 2033
- Table 39: Spain Wind Power Gearbox Market Revenue (Million) Forecast, by Application 2020 & 2033
- Table 40: Spain Wind Power Gearbox Market Volume (K Unit) Forecast, by Application 2020 & 2033
- Table 41: Rest of Europe Wind Power Gearbox Market Revenue (Million) Forecast, by Application 2020 & 2033
- Table 42: Rest of Europe Wind Power Gearbox Market Volume (K Unit) Forecast, by Application 2020 & 2033
- Table 43: Global Wind Power Gearbox Market Revenue Million Forecast, by Location of Deployment 2020 & 2033
- Table 44: Global Wind Power Gearbox Market Volume K Unit Forecast, by Location of Deployment 2020 & 2033
- Table 45: Global Wind Power Gearbox Market Revenue Million Forecast, by Country 2020 & 2033
- Table 46: Global Wind Power Gearbox Market Volume K Unit Forecast, by Country 2020 & 2033
- Table 47: Brazil Wind Power Gearbox Market Revenue (Million) Forecast, by Application 2020 & 2033
- Table 48: Brazil Wind Power Gearbox Market Volume (K Unit) Forecast, by Application 2020 & 2033
- Table 49: Argentina Wind Power Gearbox Market Revenue (Million) Forecast, by Application 2020 & 2033
- Table 50: Argentina Wind Power Gearbox Market Volume (K Unit) Forecast, by Application 2020 & 2033
- Table 51: Chile Wind Power Gearbox Market Revenue (Million) Forecast, by Application 2020 & 2033
- Table 52: Chile Wind Power Gearbox Market Volume (K Unit) Forecast, by Application 2020 & 2033
- Table 53: Rest of South America Wind Power Gearbox Market Revenue (Million) Forecast, by Application 2020 & 2033
- Table 54: Rest of South America Wind Power Gearbox Market Volume (K Unit) Forecast, by Application 2020 & 2033
- Table 55: Global Wind Power Gearbox Market Revenue Million Forecast, by Location of Deployment 2020 & 2033
- Table 56: Global Wind Power Gearbox Market Volume K Unit Forecast, by Location of Deployment 2020 & 2033
- Table 57: Global Wind Power Gearbox Market Revenue Million Forecast, by Country 2020 & 2033
- Table 58: Global Wind Power Gearbox Market Volume K Unit Forecast, by Country 2020 & 2033
- Table 59: Saudi Arabia Wind Power Gearbox Market Revenue (Million) Forecast, by Application 2020 & 2033
- Table 60: Saudi Arabia Wind Power Gearbox Market Volume (K Unit) Forecast, by Application 2020 & 2033
- Table 61: United Arab Emirates Wind Power Gearbox Market Revenue (Million) Forecast, by Application 2020 & 2033
- Table 62: United Arab Emirates Wind Power Gearbox Market Volume (K Unit) Forecast, by Application 2020 & 2033
- Table 63: South Africa Wind Power Gearbox Market Revenue (Million) Forecast, by Application 2020 & 2033
- Table 64: South Africa Wind Power Gearbox Market Volume (K Unit) Forecast, by Application 2020 & 2033
- Table 65: Rest of Middle East Wind Power Gearbox Market Revenue (Million) Forecast, by Application 2020 & 2033
- Table 66: Rest of Middle East Wind Power Gearbox Market Volume (K Unit) Forecast, by Application 2020 & 2033
Frequently Asked Questions
1. What is the projected Compound Annual Growth Rate (CAGR) of the Wind Power Gearbox Market?
The projected CAGR is approximately 8.70%.
2. Which companies are prominent players in the Wind Power Gearbox Market?
Key companies in the market include Dana Brevini SpA, Siemens Gamesa Renewable Energy SA, ME Production AS, Stork Gears & Services BV, Winergy Group, Turbine Repair Solutions, Elecon Engineering Company Limited*List Not Exhaustive, ZF Friedrichshafen AG.
3. What are the main segments of the Wind Power Gearbox Market?
The market segments include Location of Deployment.
4. Can you provide details about the market size?
The market size is estimated to be USD 19.92 Million as of 2022.
5. What are some drivers contributing to market growth?
Increasing Adoption of Wind Energy4.; Growing Investments in Wind Energy.
6. What are the notable trends driving market growth?
Offshore Segment to Register Higher Growth.
7. Are there any restraints impacting market growth?
Increasing Penetration of Other Sources of Renewable Energy.
8. Can you provide examples of recent developments in the market?
In September 2023, Sany Renewable Energy (Sany RE) revealed its latest 919 wind turbine platform. The 919 Platform adopts an integrated design, and developments on the 919 Platform share structural components such as the hub, main shaft, front bedplate, blades, gearboxes, and electrical systems are developed as modular systems to cover capacity from 8.5 MW to 11 MW wind turbines with rotor diameters ranging from 214 meters to 230 meters.
9. What pricing options are available for accessing the report?
Pricing options include single-user, multi-user, and enterprise licenses priced at USD 4750, USD 5250, and USD 8750 respectively.
10. Is the market size provided in terms of value or volume?
The market size is provided in terms of value, measured in Million and volume, measured in K Unit.
11. Are there any specific market keywords associated with the report?
Yes, the market keyword associated with the report is "Wind Power Gearbox Market," which aids in identifying and referencing the specific market segment covered.
12. How do I determine which pricing option suits my needs best?
The pricing options vary based on user requirements and access needs. Individual users may opt for single-user licenses, while businesses requiring broader access may choose multi-user or enterprise licenses for cost-effective access to the report.
13. Are there any additional resources or data provided in the Wind Power Gearbox Market report?
While the report offers comprehensive insights, it's advisable to review the specific contents or supplementary materials provided to ascertain if additional resources or data are available.
14. How can I stay updated on further developments or reports in the Wind Power Gearbox Market?
To stay informed about further developments, trends, and reports in the Wind Power Gearbox Market, consider subscribing to industry newsletters, following relevant companies and organizations, or regularly checking reputable industry news sources and publications.
Methodology
Step 1 - Identification of Relevant Samples Size from Population Database


Step 2 - Approaches for Defining Global Market Size (Value, Volume* & Price*)

Note*: In applicable scenarios
Step 3 - Data Sources
Primary Research
- Web Analytics
- Survey Reports
- Research Institute
- Latest Research Reports
- Opinion Leaders
Secondary Research
- Annual Reports
- White Paper
- Latest Press Release
- Industry Association
- Paid Database
- Investor Presentations

Step 4 - Data Triangulation
Involves using different sources of information in order to increase the validity of a study
These sources are likely to be stakeholders in a program - participants, other researchers, program staff, other community members, and so on.
Then we put all data in single framework & apply various statistical tools to find out the dynamic on the market.
During the analysis stage, feedback from the stakeholder groups would be compared to determine areas of agreement as well as areas of divergence