

Key Insights
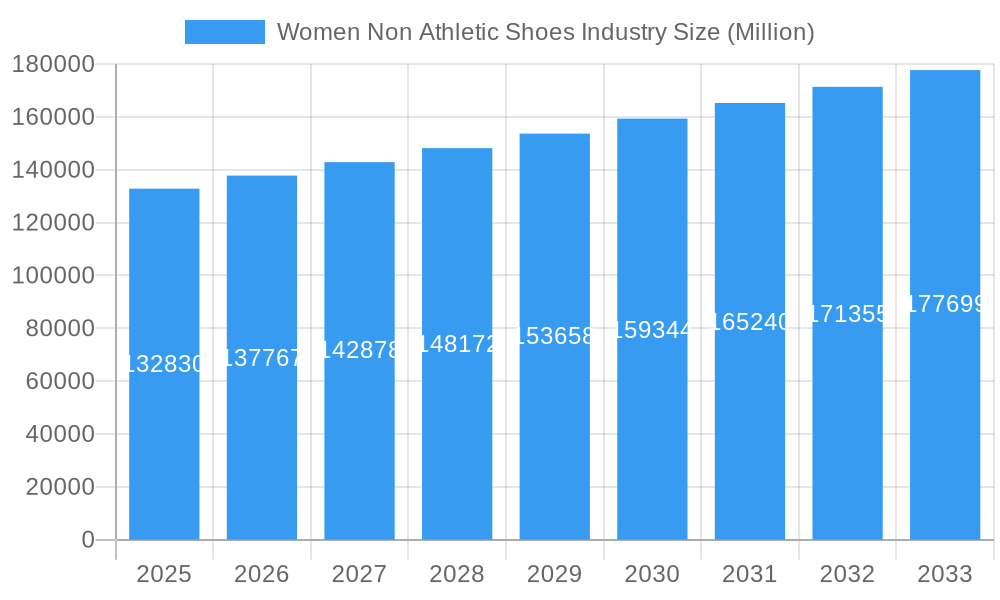
The global women's non-athletic footwear market, valued at $132.83 billion in 2025, is projected to experience steady growth, exhibiting a Compound Annual Growth Rate (CAGR) of 3.68% from 2025 to 2033. This growth is driven by several key factors. Increasing disposable incomes, particularly in developing economies, are fueling demand for diverse and fashionable footwear. E-commerce platforms are significantly expanding market reach, offering consumers a wider selection and greater convenience. Furthermore, evolving fashion trends, the rise of influencer marketing, and the growing preference for comfortable yet stylish footwear are contributing to market expansion. The premium segment is expected to show stronger growth than the mass segment due to increasing consumer preference for high-quality and designer footwear. Significant market segments include boots and shoes, heels and pumps, flats, and sandals, with boots and shoes currently holding the largest market share. Both online and offline distribution channels play crucial roles, with online sales experiencing rapid growth due to the convenience and accessibility they offer. Key players such as Aldo, Bata, Tapestry, Kering, LVMH, and Prada are shaping market competition through innovation, brand building, and strategic expansion. Geographic growth is expected to be diverse; North America and Europe will maintain substantial market shares, while Asia-Pacific is poised for significant growth due to its burgeoning middle class and increasing fashion consciousness.
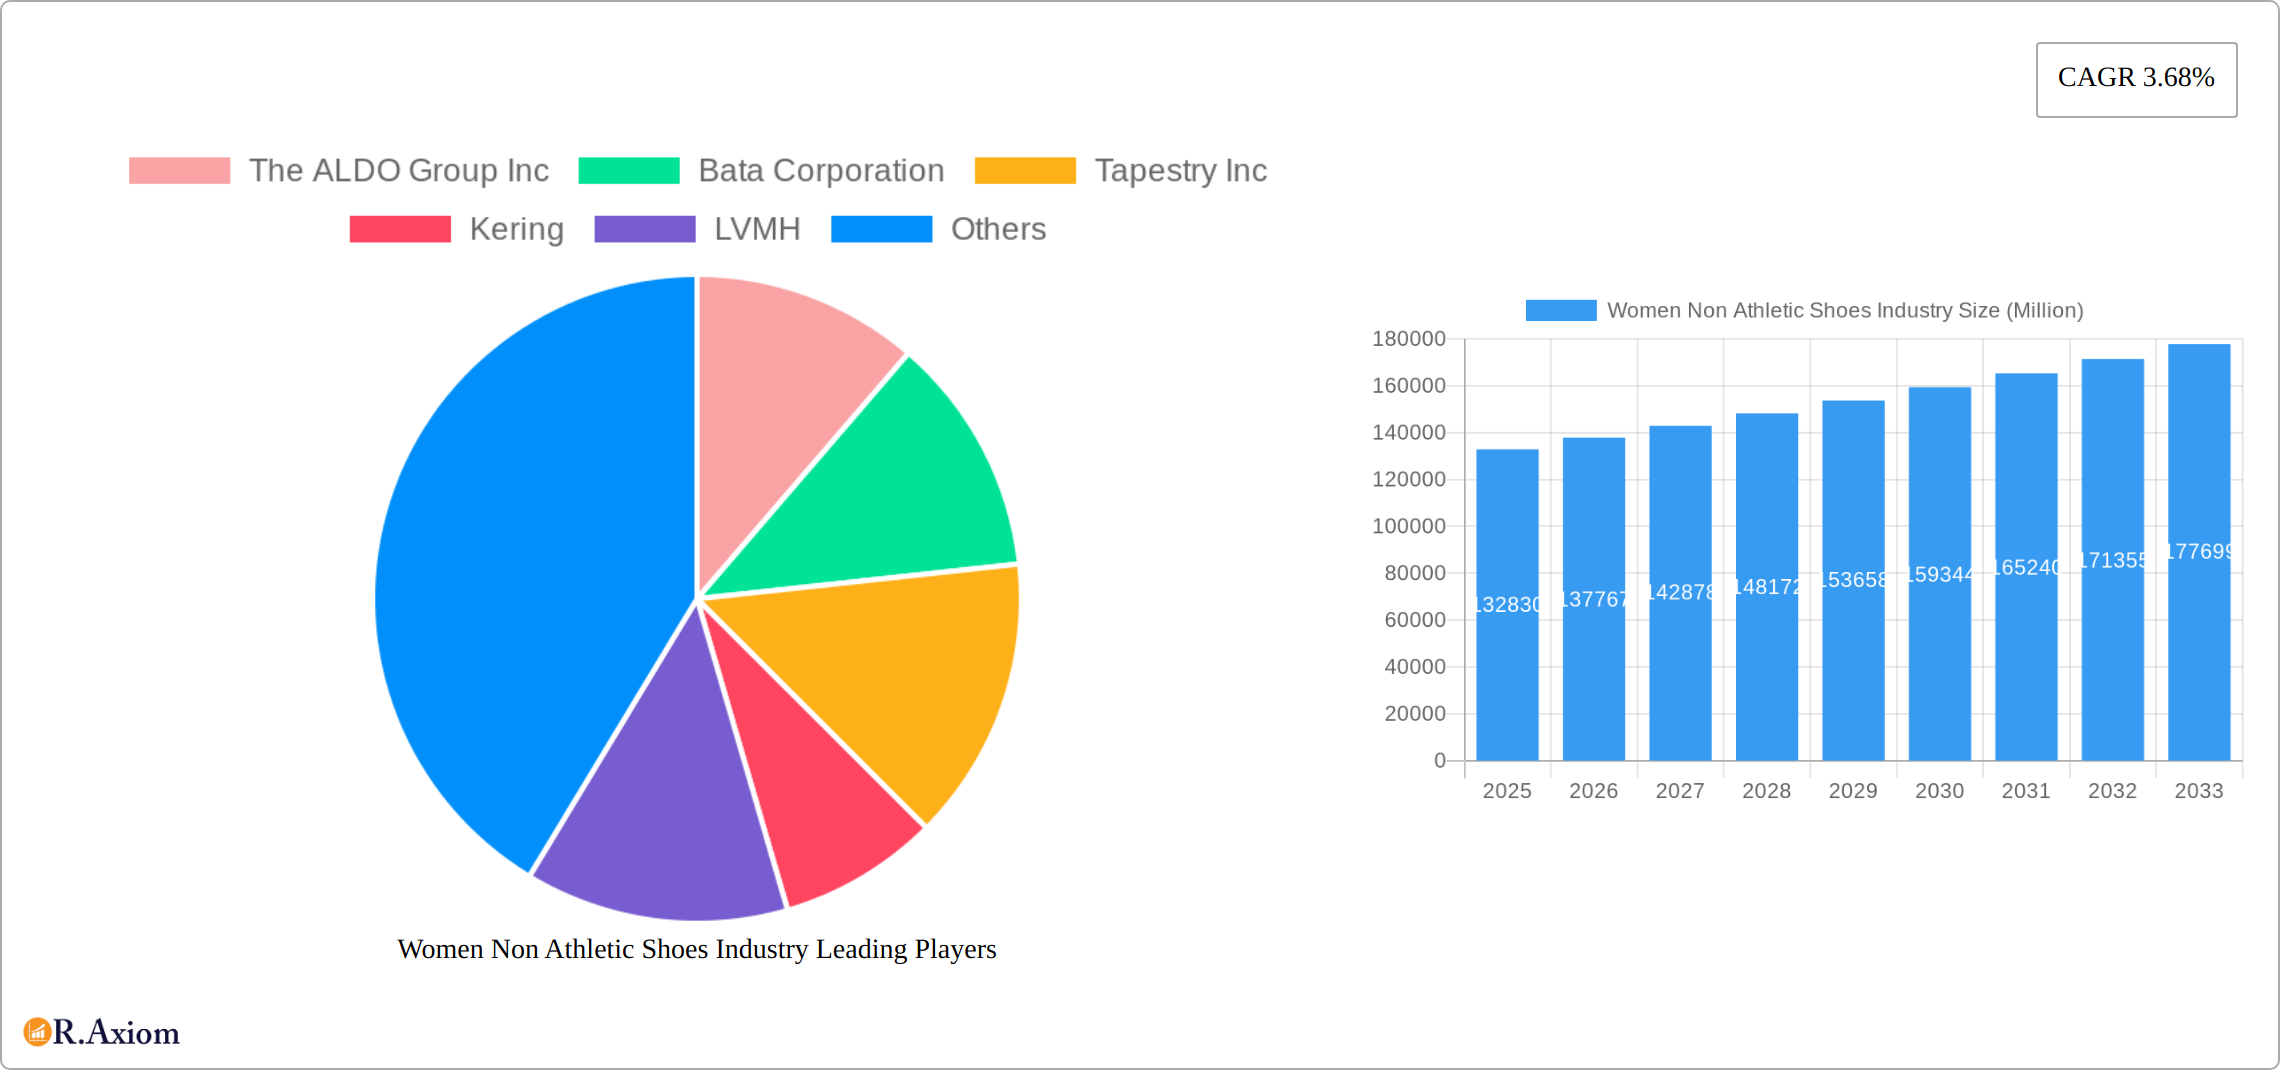
Women Non Athletic Shoes Industry Market Size (In Billion)
The market's growth, however, is not without challenges. Fluctuations in raw material prices, economic downturns, and changing consumer preferences can impact market performance. Furthermore, intense competition among established brands and the emergence of new players necessitate continuous innovation and strategic adaptation. Sustainability concerns are also gaining traction, with consumers increasingly demanding eco-friendly and ethically sourced products. Companies are responding to this by incorporating sustainable materials and production practices. The forecast period of 2025-2033 presents both opportunities and challenges, requiring businesses to strategically address market dynamics to capture growth opportunities and maintain competitiveness.
Women Non Athletic Shoes Industry Company Market Share
Women's Non-Athletic Shoes Industry Market Report: 2019-2033
This comprehensive report provides a detailed analysis of the global women's non-athletic shoes industry, covering the period from 2019 to 2033. It offers invaluable insights into market trends, competitive dynamics, and future growth opportunities, enabling businesses to make informed strategic decisions. The report segments the market by type, distribution channel, and category, providing granular data for effective market penetration strategies. With a focus on key players and emerging opportunities, this report is an essential resource for industry stakeholders, investors, and market researchers. The base year for this analysis is 2025, with forecasts extending to 2033.
Women's Non-Athletic Shoes Industry Market Concentration & Innovation
This section analyzes the market concentration, innovation drivers, regulatory landscape, product substitutes, end-user trends, and mergers & acquisitions (M&A) within the women's non-athletic footwear market. The market is characterized by a moderately concentrated structure, with a few dominant players holding significant market share. However, the presence of numerous smaller brands and the rise of e-commerce platforms contribute to a dynamic competitive environment.
- Market Concentration: The top 5 players account for approximately xx% of the global market share in 2025, while the remaining xx% is fragmented amongst numerous smaller players. Market share data for the historical period (2019-2024) and projected market shares (2025-2033) are included in the full report.
- Innovation Drivers: Key innovation drivers include the introduction of sustainable materials, technological advancements in comfort and design (e.g., 3D-printed footwear, smart insoles), and increasing personalization options catering to diverse consumer preferences.
- Regulatory Frameworks: Government regulations related to product safety, labor practices, and environmental sustainability are influencing industry practices. Compliance costs and evolving regulations present both challenges and opportunities for innovation.
- Product Substitutes: The industry faces competition from alternative footwear categories, including athletic shoes and casual footwear, which are increasingly blurring the lines between different styles.
- End-User Trends: Growing demand for comfort, style, and sustainability is shaping product development and marketing strategies. Millennials and Gen Z are increasingly driving trends related to ethical sourcing, eco-friendly materials, and unique designs.
- M&A Activities: The industry has witnessed significant M&A activity in recent years. Examples include CHANEL's acquisition of Ballin (October 2020) and the joint venture between Prada and Zegna (June 2021). The full report details these and other M&A activities, including deal values, and their impact on market consolidation and innovation. These transactions signal a push towards vertical integration and control over supply chains. The total value of M&A deals in the period 2019-2024 is estimated at $xx Million.
Women's Non-Athletic Shoes Industry Trends & Insights
The global women's non-athletic footwear market exhibits robust growth, driven by several factors. A rising global population, increasing disposable incomes, and evolving fashion trends contribute to expanding market size. Technological advancements are also playing a significant role, with innovative materials, manufacturing processes, and design elements driving product differentiation and consumer demand. The market is projected to experience a CAGR of xx% during the forecast period (2025-2033), reaching a market value of $xx Million by 2033.
Consumer preferences are shifting towards more sustainable and ethically produced footwear. This trend is prompting brands to adopt eco-friendly materials and transparent supply chain practices. The increasing popularity of online shopping is transforming distribution channels, leading to greater market reach and accessibility for both established and emerging brands. The penetration of online channels in the market is estimated to reach xx% by 2033, significantly influencing the competitive landscape. Competitive dynamics are intense, with major players focusing on brand building, product innovation, and strategic partnerships to maintain market share. Price sensitivity varies across different market segments, impacting sales and profit margins.
Dominant Markets & Segments in Women's Non-Athletic Shoes Industry
The women's non-athletic footwear market shows regional variations in dominance. Key drivers behind regional dominance include economic policies, consumer spending patterns, and infrastructure development.
Leading Region: North America and Europe currently hold the largest market share, driven by high consumer spending and established brand presence. However, Asia-Pacific is experiencing rapid growth, fueled by rising disposable incomes and a burgeoning middle class.
Dominant Segments:
- By Type: Heels and pumps hold a significant market share, driven by their versatility and association with formal and special occasions. However, the flats and boots and shoes segments are also experiencing substantial growth, reflecting the increasing demand for comfort and everyday wear.
- By Distribution Channel: Offline channels (brick-and-mortar stores) still dominate the market, but online sales are growing at a faster rate.
- By Category: The premium segment commands higher average prices, reflecting the demand for luxury and high-quality products. However, the mass segment offers more accessible pricing and caters to a larger consumer base.
Key Drivers:
- Economic Policies: Government incentives for local manufacturing and consumer spending policies influence market growth in various regions.
- Infrastructure: Efficient logistics and distribution networks support the growth of online sales and overall market expansion.
Women's Non-Athletic Shoes Industry Product Developments
Recent product innovations focus on enhanced comfort, sustainable materials (e.g., recycled fabrics, plant-based leathers), and advanced manufacturing techniques (e.g., 3D printing). Companies are emphasizing versatility and style, catering to evolving consumer preferences. The integration of smart technologies, such as sensors for health monitoring or personalized fit adjustments, is also gaining traction. This combination of comfort, sustainability, and technological integration creates a strong competitive advantage in a crowded marketplace.
Report Scope & Segmentation Analysis
This report delivers an in-depth and granular segmentation of the dynamic women's non-athletic footwear market, providing actionable insights for stakeholders. Our comprehensive analysis breaks down the market into key segments:
- By Type: Our detailed breakdown includes Boots and Shoes (encompassing ankle boots, knee-high boots, loafers, oxfords, etc.), Heels and Pumps (including stilettos, block heels, wedges, and classic pumps), Flats (such as ballet flats, loafers, espadrilles, and moccasins), Sandals (ranging from casual flip-flops to dressy heeled sandals), and Other Footwear Types (including slippers, clogs, and novelty footwear). Each sub-segment is meticulously analyzed for its current market size, projected growth rates, key consumer trends, and the competitive strategies employed by prominent brands within that specific niche.
- By Distribution Channel: We critically examine the prevailing distribution channels, dividing them into Online and Offline. The online segment encompasses e-commerce platforms, direct-to-consumer (DTC) websites, and online marketplaces, while the offline segment includes brick-and-mortar retail stores (department stores, specialty boutiques, brand-owned stores) and wholesale distribution. The analysis delves into the accelerating growth trajectory of e-commerce, its profound impact on market dynamics, the evolving consumer purchasing journey, and the innovative strategies being adopted by leading players to optimize their omnichannel presence and customer engagement across both digital and physical realms.
- By Category: This segmentation focuses on the distinct market dynamics of the Mass and Premium categories. We explore the differing price points, the specific demographics and psychographics of target consumers, and the unique product attributes, materials, and craftsmanship that define each category. The analysis considers the current market share, anticipated future growth, and the strategic positioning of brands within both the accessible mass market and the discerning premium segment, highlighting opportunities for innovation and market penetration.
Key Drivers of Women's Non-Athletic Shoes Industry Growth
Several factors propel the growth of this industry. Rising disposable incomes, especially in emerging markets, significantly boost consumer spending on footwear. Evolving fashion trends and increasing preference for diverse styles continually fuel market demand. Technological advancements in materials, design, and manufacturing processes contribute to product innovation and efficiency. Furthermore, the growing online retail sector expands access to a wider customer base.
Challenges in the Women's Non-Athletic Shoes Industry Sector
The industry faces challenges including fluctuating raw material prices, impacting production costs and profitability. Intense competition and the rise of private labels pressure profit margins. Supply chain disruptions, particularly with global events, pose risks to production and delivery. Stringent environmental regulations impose compliance costs and necessitate sustainable practices.
Emerging Opportunities in Women's Non-Athletic Shoes Industry
Emerging opportunities exist in sustainable and ethically sourced footwear, capitalizing on growing consumer awareness and demand. The increasing adoption of personalized footwear solutions based on individual needs and preferences represents a promising growth area. Expanding into new markets and exploring innovative distribution channels, such as pop-up stores and strategic partnerships, further open avenues for growth.
Leading Players in the Women's Non-Athletic Shoes Industry Market
- The ALDO Group Inc
- Bata Corporation
- Tapestry Inc
- Kering
- LVMH
- Capri Holdings
- Prada SpA
- LIR SRL
- CHANEL
- VF Corporation
Key Developments in Women's Non-Athletic Shoes Industry
- June 2021: Louis Vuitton launched the LV Squad sneaker and LV Sunset mule footwear campaign featuring Emma Chamberlain and Charli D'Amelio, expanding its reach to younger consumers.
- June 2021: Prada SPA and Ermenegildo Zegna acquired a 40% stake each in Filati Biagioli Modesto SPA, aiming for greater control over the cashmere supply chain, enhancing product quality and reducing reliance on external suppliers.
- October 2020: CHANEL acquired a majority stake in Italian Shoemaker Ballin, strengthening its supply chain for footwear manufacturing and product consistency.
Strategic Outlook for Women's Non-Athletic Shoes Industry Market
The women's non-athletic footwear market is poised for sustained growth, driven by consumer preference shifts, technological innovation, and the ongoing expansion of e-commerce. Strategic investments in sustainable practices, innovative designs, and personalized experiences will be crucial for success. Companies that effectively adapt to evolving consumer demands and navigate the complexities of global supply chains are likely to capture significant market share in the years to come.
Women Non Athletic Shoes Industry Segmentation
-
1. Type
- 1.1. Boots and Shoes
- 1.2. Heels and Pumps
- 1.3. Flats
- 1.4. Sandals
- 1.5. Other Footwear Types
-
2. Distribution Channel
- 2.1. Online
- 2.2. Offline
-
3. Category
- 3.1. Mass
- 3.2. Premium
Women Non Athletic Shoes Industry Segmentation By Geography
-
1. North America
- 1.1. United States
- 1.2. Canada
- 1.3. Rest of North America
-
2. Europe
- 2.1. Spain
- 2.2. United Kingdom
- 2.3. Germany
- 2.4. France
- 2.5. Italy
- 2.6. Rest of Europe
-
3. Asia Pacific
- 3.1. China
- 3.2. Japan
- 3.3. India
- 3.4. Australia
- 3.5. Rest of Asia Pacific
-
4. South America
- 4.1. Brazil
- 4.2. Argentina
- 4.3. Rest of South America
-
5. Middle East and Africa
- 5.1. South Africa
- 5.2. Saudi Arabia
- 5.3. Rest of Middle East and Africa
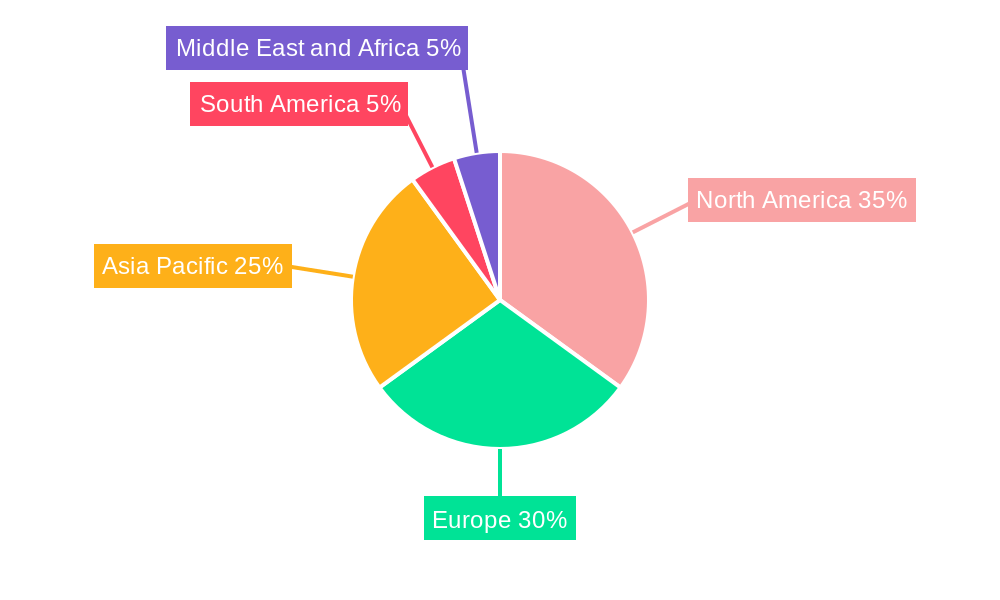
Women Non Athletic Shoes Industry Regional Market Share
Geographic Coverage of Women Non Athletic Shoes Industry
Women Non Athletic Shoes Industry REPORT HIGHLIGHTS
| Aspects | Details |
|---|---|
| Study Period | 2020-2034 |
| Base Year | 2025 |
| Estimated Year | 2026 |
| Forecast Period | 2026-2034 |
| Historical Period | 2020-2025 |
| Growth Rate | CAGR of 3.68% from 2020-2034 |
| Segmentation |
|
Table of Contents
- 1. Introduction
- 1.1. Research Scope
- 1.2. Market Segmentation
- 1.3. Research Objective
- 1.4. Definitions and Assumptions
- 2. Executive Summary
- 2.1. Market Snapshot
- 3. Market Dynamics
- 3.1. Market Drivers
- 3.2. Market Restrains
- 3.3. Market Trends
- 3.4. Market Opportunities
- 4. Market Factor Analysis
- 4.1. Porters Five Forces
- 4.1.1. Bargaining Power of Suppliers
- 4.1.2. Bargaining Power of Buyers
- 4.1.3. Threat of New Entrants
- 4.1.4. Threat of Substitutes
- 4.1.5. Competitive Rivalry
- 4.2. PESTEL analysis
- 4.3. BCG Analysis
- 4.3.1. Stars (High Growth, High Market Share)
- 4.3.2. Cash Cows (Low Growth, High Market Share)
- 4.3.3. Question Mark (High Growth, Low Market Share)
- 4.3.4. Dogs (Low Growth, Low Market Share)
- 4.4. Ansoff Matrix Analysis
- 4.5. Supply Chain Analysis
- 4.6. Regulatory Landscape
- 4.7. Current Market Potential and Opportunity Assessment (TAM–SAM–SOM Framework)
- 4.8. RAX Analyst Note
- 4.1. Porters Five Forces
- 5. Market Analysis, Insights and Forecast 2021-2033
- 5.1. Market Analysis, Insights and Forecast - by Type
- 5.1.1. Boots and Shoes
- 5.1.2. Heels and Pumps
- 5.1.3. Flats
- 5.1.4. Sandals
- 5.1.5. Other Footwear Types
- 5.2. Market Analysis, Insights and Forecast - by Distribution Channel
- 5.2.1. Online
- 5.2.2. Offline
- 5.3. Market Analysis, Insights and Forecast - by Category
- 5.3.1. Mass
- 5.3.2. Premium
- 5.4. Market Analysis, Insights and Forecast - by Region
- 5.4.1. North America
- 5.4.2. Europe
- 5.4.3. Asia Pacific
- 5.4.4. South America
- 5.4.5. Middle East and Africa
- 5.1. Market Analysis, Insights and Forecast - by Type
- 6. Global Women Non Athletic Shoes Industry Analysis, Insights and Forecast, 2021-2033
- 6.1. Market Analysis, Insights and Forecast - by Type
- 6.1.1. Boots and Shoes
- 6.1.2. Heels and Pumps
- 6.1.3. Flats
- 6.1.4. Sandals
- 6.1.5. Other Footwear Types
- 6.2. Market Analysis, Insights and Forecast - by Distribution Channel
- 6.2.1. Online
- 6.2.2. Offline
- 6.3. Market Analysis, Insights and Forecast - by Category
- 6.3.1. Mass
- 6.3.2. Premium
- 6.1. Market Analysis, Insights and Forecast - by Type
- 7. North America Women Non Athletic Shoes Industry Analysis, Insights and Forecast, 2020-2032
- 7.1. Market Analysis, Insights and Forecast - by Type
- 7.1.1. Boots and Shoes
- 7.1.2. Heels and Pumps
- 7.1.3. Flats
- 7.1.4. Sandals
- 7.1.5. Other Footwear Types
- 7.2. Market Analysis, Insights and Forecast - by Distribution Channel
- 7.2.1. Online
- 7.2.2. Offline
- 7.3. Market Analysis, Insights and Forecast - by Category
- 7.3.1. Mass
- 7.3.2. Premium
- 7.1. Market Analysis, Insights and Forecast - by Type
- 8. Europe Women Non Athletic Shoes Industry Analysis, Insights and Forecast, 2020-2032
- 8.1. Market Analysis, Insights and Forecast - by Type
- 8.1.1. Boots and Shoes
- 8.1.2. Heels and Pumps
- 8.1.3. Flats
- 8.1.4. Sandals
- 8.1.5. Other Footwear Types
- 8.2. Market Analysis, Insights and Forecast - by Distribution Channel
- 8.2.1. Online
- 8.2.2. Offline
- 8.3. Market Analysis, Insights and Forecast - by Category
- 8.3.1. Mass
- 8.3.2. Premium
- 8.1. Market Analysis, Insights and Forecast - by Type
- 9. Asia Pacific Women Non Athletic Shoes Industry Analysis, Insights and Forecast, 2020-2032
- 9.1. Market Analysis, Insights and Forecast - by Type
- 9.1.1. Boots and Shoes
- 9.1.2. Heels and Pumps
- 9.1.3. Flats
- 9.1.4. Sandals
- 9.1.5. Other Footwear Types
- 9.2. Market Analysis, Insights and Forecast - by Distribution Channel
- 9.2.1. Online
- 9.2.2. Offline
- 9.3. Market Analysis, Insights and Forecast - by Category
- 9.3.1. Mass
- 9.3.2. Premium
- 9.1. Market Analysis, Insights and Forecast - by Type
- 10. South America Women Non Athletic Shoes Industry Analysis, Insights and Forecast, 2020-2032
- 10.1. Market Analysis, Insights and Forecast - by Type
- 10.1.1. Boots and Shoes
- 10.1.2. Heels and Pumps
- 10.1.3. Flats
- 10.1.4. Sandals
- 10.1.5. Other Footwear Types
- 10.2. Market Analysis, Insights and Forecast - by Distribution Channel
- 10.2.1. Online
- 10.2.2. Offline
- 10.3. Market Analysis, Insights and Forecast - by Category
- 10.3.1. Mass
- 10.3.2. Premium
- 10.1. Market Analysis, Insights and Forecast - by Type
- 11. Middle East and Africa Women Non Athletic Shoes Industry Analysis, Insights and Forecast, 2020-2032
- 11.1. Market Analysis, Insights and Forecast - by Type
- 11.1.1. Boots and Shoes
- 11.1.2. Heels and Pumps
- 11.1.3. Flats
- 11.1.4. Sandals
- 11.1.5. Other Footwear Types
- 11.2. Market Analysis, Insights and Forecast - by Distribution Channel
- 11.2.1. Online
- 11.2.2. Offline
- 11.3. Market Analysis, Insights and Forecast - by Category
- 11.3.1. Mass
- 11.3.2. Premium
- 11.1. Market Analysis, Insights and Forecast - by Type
- 12. Competitive Analysis
- 12.1. Company Profiles
- 12.1.1 The ALDO Group Inc
- 12.1.1.1. Company Overview
- 12.1.1.2. Products
- 12.1.1.3. Company Financials
- 12.1.1.4. SWOT Analysis
- 12.1.2 Bata Corporation
- 12.1.2.1. Company Overview
- 12.1.2.2. Products
- 12.1.2.3. Company Financials
- 12.1.2.4. SWOT Analysis
- 12.1.3 Tapestry Inc
- 12.1.3.1. Company Overview
- 12.1.3.2. Products
- 12.1.3.3. Company Financials
- 12.1.3.4. SWOT Analysis
- 12.1.4 Kering
- 12.1.4.1. Company Overview
- 12.1.4.2. Products
- 12.1.4.3. Company Financials
- 12.1.4.4. SWOT Analysis
- 12.1.5 LVMH
- 12.1.5.1. Company Overview
- 12.1.5.2. Products
- 12.1.5.3. Company Financials
- 12.1.5.4. SWOT Analysis
- 12.1.6 Capri Holdings
- 12.1.6.1. Company Overview
- 12.1.6.2. Products
- 12.1.6.3. Company Financials
- 12.1.6.4. SWOT Analysis
- 12.1.7 Prada SpA
- 12.1.7.1. Company Overview
- 12.1.7.2. Products
- 12.1.7.3. Company Financials
- 12.1.7.4. SWOT Analysis
- 12.1.8 LIR SRL
- 12.1.8.1. Company Overview
- 12.1.8.2. Products
- 12.1.8.3. Company Financials
- 12.1.8.4. SWOT Analysis
- 12.1.9 CHANEL
- 12.1.9.1. Company Overview
- 12.1.9.2. Products
- 12.1.9.3. Company Financials
- 12.1.9.4. SWOT Analysis
- 12.1.10 VF Corporation*List Not Exhaustive
- 12.1.10.1. Company Overview
- 12.1.10.2. Products
- 12.1.10.3. Company Financials
- 12.1.10.4. SWOT Analysis
- 12.1.1 The ALDO Group Inc
- 12.2. Market Entropy
- 12.2.1 Company's Key Areas Served
- 12.2.2 Recent Developments
- 12.3. Company Market Share Analysis 2025
- 12.3.1 Top 5 Companies Market Share Analysis
- 12.3.2 Top 3 Companies Market Share Analysis
- 12.4. List of Potential Customers
- 13. Research Methodology
List of Figures
- Figure 1: Global Women Non Athletic Shoes Industry Revenue Breakdown (Million, %) by Region 2025 & 2033
- Figure 2: Global Women Non Athletic Shoes Industry Volume Breakdown (K Units, %) by Region 2025 & 2033
- Figure 3: North America Women Non Athletic Shoes Industry Revenue (Million), by Type 2025 & 2033
- Figure 4: North America Women Non Athletic Shoes Industry Volume (K Units), by Type 2025 & 2033
- Figure 5: North America Women Non Athletic Shoes Industry Revenue Share (%), by Type 2025 & 2033
- Figure 6: North America Women Non Athletic Shoes Industry Volume Share (%), by Type 2025 & 2033
- Figure 7: North America Women Non Athletic Shoes Industry Revenue (Million), by Distribution Channel 2025 & 2033
- Figure 8: North America Women Non Athletic Shoes Industry Volume (K Units), by Distribution Channel 2025 & 2033
- Figure 9: North America Women Non Athletic Shoes Industry Revenue Share (%), by Distribution Channel 2025 & 2033
- Figure 10: North America Women Non Athletic Shoes Industry Volume Share (%), by Distribution Channel 2025 & 2033
- Figure 11: North America Women Non Athletic Shoes Industry Revenue (Million), by Category 2025 & 2033
- Figure 12: North America Women Non Athletic Shoes Industry Volume (K Units), by Category 2025 & 2033
- Figure 13: North America Women Non Athletic Shoes Industry Revenue Share (%), by Category 2025 & 2033
- Figure 14: North America Women Non Athletic Shoes Industry Volume Share (%), by Category 2025 & 2033
- Figure 15: North America Women Non Athletic Shoes Industry Revenue (Million), by Country 2025 & 2033
- Figure 16: North America Women Non Athletic Shoes Industry Volume (K Units), by Country 2025 & 2033
- Figure 17: North America Women Non Athletic Shoes Industry Revenue Share (%), by Country 2025 & 2033
- Figure 18: North America Women Non Athletic Shoes Industry Volume Share (%), by Country 2025 & 2033
- Figure 19: Europe Women Non Athletic Shoes Industry Revenue (Million), by Type 2025 & 2033
- Figure 20: Europe Women Non Athletic Shoes Industry Volume (K Units), by Type 2025 & 2033
- Figure 21: Europe Women Non Athletic Shoes Industry Revenue Share (%), by Type 2025 & 2033
- Figure 22: Europe Women Non Athletic Shoes Industry Volume Share (%), by Type 2025 & 2033
- Figure 23: Europe Women Non Athletic Shoes Industry Revenue (Million), by Distribution Channel 2025 & 2033
- Figure 24: Europe Women Non Athletic Shoes Industry Volume (K Units), by Distribution Channel 2025 & 2033
- Figure 25: Europe Women Non Athletic Shoes Industry Revenue Share (%), by Distribution Channel 2025 & 2033
- Figure 26: Europe Women Non Athletic Shoes Industry Volume Share (%), by Distribution Channel 2025 & 2033
- Figure 27: Europe Women Non Athletic Shoes Industry Revenue (Million), by Category 2025 & 2033
- Figure 28: Europe Women Non Athletic Shoes Industry Volume (K Units), by Category 2025 & 2033
- Figure 29: Europe Women Non Athletic Shoes Industry Revenue Share (%), by Category 2025 & 2033
- Figure 30: Europe Women Non Athletic Shoes Industry Volume Share (%), by Category 2025 & 2033
- Figure 31: Europe Women Non Athletic Shoes Industry Revenue (Million), by Country 2025 & 2033
- Figure 32: Europe Women Non Athletic Shoes Industry Volume (K Units), by Country 2025 & 2033
- Figure 33: Europe Women Non Athletic Shoes Industry Revenue Share (%), by Country 2025 & 2033
- Figure 34: Europe Women Non Athletic Shoes Industry Volume Share (%), by Country 2025 & 2033
- Figure 35: Asia Pacific Women Non Athletic Shoes Industry Revenue (Million), by Type 2025 & 2033
- Figure 36: Asia Pacific Women Non Athletic Shoes Industry Volume (K Units), by Type 2025 & 2033
- Figure 37: Asia Pacific Women Non Athletic Shoes Industry Revenue Share (%), by Type 2025 & 2033
- Figure 38: Asia Pacific Women Non Athletic Shoes Industry Volume Share (%), by Type 2025 & 2033
- Figure 39: Asia Pacific Women Non Athletic Shoes Industry Revenue (Million), by Distribution Channel 2025 & 2033
- Figure 40: Asia Pacific Women Non Athletic Shoes Industry Volume (K Units), by Distribution Channel 2025 & 2033
- Figure 41: Asia Pacific Women Non Athletic Shoes Industry Revenue Share (%), by Distribution Channel 2025 & 2033
- Figure 42: Asia Pacific Women Non Athletic Shoes Industry Volume Share (%), by Distribution Channel 2025 & 2033
- Figure 43: Asia Pacific Women Non Athletic Shoes Industry Revenue (Million), by Category 2025 & 2033
- Figure 44: Asia Pacific Women Non Athletic Shoes Industry Volume (K Units), by Category 2025 & 2033
- Figure 45: Asia Pacific Women Non Athletic Shoes Industry Revenue Share (%), by Category 2025 & 2033
- Figure 46: Asia Pacific Women Non Athletic Shoes Industry Volume Share (%), by Category 2025 & 2033
- Figure 47: Asia Pacific Women Non Athletic Shoes Industry Revenue (Million), by Country 2025 & 2033
- Figure 48: Asia Pacific Women Non Athletic Shoes Industry Volume (K Units), by Country 2025 & 2033
- Figure 49: Asia Pacific Women Non Athletic Shoes Industry Revenue Share (%), by Country 2025 & 2033
- Figure 50: Asia Pacific Women Non Athletic Shoes Industry Volume Share (%), by Country 2025 & 2033
- Figure 51: South America Women Non Athletic Shoes Industry Revenue (Million), by Type 2025 & 2033
- Figure 52: South America Women Non Athletic Shoes Industry Volume (K Units), by Type 2025 & 2033
- Figure 53: South America Women Non Athletic Shoes Industry Revenue Share (%), by Type 2025 & 2033
- Figure 54: South America Women Non Athletic Shoes Industry Volume Share (%), by Type 2025 & 2033
- Figure 55: South America Women Non Athletic Shoes Industry Revenue (Million), by Distribution Channel 2025 & 2033
- Figure 56: South America Women Non Athletic Shoes Industry Volume (K Units), by Distribution Channel 2025 & 2033
- Figure 57: South America Women Non Athletic Shoes Industry Revenue Share (%), by Distribution Channel 2025 & 2033
- Figure 58: South America Women Non Athletic Shoes Industry Volume Share (%), by Distribution Channel 2025 & 2033
- Figure 59: South America Women Non Athletic Shoes Industry Revenue (Million), by Category 2025 & 2033
- Figure 60: South America Women Non Athletic Shoes Industry Volume (K Units), by Category 2025 & 2033
- Figure 61: South America Women Non Athletic Shoes Industry Revenue Share (%), by Category 2025 & 2033
- Figure 62: South America Women Non Athletic Shoes Industry Volume Share (%), by Category 2025 & 2033
- Figure 63: South America Women Non Athletic Shoes Industry Revenue (Million), by Country 2025 & 2033
- Figure 64: South America Women Non Athletic Shoes Industry Volume (K Units), by Country 2025 & 2033
- Figure 65: South America Women Non Athletic Shoes Industry Revenue Share (%), by Country 2025 & 2033
- Figure 66: South America Women Non Athletic Shoes Industry Volume Share (%), by Country 2025 & 2033
- Figure 67: Middle East and Africa Women Non Athletic Shoes Industry Revenue (Million), by Type 2025 & 2033
- Figure 68: Middle East and Africa Women Non Athletic Shoes Industry Volume (K Units), by Type 2025 & 2033
- Figure 69: Middle East and Africa Women Non Athletic Shoes Industry Revenue Share (%), by Type 2025 & 2033
- Figure 70: Middle East and Africa Women Non Athletic Shoes Industry Volume Share (%), by Type 2025 & 2033
- Figure 71: Middle East and Africa Women Non Athletic Shoes Industry Revenue (Million), by Distribution Channel 2025 & 2033
- Figure 72: Middle East and Africa Women Non Athletic Shoes Industry Volume (K Units), by Distribution Channel 2025 & 2033
- Figure 73: Middle East and Africa Women Non Athletic Shoes Industry Revenue Share (%), by Distribution Channel 2025 & 2033
- Figure 74: Middle East and Africa Women Non Athletic Shoes Industry Volume Share (%), by Distribution Channel 2025 & 2033
- Figure 75: Middle East and Africa Women Non Athletic Shoes Industry Revenue (Million), by Category 2025 & 2033
- Figure 76: Middle East and Africa Women Non Athletic Shoes Industry Volume (K Units), by Category 2025 & 2033
- Figure 77: Middle East and Africa Women Non Athletic Shoes Industry Revenue Share (%), by Category 2025 & 2033
- Figure 78: Middle East and Africa Women Non Athletic Shoes Industry Volume Share (%), by Category 2025 & 2033
- Figure 79: Middle East and Africa Women Non Athletic Shoes Industry Revenue (Million), by Country 2025 & 2033
- Figure 80: Middle East and Africa Women Non Athletic Shoes Industry Volume (K Units), by Country 2025 & 2033
- Figure 81: Middle East and Africa Women Non Athletic Shoes Industry Revenue Share (%), by Country 2025 & 2033
- Figure 82: Middle East and Africa Women Non Athletic Shoes Industry Volume Share (%), by Country 2025 & 2033
List of Tables
- Table 1: Global Women Non Athletic Shoes Industry Revenue Million Forecast, by Type 2020 & 2033
- Table 2: Global Women Non Athletic Shoes Industry Volume K Units Forecast, by Type 2020 & 2033
- Table 3: Global Women Non Athletic Shoes Industry Revenue Million Forecast, by Distribution Channel 2020 & 2033
- Table 4: Global Women Non Athletic Shoes Industry Volume K Units Forecast, by Distribution Channel 2020 & 2033
- Table 5: Global Women Non Athletic Shoes Industry Revenue Million Forecast, by Category 2020 & 2033
- Table 6: Global Women Non Athletic Shoes Industry Volume K Units Forecast, by Category 2020 & 2033
- Table 7: Global Women Non Athletic Shoes Industry Revenue Million Forecast, by Region 2020 & 2033
- Table 8: Global Women Non Athletic Shoes Industry Volume K Units Forecast, by Region 2020 & 2033
- Table 9: Global Women Non Athletic Shoes Industry Revenue Million Forecast, by Type 2020 & 2033
- Table 10: Global Women Non Athletic Shoes Industry Volume K Units Forecast, by Type 2020 & 2033
- Table 11: Global Women Non Athletic Shoes Industry Revenue Million Forecast, by Distribution Channel 2020 & 2033
- Table 12: Global Women Non Athletic Shoes Industry Volume K Units Forecast, by Distribution Channel 2020 & 2033
- Table 13: Global Women Non Athletic Shoes Industry Revenue Million Forecast, by Category 2020 & 2033
- Table 14: Global Women Non Athletic Shoes Industry Volume K Units Forecast, by Category 2020 & 2033
- Table 15: Global Women Non Athletic Shoes Industry Revenue Million Forecast, by Country 2020 & 2033
- Table 16: Global Women Non Athletic Shoes Industry Volume K Units Forecast, by Country 2020 & 2033
- Table 17: United States Women Non Athletic Shoes Industry Revenue (Million) Forecast, by Application 2020 & 2033
- Table 18: United States Women Non Athletic Shoes Industry Volume (K Units) Forecast, by Application 2020 & 2033
- Table 19: Canada Women Non Athletic Shoes Industry Revenue (Million) Forecast, by Application 2020 & 2033
- Table 20: Canada Women Non Athletic Shoes Industry Volume (K Units) Forecast, by Application 2020 & 2033
- Table 21: Rest of North America Women Non Athletic Shoes Industry Revenue (Million) Forecast, by Application 2020 & 2033
- Table 22: Rest of North America Women Non Athletic Shoes Industry Volume (K Units) Forecast, by Application 2020 & 2033
- Table 23: Global Women Non Athletic Shoes Industry Revenue Million Forecast, by Type 2020 & 2033
- Table 24: Global Women Non Athletic Shoes Industry Volume K Units Forecast, by Type 2020 & 2033
- Table 25: Global Women Non Athletic Shoes Industry Revenue Million Forecast, by Distribution Channel 2020 & 2033
- Table 26: Global Women Non Athletic Shoes Industry Volume K Units Forecast, by Distribution Channel 2020 & 2033
- Table 27: Global Women Non Athletic Shoes Industry Revenue Million Forecast, by Category 2020 & 2033
- Table 28: Global Women Non Athletic Shoes Industry Volume K Units Forecast, by Category 2020 & 2033
- Table 29: Global Women Non Athletic Shoes Industry Revenue Million Forecast, by Country 2020 & 2033
- Table 30: Global Women Non Athletic Shoes Industry Volume K Units Forecast, by Country 2020 & 2033
- Table 31: Spain Women Non Athletic Shoes Industry Revenue (Million) Forecast, by Application 2020 & 2033
- Table 32: Spain Women Non Athletic Shoes Industry Volume (K Units) Forecast, by Application 2020 & 2033
- Table 33: United Kingdom Women Non Athletic Shoes Industry Revenue (Million) Forecast, by Application 2020 & 2033
- Table 34: United Kingdom Women Non Athletic Shoes Industry Volume (K Units) Forecast, by Application 2020 & 2033
- Table 35: Germany Women Non Athletic Shoes Industry Revenue (Million) Forecast, by Application 2020 & 2033
- Table 36: Germany Women Non Athletic Shoes Industry Volume (K Units) Forecast, by Application 2020 & 2033
- Table 37: France Women Non Athletic Shoes Industry Revenue (Million) Forecast, by Application 2020 & 2033
- Table 38: France Women Non Athletic Shoes Industry Volume (K Units) Forecast, by Application 2020 & 2033
- Table 39: Italy Women Non Athletic Shoes Industry Revenue (Million) Forecast, by Application 2020 & 2033
- Table 40: Italy Women Non Athletic Shoes Industry Volume (K Units) Forecast, by Application 2020 & 2033
- Table 41: Rest of Europe Women Non Athletic Shoes Industry Revenue (Million) Forecast, by Application 2020 & 2033
- Table 42: Rest of Europe Women Non Athletic Shoes Industry Volume (K Units) Forecast, by Application 2020 & 2033
- Table 43: Global Women Non Athletic Shoes Industry Revenue Million Forecast, by Type 2020 & 2033
- Table 44: Global Women Non Athletic Shoes Industry Volume K Units Forecast, by Type 2020 & 2033
- Table 45: Global Women Non Athletic Shoes Industry Revenue Million Forecast, by Distribution Channel 2020 & 2033
- Table 46: Global Women Non Athletic Shoes Industry Volume K Units Forecast, by Distribution Channel 2020 & 2033
- Table 47: Global Women Non Athletic Shoes Industry Revenue Million Forecast, by Category 2020 & 2033
- Table 48: Global Women Non Athletic Shoes Industry Volume K Units Forecast, by Category 2020 & 2033
- Table 49: Global Women Non Athletic Shoes Industry Revenue Million Forecast, by Country 2020 & 2033
- Table 50: Global Women Non Athletic Shoes Industry Volume K Units Forecast, by Country 2020 & 2033
- Table 51: China Women Non Athletic Shoes Industry Revenue (Million) Forecast, by Application 2020 & 2033
- Table 52: China Women Non Athletic Shoes Industry Volume (K Units) Forecast, by Application 2020 & 2033
- Table 53: Japan Women Non Athletic Shoes Industry Revenue (Million) Forecast, by Application 2020 & 2033
- Table 54: Japan Women Non Athletic Shoes Industry Volume (K Units) Forecast, by Application 2020 & 2033
- Table 55: India Women Non Athletic Shoes Industry Revenue (Million) Forecast, by Application 2020 & 2033
- Table 56: India Women Non Athletic Shoes Industry Volume (K Units) Forecast, by Application 2020 & 2033
- Table 57: Australia Women Non Athletic Shoes Industry Revenue (Million) Forecast, by Application 2020 & 2033
- Table 58: Australia Women Non Athletic Shoes Industry Volume (K Units) Forecast, by Application 2020 & 2033
- Table 59: Rest of Asia Pacific Women Non Athletic Shoes Industry Revenue (Million) Forecast, by Application 2020 & 2033
- Table 60: Rest of Asia Pacific Women Non Athletic Shoes Industry Volume (K Units) Forecast, by Application 2020 & 2033
- Table 61: Global Women Non Athletic Shoes Industry Revenue Million Forecast, by Type 2020 & 2033
- Table 62: Global Women Non Athletic Shoes Industry Volume K Units Forecast, by Type 2020 & 2033
- Table 63: Global Women Non Athletic Shoes Industry Revenue Million Forecast, by Distribution Channel 2020 & 2033
- Table 64: Global Women Non Athletic Shoes Industry Volume K Units Forecast, by Distribution Channel 2020 & 2033
- Table 65: Global Women Non Athletic Shoes Industry Revenue Million Forecast, by Category 2020 & 2033
- Table 66: Global Women Non Athletic Shoes Industry Volume K Units Forecast, by Category 2020 & 2033
- Table 67: Global Women Non Athletic Shoes Industry Revenue Million Forecast, by Country 2020 & 2033
- Table 68: Global Women Non Athletic Shoes Industry Volume K Units Forecast, by Country 2020 & 2033
- Table 69: Brazil Women Non Athletic Shoes Industry Revenue (Million) Forecast, by Application 2020 & 2033
- Table 70: Brazil Women Non Athletic Shoes Industry Volume (K Units) Forecast, by Application 2020 & 2033
- Table 71: Argentina Women Non Athletic Shoes Industry Revenue (Million) Forecast, by Application 2020 & 2033
- Table 72: Argentina Women Non Athletic Shoes Industry Volume (K Units) Forecast, by Application 2020 & 2033
- Table 73: Rest of South America Women Non Athletic Shoes Industry Revenue (Million) Forecast, by Application 2020 & 2033
- Table 74: Rest of South America Women Non Athletic Shoes Industry Volume (K Units) Forecast, by Application 2020 & 2033
- Table 75: Global Women Non Athletic Shoes Industry Revenue Million Forecast, by Type 2020 & 2033
- Table 76: Global Women Non Athletic Shoes Industry Volume K Units Forecast, by Type 2020 & 2033
- Table 77: Global Women Non Athletic Shoes Industry Revenue Million Forecast, by Distribution Channel 2020 & 2033
- Table 78: Global Women Non Athletic Shoes Industry Volume K Units Forecast, by Distribution Channel 2020 & 2033
- Table 79: Global Women Non Athletic Shoes Industry Revenue Million Forecast, by Category 2020 & 2033
- Table 80: Global Women Non Athletic Shoes Industry Volume K Units Forecast, by Category 2020 & 2033
- Table 81: Global Women Non Athletic Shoes Industry Revenue Million Forecast, by Country 2020 & 2033
- Table 82: Global Women Non Athletic Shoes Industry Volume K Units Forecast, by Country 2020 & 2033
- Table 83: South Africa Women Non Athletic Shoes Industry Revenue (Million) Forecast, by Application 2020 & 2033
- Table 84: South Africa Women Non Athletic Shoes Industry Volume (K Units) Forecast, by Application 2020 & 2033
- Table 85: Saudi Arabia Women Non Athletic Shoes Industry Revenue (Million) Forecast, by Application 2020 & 2033
- Table 86: Saudi Arabia Women Non Athletic Shoes Industry Volume (K Units) Forecast, by Application 2020 & 2033
- Table 87: Rest of Middle East and Africa Women Non Athletic Shoes Industry Revenue (Million) Forecast, by Application 2020 & 2033
- Table 88: Rest of Middle East and Africa Women Non Athletic Shoes Industry Volume (K Units) Forecast, by Application 2020 & 2033
Frequently Asked Questions
1. What is the projected Compound Annual Growth Rate (CAGR) of the Women Non Athletic Shoes Industry?
The projected CAGR is approximately 3.68%.
2. Which companies are prominent players in the Women Non Athletic Shoes Industry?
Key companies in the market include The ALDO Group Inc, Bata Corporation, Tapestry Inc, Kering, LVMH, Capri Holdings, Prada SpA, LIR SRL, CHANEL, VF Corporation*List Not Exhaustive.
3. What are the main segments of the Women Non Athletic Shoes Industry?
The market segments include Type, Distribution Channel, Category.
4. Can you provide details about the market size?
The market size is estimated to be USD 132.83 Million as of 2022.
5. What are some drivers contributing to market growth?
Fast Fashion Trend; Inflating Income Level of Individuals.
6. What are the notable trends driving market growth?
Emergence of E-Commerce.
7. Are there any restraints impacting market growth?
The Presence Of Counterfeit Products.
8. Can you provide examples of recent developments in the market?
In June 2021, Louis Vuitton collaborated with internet superstars Emma Chamberlain and Charli D'Amelio for the launch of the LV Squad sneaker and LV Sunset mule footwear campaign. The new footwear variants have been made available across the brand's stores and online websites.
9. What pricing options are available for accessing the report?
Pricing options include single-user, multi-user, and enterprise licenses priced at USD 4750, USD 5250, and USD 8750 respectively.
10. Is the market size provided in terms of value or volume?
The market size is provided in terms of value, measured in Million and volume, measured in K Units.
11. Are there any specific market keywords associated with the report?
Yes, the market keyword associated with the report is "Women Non Athletic Shoes Industry," which aids in identifying and referencing the specific market segment covered.
12. How do I determine which pricing option suits my needs best?
The pricing options vary based on user requirements and access needs. Individual users may opt for single-user licenses, while businesses requiring broader access may choose multi-user or enterprise licenses for cost-effective access to the report.
13. Are there any additional resources or data provided in the Women Non Athletic Shoes Industry report?
While the report offers comprehensive insights, it's advisable to review the specific contents or supplementary materials provided to ascertain if additional resources or data are available.
14. How can I stay updated on further developments or reports in the Women Non Athletic Shoes Industry?
To stay informed about further developments, trends, and reports in the Women Non Athletic Shoes Industry, consider subscribing to industry newsletters, following relevant companies and organizations, or regularly checking reputable industry news sources and publications.
Methodology
Step 1 - Identification of Relevant Samples Size from Population Database


Step 2 - Approaches for Defining Global Market Size (Value, Volume* & Price*)

Note*: In applicable scenarios
Step 3 - Data Sources
Primary Research
- Web Analytics
- Survey Reports
- Research Institute
- Latest Research Reports
- Opinion Leaders
Secondary Research
- Annual Reports
- White Paper
- Latest Press Release
- Industry Association
- Paid Database
- Investor Presentations

Step 4 - Data Triangulation
Involves using different sources of information in order to increase the validity of a study
These sources are likely to be stakeholders in a program - participants, other researchers, program staff, other community members, and so on.
Then we put all data in single framework & apply various statistical tools to find out the dynamic on the market.
During the analysis stage, feedback from the stakeholder groups would be compared to determine areas of agreement as well as areas of divergence