
Key Insights
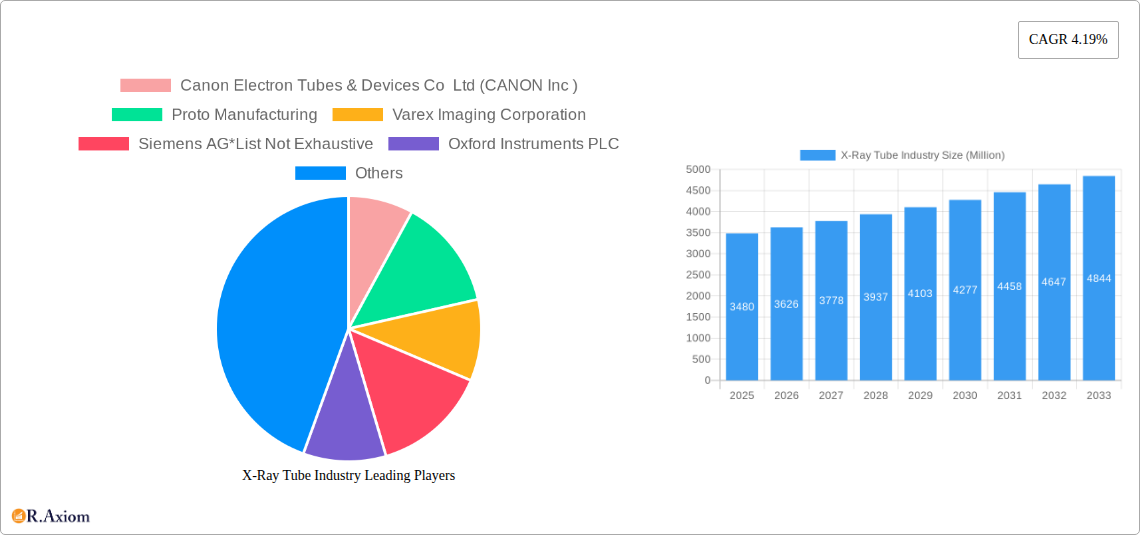
The X-ray tube market, valued at $3.48 billion in 2025, is projected to experience robust growth, driven by increasing demand across healthcare, manufacturing, and aerospace & defense sectors. The market's Compound Annual Growth Rate (CAGR) of 4.19% from 2025 to 2033 indicates a steady expansion, fueled by technological advancements leading to higher-resolution imaging and improved efficiency. The healthcare sector, encompassing diagnostics, radiotherapy, and medical imaging, remains the dominant end-user industry, contributing significantly to market revenue. Growing diagnostic procedures and the adoption of advanced X-ray systems in hospitals and clinics are key drivers. The manufacturing sector utilizes X-ray tubes for non-destructive testing (NDT), quality control, and process optimization, further boosting market growth. Advances in rotating anode technology are enhancing image quality and reducing examination time, while the development of miniaturized X-ray tubes is opening new applications in portable and handheld devices. Although regulatory hurdles and the high initial investment costs associated with advanced X-ray systems may pose some restraints, the overall market outlook remains positive, particularly with the increasing focus on preventative healthcare and the growing need for sophisticated inspection techniques in diverse industrial applications. The competitive landscape is marked by the presence of established players such as Canon, Varex Imaging, Siemens, and Philips, along with several specialized manufacturers. Continued innovation and strategic collaborations within this sector are expected to further shape the market's trajectory.
The segmentation within the X-ray tube market reveals significant opportunities. Rotating anode tubes, offering superior image quality and higher heat capacity, are expected to maintain a dominant market share. The stationary X-ray tube segment, while smaller, is witnessing growth driven by its suitability in specific applications requiring compact size and lower power consumption. Geographically, North America and Europe are currently major contributors, owing to high healthcare expenditure and established industrial infrastructure. However, rapid economic growth and expanding healthcare sectors in Asia Pacific, particularly in China and India, are expected to fuel significant regional market expansion in the coming years. The continued development and adoption of advanced imaging technologies, coupled with increasing investments in research and development, will propel the X-ray tube market to substantial growth over the forecast period.
This comprehensive report provides an in-depth analysis of the global X-ray tube industry, covering market size, segmentation, key players, growth drivers, challenges, and future outlook. The study period spans from 2019 to 2033, with 2025 serving as the base and estimated year. The report offers actionable insights for industry stakeholders, including manufacturers, investors, and researchers. The global market is projected to reach xx Million by 2033.
X-Ray Tube Industry Market Concentration & Innovation
The X-ray tube market exhibits a moderately concentrated structure, with several major players holding significant market share. While precise figures are proprietary, leading companies such as Canon Electron Tubes & Devices Co Ltd (CANON Inc), Varex Imaging Corporation, Siemens AG, Oxford Instruments PLC, Koninklijke Philips NV, and General Electric Company collectively account for a substantial portion (estimated at xx%) of the global market. This concentration is influenced by high barriers to entry, including substantial R&D investment, stringent regulatory approvals, and specialized manufacturing expertise.
Market innovation is driven by several factors:
- Technological advancements: Continuous improvements in X-ray tube technology, such as the development of microfocus X-ray tubes and advanced detector technologies, are expanding applications and improving image quality.
- Regulatory landscape: Stringent safety and performance standards necessitate continuous innovation to meet evolving requirements.
- End-user demand: The growing demand for advanced imaging solutions across various end-user industries, particularly healthcare and manufacturing, fuels innovation.
- Mergers and Acquisitions (M&A): Recent M&A activity, like Canon Medical Systems' acquisition of Nordisk Röntgen Teknik, demonstrates the strategic importance of consolidation and technology acquisition within the industry. These deals typically range from xx Million to xx Million in value, driving consolidation and technology integration.
X-Ray Tube Industry Trends & Insights
The X-ray tube market is experiencing robust growth, driven by several key trends:
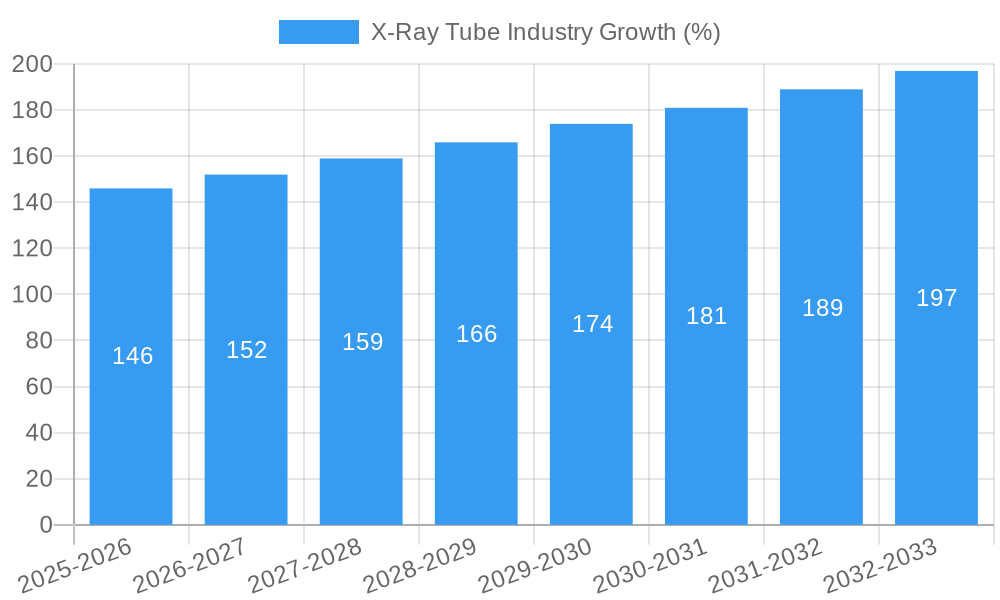
The market's Compound Annual Growth Rate (CAGR) during the forecast period (2025-2033) is estimated at xx%, exceeding the historical CAGR of xx% (2019-2024). This growth reflects the increasing adoption of X-ray technology across diverse sectors. The market penetration of X-ray tubes in emerging economies is also increasing, further contributing to market expansion. Technological advancements like the development of more efficient and compact X-ray tubes are transforming various industries. The shift towards digital X-ray systems and the integration of AI and machine learning into imaging systems are reshaping the competitive landscape. Consumer preference is steadily shifting toward higher resolution, faster imaging, and reduced radiation exposure. This drives continuous innovation in X-ray tube design and manufacturing. Increased competition among manufacturers results in improved product features and more competitive pricing, benefitting consumers.
Dominant Markets & Segments in X-Ray Tube Industry
The healthcare sector dominates the X-ray tube market, representing approximately xx% of the total market value in 2025. North America and Europe are currently leading regional markets, but Asia-Pacific is expected to experience the fastest growth in the coming years.
Key Drivers for Dominance:
- Healthcare: Expanding healthcare infrastructure, rising prevalence of chronic diseases, and increasing demand for advanced diagnostic imaging techniques drive growth.
- Manufacturing: Growth is propelled by stringent quality control requirements in industries such as automotive, electronics, and aerospace.
- Other End-user Industries: The adoption of X-ray technology in diverse sectors such as food processing and security is contributing to market expansion.
Segment-wise dominance analysis:
- Rotating Anode Tubes: Higher image quality and efficiency, leading to increased market share.
- Stationary X-Ray Tubes: Cost-effectiveness and suitability for specific applications maintain a significant market presence.
X-Ray Tube Industry Product Developments
Recent product launches highlight key technological trends, including miniaturization, enhanced image quality, and improved efficiency. Microfocus X-ray tubes, like those showcased by Viscom AG, offer increased flexibility and are suitable for a broader range of applications. The YXLON UX 50, optimized for industrial applications, represents the trend towards specialized solutions catering to specific industry requirements. These advancements improve market fit by addressing specific end-user needs, leading to a competitive advantage in the marketplace.
Report Scope & Segmentation Analysis
This report segments the X-Ray Tube market by type (Rotating Anode Tube and Stationary X-Ray Tube) and by end-user industry (Manufacturing, Healthcare, Food, Aerospace and Defense, and Other End-user Industries). Each segment is analyzed individually, with projections for market size and growth rate provided.
- Rotating Anode Tube: This segment is expected to grow at a CAGR of xx% during the forecast period due to its superior imaging capabilities.
- Stationary X-Ray Tube: This segment will exhibit a CAGR of xx% driven by its cost-effectiveness in specific applications.
- End-user industries: Each sector displays unique growth trajectories, driven by specific trends and technological adoption rates.
Key Drivers of X-Ray Tube Industry Growth
Several factors contribute to the X-ray tube market's growth: technological advancements (e.g., development of microfocus X-ray tubes and advanced detectors), rising demand for advanced diagnostic and industrial imaging, increasing healthcare spending globally, and stringent quality control requirements across manufacturing industries. Government regulations mandating advanced imaging technologies also create growth opportunities.
Challenges in the X-Ray Tube Industry Sector
The industry faces challenges such as stringent regulatory compliance requirements (e.g., radiation safety standards), supply chain disruptions impacting component availability and production costs, and intense competition among established players. These challenges lead to fluctuating market prices and require manufacturers to maintain agile production strategies.
Emerging Opportunities in X-Ray Tube Industry
Emerging opportunities lie in the development of portable and wireless X-ray systems, integration of AI and machine learning for enhanced image analysis, expansion into emerging markets, and the development of specialized X-ray tubes for niche applications. Focus on sustainable manufacturing practices and eco-friendly materials is also a growing opportunity.
Leading Players in the X-Ray Tube Industry Market
- Canon Electron Tubes & Devices Co Ltd (CANON Inc)
- Proto Manufacturing
- Varex Imaging Corporation
- Siemens AG
- Oxford Instruments PLC
- Koninklijke Philips NV
- Lafco India Scientific Industries
- YXLON International
- Comet Group
- General Electric Company
- Malvern Panalytical Ltd
Key Developments in X-Ray Tube Industry Industry
- February 2022: YXLON International launched the YXLON UX 50, a new X-ray tube specifically designed for the automotive and foundry industries.
- March 2022: Canon Medical Systems acquired Nordisk Röntgen Teknik (NRT), strengthening its position in the global X-ray market.
- April 2022: Viscom AG showcased its latest microfocus X-ray tubes at Control in Stuttgart, Germany, highlighting advancements in flexibility and application range.
- June 2022: Siemens Healthineers launched the Symbia Pro.specta SPECT/CT system, featuring advanced imaging technologies.
These developments demonstrate the ongoing innovation and consolidation within the X-ray tube industry, impacting market competition and driving technological advancements.
Strategic Outlook for X-Ray Tube Industry Market
The X-ray tube market holds significant future potential, driven by continued technological advancements, increasing healthcare spending, and the expansion of applications across various industries. Strategic investments in R&D, strategic partnerships, and expansion into emerging markets are crucial for success in this dynamic market. The focus on miniaturization, enhanced imaging capabilities, and improved efficiency will continue to shape the industry's growth trajectory.
X-Ray Tube Industry Segmentation
-
1. Type
- 1.1. Rotating Anode Tube
- 1.2. Stationary X-Ray Tube
-
2. End-user Industry
- 2.1. Manufacturing
- 2.2. Healthcare
- 2.3. Food
- 2.4. Aerospace and Defense
- 2.5. Other End-user Industries
X-Ray Tube Industry Segmentation By Geography
-
1. North America
- 1.1. United States
- 1.2. Canada
-
2. Europe
- 2.1. United Kingdom
- 2.2. Germany
- 2.3. France
- 2.4. Rest of Europe
-
3. Asia Pacific
- 3.1. China
- 3.2. Japan
- 3.3. India
- 3.4. Rest of Asia Pacific
- 4. Rest of the World

X-Ray Tube Industry REPORT HIGHLIGHTS
| Aspects | Details |
|---|---|
| Study Period | 2019-2033 |
| Base Year | 2024 |
| Estimated Year | 2025 |
| Forecast Period | 2025-2033 |
| Historical Period | 2019-2024 |
| Growth Rate | CAGR of 4.19% from 2019-2033 |
| Segmentation |
|
Table of Contents
- 1. Introduction
- 1.1. Research Scope
- 1.2. Market Segmentation
- 1.3. Research Methodology
- 1.4. Definitions and Assumptions
- 2. Executive Summary
- 2.1. Introduction
- 3. Market Dynamics
- 3.1. Introduction
- 3.2. Market Drivers
- 3.2.1. Technological Advancements; Increasing Demand for Healthcare Diagnostics
- 3.3. Market Restrains
- 3.3.1. Stringent Regulations and Validatory Guidelines
- 3.4. Market Trends
- 3.4.1. Healthcare Sector Holds the Largest Market Share
- 4. Market Factor Analysis
- 4.1. Porters Five Forces
- 4.2. Supply/Value Chain
- 4.3. PESTEL analysis
- 4.4. Market Entropy
- 4.5. Patent/Trademark Analysis
- 5. Global X-Ray Tube Industry Analysis, Insights and Forecast, 2019-2031
- 5.1. Market Analysis, Insights and Forecast - by Type
- 5.1.1. Rotating Anode Tube
- 5.1.2. Stationary X-Ray Tube
- 5.2. Market Analysis, Insights and Forecast - by End-user Industry
- 5.2.1. Manufacturing
- 5.2.2. Healthcare
- 5.2.3. Food
- 5.2.4. Aerospace and Defense
- 5.2.5. Other End-user Industries
- 5.3. Market Analysis, Insights and Forecast - by Region
- 5.3.1. North America
- 5.3.2. Europe
- 5.3.3. Asia Pacific
- 5.3.4. Rest of the World
- 5.1. Market Analysis, Insights and Forecast - by Type
- 6. North America X-Ray Tube Industry Analysis, Insights and Forecast, 2019-2031
- 6.1. Market Analysis, Insights and Forecast - by Type
- 6.1.1. Rotating Anode Tube
- 6.1.2. Stationary X-Ray Tube
- 6.2. Market Analysis, Insights and Forecast - by End-user Industry
- 6.2.1. Manufacturing
- 6.2.2. Healthcare
- 6.2.3. Food
- 6.2.4. Aerospace and Defense
- 6.2.5. Other End-user Industries
- 6.1. Market Analysis, Insights and Forecast - by Type
- 7. Europe X-Ray Tube Industry Analysis, Insights and Forecast, 2019-2031
- 7.1. Market Analysis, Insights and Forecast - by Type
- 7.1.1. Rotating Anode Tube
- 7.1.2. Stationary X-Ray Tube
- 7.2. Market Analysis, Insights and Forecast - by End-user Industry
- 7.2.1. Manufacturing
- 7.2.2. Healthcare
- 7.2.3. Food
- 7.2.4. Aerospace and Defense
- 7.2.5. Other End-user Industries
- 7.1. Market Analysis, Insights and Forecast - by Type
- 8. Asia Pacific X-Ray Tube Industry Analysis, Insights and Forecast, 2019-2031
- 8.1. Market Analysis, Insights and Forecast - by Type
- 8.1.1. Rotating Anode Tube
- 8.1.2. Stationary X-Ray Tube
- 8.2. Market Analysis, Insights and Forecast - by End-user Industry
- 8.2.1. Manufacturing
- 8.2.2. Healthcare
- 8.2.3. Food
- 8.2.4. Aerospace and Defense
- 8.2.5. Other End-user Industries
- 8.1. Market Analysis, Insights and Forecast - by Type
- 9. Rest of the World X-Ray Tube Industry Analysis, Insights and Forecast, 2019-2031
- 9.1. Market Analysis, Insights and Forecast - by Type
- 9.1.1. Rotating Anode Tube
- 9.1.2. Stationary X-Ray Tube
- 9.2. Market Analysis, Insights and Forecast - by End-user Industry
- 9.2.1. Manufacturing
- 9.2.2. Healthcare
- 9.2.3. Food
- 9.2.4. Aerospace and Defense
- 9.2.5. Other End-user Industries
- 9.1. Market Analysis, Insights and Forecast - by Type
- 10. North America X-Ray Tube Industry Analysis, Insights and Forecast, 2019-2031
- 10.1. Market Analysis, Insights and Forecast - By Country/Sub-region
- 10.1.1 United States
- 10.1.2 Canada
- 11. Europe X-Ray Tube Industry Analysis, Insights and Forecast, 2019-2031
- 11.1. Market Analysis, Insights and Forecast - By Country/Sub-region
- 11.1.1 United Kingdom
- 11.1.2 Germany
- 11.1.3 France
- 11.1.4 Rest of Europe
- 12. Asia Pacific X-Ray Tube Industry Analysis, Insights and Forecast, 2019-2031
- 12.1. Market Analysis, Insights and Forecast - By Country/Sub-region
- 12.1.1 China
- 12.1.2 Japan
- 12.1.3 India
- 12.1.4 Rest of Asia Pacific
- 13. Rest of the World X-Ray Tube Industry Analysis, Insights and Forecast, 2019-2031
- 13.1. Market Analysis, Insights and Forecast - By Country/Sub-region
- 13.1.1.
- 14. Competitive Analysis
- 14.1. Global Market Share Analysis 2024
- 14.2. Company Profiles
- 14.2.1 Canon Electron Tubes & Devices Co Ltd (CANON Inc )
- 14.2.1.1. Overview
- 14.2.1.2. Products
- 14.2.1.3. SWOT Analysis
- 14.2.1.4. Recent Developments
- 14.2.1.5. Financials (Based on Availability)
- 14.2.2 Proto Manufacturing
- 14.2.2.1. Overview
- 14.2.2.2. Products
- 14.2.2.3. SWOT Analysis
- 14.2.2.4. Recent Developments
- 14.2.2.5. Financials (Based on Availability)
- 14.2.3 Varex Imaging Corporation
- 14.2.3.1. Overview
- 14.2.3.2. Products
- 14.2.3.3. SWOT Analysis
- 14.2.3.4. Recent Developments
- 14.2.3.5. Financials (Based on Availability)
- 14.2.4 Siemens AG*List Not Exhaustive
- 14.2.4.1. Overview
- 14.2.4.2. Products
- 14.2.4.3. SWOT Analysis
- 14.2.4.4. Recent Developments
- 14.2.4.5. Financials (Based on Availability)
- 14.2.5 Oxford Instruments PLC
- 14.2.5.1. Overview
- 14.2.5.2. Products
- 14.2.5.3. SWOT Analysis
- 14.2.5.4. Recent Developments
- 14.2.5.5. Financials (Based on Availability)
- 14.2.6 Koninklijke Philips NV
- 14.2.6.1. Overview
- 14.2.6.2. Products
- 14.2.6.3. SWOT Analysis
- 14.2.6.4. Recent Developments
- 14.2.6.5. Financials (Based on Availability)
- 14.2.7 Lafco India Scientific Industries
- 14.2.7.1. Overview
- 14.2.7.2. Products
- 14.2.7.3. SWOT Analysis
- 14.2.7.4. Recent Developments
- 14.2.7.5. Financials (Based on Availability)
- 14.2.8 YXLON International
- 14.2.8.1. Overview
- 14.2.8.2. Products
- 14.2.8.3. SWOT Analysis
- 14.2.8.4. Recent Developments
- 14.2.8.5. Financials (Based on Availability)
- 14.2.9 Comet Group
- 14.2.9.1. Overview
- 14.2.9.2. Products
- 14.2.9.3. SWOT Analysis
- 14.2.9.4. Recent Developments
- 14.2.9.5. Financials (Based on Availability)
- 14.2.10 General Electric Company
- 14.2.10.1. Overview
- 14.2.10.2. Products
- 14.2.10.3. SWOT Analysis
- 14.2.10.4. Recent Developments
- 14.2.10.5. Financials (Based on Availability)
- 14.2.11 Malvern Panalytical Ltd
- 14.2.11.1. Overview
- 14.2.11.2. Products
- 14.2.11.3. SWOT Analysis
- 14.2.11.4. Recent Developments
- 14.2.11.5. Financials (Based on Availability)
- 14.2.1 Canon Electron Tubes & Devices Co Ltd (CANON Inc )
List of Figures
- Figure 1: Global X-Ray Tube Industry Revenue Breakdown (Million, %) by Region 2024 & 2032
- Figure 2: North America X-Ray Tube Industry Revenue (Million), by Country 2024 & 2032
- Figure 3: North America X-Ray Tube Industry Revenue Share (%), by Country 2024 & 2032
- Figure 4: Europe X-Ray Tube Industry Revenue (Million), by Country 2024 & 2032
- Figure 5: Europe X-Ray Tube Industry Revenue Share (%), by Country 2024 & 2032
- Figure 6: Asia Pacific X-Ray Tube Industry Revenue (Million), by Country 2024 & 2032
- Figure 7: Asia Pacific X-Ray Tube Industry Revenue Share (%), by Country 2024 & 2032
- Figure 8: Rest of the World X-Ray Tube Industry Revenue (Million), by Country 2024 & 2032
- Figure 9: Rest of the World X-Ray Tube Industry Revenue Share (%), by Country 2024 & 2032
- Figure 10: North America X-Ray Tube Industry Revenue (Million), by Type 2024 & 2032
- Figure 11: North America X-Ray Tube Industry Revenue Share (%), by Type 2024 & 2032
- Figure 12: North America X-Ray Tube Industry Revenue (Million), by End-user Industry 2024 & 2032
- Figure 13: North America X-Ray Tube Industry Revenue Share (%), by End-user Industry 2024 & 2032
- Figure 14: North America X-Ray Tube Industry Revenue (Million), by Country 2024 & 2032
- Figure 15: North America X-Ray Tube Industry Revenue Share (%), by Country 2024 & 2032
- Figure 16: Europe X-Ray Tube Industry Revenue (Million), by Type 2024 & 2032
- Figure 17: Europe X-Ray Tube Industry Revenue Share (%), by Type 2024 & 2032
- Figure 18: Europe X-Ray Tube Industry Revenue (Million), by End-user Industry 2024 & 2032
- Figure 19: Europe X-Ray Tube Industry Revenue Share (%), by End-user Industry 2024 & 2032
- Figure 20: Europe X-Ray Tube Industry Revenue (Million), by Country 2024 & 2032
- Figure 21: Europe X-Ray Tube Industry Revenue Share (%), by Country 2024 & 2032
- Figure 22: Asia Pacific X-Ray Tube Industry Revenue (Million), by Type 2024 & 2032
- Figure 23: Asia Pacific X-Ray Tube Industry Revenue Share (%), by Type 2024 & 2032
- Figure 24: Asia Pacific X-Ray Tube Industry Revenue (Million), by End-user Industry 2024 & 2032
- Figure 25: Asia Pacific X-Ray Tube Industry Revenue Share (%), by End-user Industry 2024 & 2032
- Figure 26: Asia Pacific X-Ray Tube Industry Revenue (Million), by Country 2024 & 2032
- Figure 27: Asia Pacific X-Ray Tube Industry Revenue Share (%), by Country 2024 & 2032
- Figure 28: Rest of the World X-Ray Tube Industry Revenue (Million), by Type 2024 & 2032
- Figure 29: Rest of the World X-Ray Tube Industry Revenue Share (%), by Type 2024 & 2032
- Figure 30: Rest of the World X-Ray Tube Industry Revenue (Million), by End-user Industry 2024 & 2032
- Figure 31: Rest of the World X-Ray Tube Industry Revenue Share (%), by End-user Industry 2024 & 2032
- Figure 32: Rest of the World X-Ray Tube Industry Revenue (Million), by Country 2024 & 2032
- Figure 33: Rest of the World X-Ray Tube Industry Revenue Share (%), by Country 2024 & 2032
List of Tables
- Table 1: Global X-Ray Tube Industry Revenue Million Forecast, by Region 2019 & 2032
- Table 2: Global X-Ray Tube Industry Revenue Million Forecast, by Type 2019 & 2032
- Table 3: Global X-Ray Tube Industry Revenue Million Forecast, by End-user Industry 2019 & 2032
- Table 4: Global X-Ray Tube Industry Revenue Million Forecast, by Region 2019 & 2032
- Table 5: Global X-Ray Tube Industry Revenue Million Forecast, by Country 2019 & 2032
- Table 6: United States X-Ray Tube Industry Revenue (Million) Forecast, by Application 2019 & 2032
- Table 7: Canada X-Ray Tube Industry Revenue (Million) Forecast, by Application 2019 & 2032
- Table 8: Global X-Ray Tube Industry Revenue Million Forecast, by Country 2019 & 2032
- Table 9: United Kingdom X-Ray Tube Industry Revenue (Million) Forecast, by Application 2019 & 2032
- Table 10: Germany X-Ray Tube Industry Revenue (Million) Forecast, by Application 2019 & 2032
- Table 11: France X-Ray Tube Industry Revenue (Million) Forecast, by Application 2019 & 2032
- Table 12: Rest of Europe X-Ray Tube Industry Revenue (Million) Forecast, by Application 2019 & 2032
- Table 13: Global X-Ray Tube Industry Revenue Million Forecast, by Country 2019 & 2032
- Table 14: China X-Ray Tube Industry Revenue (Million) Forecast, by Application 2019 & 2032
- Table 15: Japan X-Ray Tube Industry Revenue (Million) Forecast, by Application 2019 & 2032
- Table 16: India X-Ray Tube Industry Revenue (Million) Forecast, by Application 2019 & 2032
- Table 17: Rest of Asia Pacific X-Ray Tube Industry Revenue (Million) Forecast, by Application 2019 & 2032
- Table 18: Global X-Ray Tube Industry Revenue Million Forecast, by Country 2019 & 2032
- Table 19: X-Ray Tube Industry Revenue (Million) Forecast, by Application 2019 & 2032
- Table 20: Global X-Ray Tube Industry Revenue Million Forecast, by Type 2019 & 2032
- Table 21: Global X-Ray Tube Industry Revenue Million Forecast, by End-user Industry 2019 & 2032
- Table 22: Global X-Ray Tube Industry Revenue Million Forecast, by Country 2019 & 2032
- Table 23: United States X-Ray Tube Industry Revenue (Million) Forecast, by Application 2019 & 2032
- Table 24: Canada X-Ray Tube Industry Revenue (Million) Forecast, by Application 2019 & 2032
- Table 25: Global X-Ray Tube Industry Revenue Million Forecast, by Type 2019 & 2032
- Table 26: Global X-Ray Tube Industry Revenue Million Forecast, by End-user Industry 2019 & 2032
- Table 27: Global X-Ray Tube Industry Revenue Million Forecast, by Country 2019 & 2032
- Table 28: United Kingdom X-Ray Tube Industry Revenue (Million) Forecast, by Application 2019 & 2032
- Table 29: Germany X-Ray Tube Industry Revenue (Million) Forecast, by Application 2019 & 2032
- Table 30: France X-Ray Tube Industry Revenue (Million) Forecast, by Application 2019 & 2032
- Table 31: Rest of Europe X-Ray Tube Industry Revenue (Million) Forecast, by Application 2019 & 2032
- Table 32: Global X-Ray Tube Industry Revenue Million Forecast, by Type 2019 & 2032
- Table 33: Global X-Ray Tube Industry Revenue Million Forecast, by End-user Industry 2019 & 2032
- Table 34: Global X-Ray Tube Industry Revenue Million Forecast, by Country 2019 & 2032
- Table 35: China X-Ray Tube Industry Revenue (Million) Forecast, by Application 2019 & 2032
- Table 36: Japan X-Ray Tube Industry Revenue (Million) Forecast, by Application 2019 & 2032
- Table 37: India X-Ray Tube Industry Revenue (Million) Forecast, by Application 2019 & 2032
- Table 38: Rest of Asia Pacific X-Ray Tube Industry Revenue (Million) Forecast, by Application 2019 & 2032
- Table 39: Global X-Ray Tube Industry Revenue Million Forecast, by Type 2019 & 2032
- Table 40: Global X-Ray Tube Industry Revenue Million Forecast, by End-user Industry 2019 & 2032
- Table 41: Global X-Ray Tube Industry Revenue Million Forecast, by Country 2019 & 2032
Frequently Asked Questions
1. What is the projected Compound Annual Growth Rate (CAGR) of the X-Ray Tube Industry?
The projected CAGR is approximately 4.19%.
2. Which companies are prominent players in the X-Ray Tube Industry?
Key companies in the market include Canon Electron Tubes & Devices Co Ltd (CANON Inc ), Proto Manufacturing, Varex Imaging Corporation, Siemens AG*List Not Exhaustive, Oxford Instruments PLC, Koninklijke Philips NV, Lafco India Scientific Industries, YXLON International, Comet Group, General Electric Company, Malvern Panalytical Ltd.
3. What are the main segments of the X-Ray Tube Industry?
The market segments include Type, End-user Industry.
4. Can you provide details about the market size?
The market size is estimated to be USD 3.48 Million as of 2022.
5. What are some drivers contributing to market growth?
Technological Advancements; Increasing Demand for Healthcare Diagnostics.
6. What are the notable trends driving market growth?
Healthcare Sector Holds the Largest Market Share.
7. Are there any restraints impacting market growth?
Stringent Regulations and Validatory Guidelines.
8. Can you provide examples of recent developments in the market?
June 2022: Siemens Healthineers introduced Symbia Pro.specta, a CE-marked and FDA-cleared single-photon emission computed tomography/computed tomography (SPECT/CT) system with advanced SPECT and CT imaging technologies.
9. What pricing options are available for accessing the report?
Pricing options include single-user, multi-user, and enterprise licenses priced at USD 4750, USD 5250, and USD 8750 respectively.
10. Is the market size provided in terms of value or volume?
The market size is provided in terms of value, measured in Million.
11. Are there any specific market keywords associated with the report?
Yes, the market keyword associated with the report is "X-Ray Tube Industry," which aids in identifying and referencing the specific market segment covered.
12. How do I determine which pricing option suits my needs best?
The pricing options vary based on user requirements and access needs. Individual users may opt for single-user licenses, while businesses requiring broader access may choose multi-user or enterprise licenses for cost-effective access to the report.
13. Are there any additional resources or data provided in the X-Ray Tube Industry report?
While the report offers comprehensive insights, it's advisable to review the specific contents or supplementary materials provided to ascertain if additional resources or data are available.
14. How can I stay updated on further developments or reports in the X-Ray Tube Industry?
To stay informed about further developments, trends, and reports in the X-Ray Tube Industry, consider subscribing to industry newsletters, following relevant companies and organizations, or regularly checking reputable industry news sources and publications.
Methodology
Step 1 - Identification of Relevant Samples Size from Population Database


Step 2 - Approaches for Defining Global Market Size (Value, Volume* & Price*)

Note*: In applicable scenarios
Step 3 - Data Sources
Primary Research
- Web Analytics
- Survey Reports
- Research Institute
- Latest Research Reports
- Opinion Leaders
Secondary Research
- Annual Reports
- White Paper
- Latest Press Release
- Industry Association
- Paid Database
- Investor Presentations

Step 4 - Data Triangulation
Involves using different sources of information in order to increase the validity of a study
These sources are likely to be stakeholders in a program - participants, other researchers, program staff, other community members, and so on.
Then we put all data in single framework & apply various statistical tools to find out the dynamic on the market.
During the analysis stage, feedback from the stakeholder groups would be compared to determine areas of agreement as well as areas of divergence


