
Key Insights
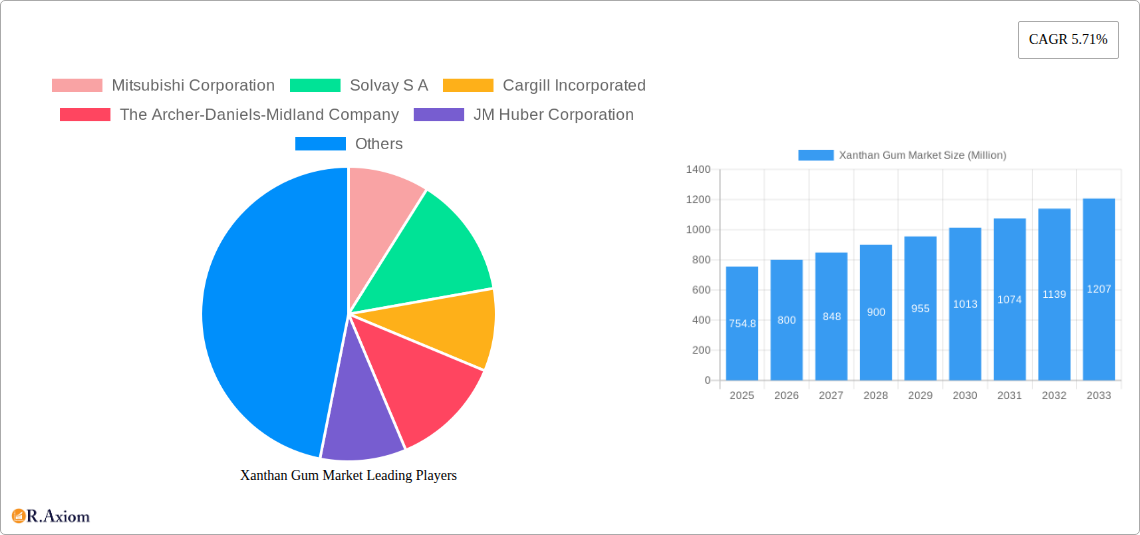
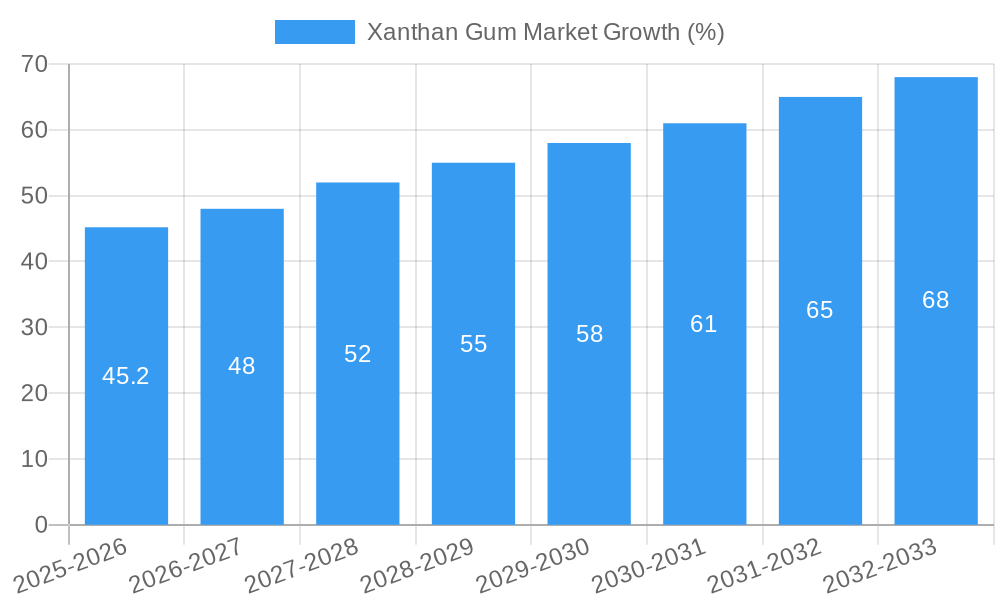
The global xanthan gum market, valued at $754.80 million in 2025, is projected to experience robust growth, driven by increasing demand across diverse sectors. The compound annual growth rate (CAGR) of 5.71% from 2025 to 2033 indicates a significant expansion, fueled by several key factors. The food and beverage industry remains a dominant application segment, leveraging xanthan gum's thickening and stabilizing properties in various products, from sauces and dressings to baked goods. The pharmaceutical and personal care sectors also contribute substantially, utilizing xanthan gum as a binder, stabilizer, and emulsifier in formulations. Growth in the oil refinery sector, where xanthan gum functions as a drilling fluid additive, further contributes to market expansion. Furthermore, emerging applications in other industries, such as cosmetics and industrial manufacturing, are expected to drive future growth. The market's segmentation by form (liquid and dry) also presents interesting dynamics, with liquid xanthan gum potentially witnessing faster growth due to its ease of use in certain applications. Major players, including Mitsubishi Corporation, Solvay S.A., and Cargill Incorporated, are actively shaping the market through innovation, strategic partnerships, and geographical expansion. While potential restraints such as price fluctuations of raw materials and regulatory compliance may exist, the overall market outlook remains positive, projecting significant market expansion throughout the forecast period.
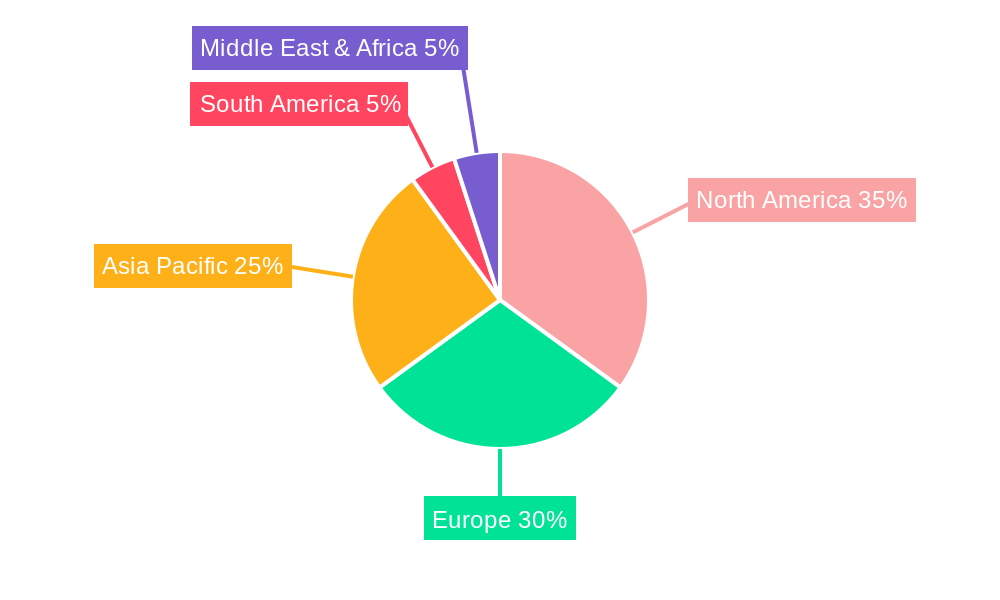
The geographical distribution reveals a diverse landscape, with North America and Europe currently holding significant market shares. However, the Asia-Pacific region, particularly China and India, is poised for substantial growth, driven by rising disposable incomes, increasing food processing activities, and expanding healthcare sectors. South America and the Middle East and Africa also offer considerable untapped potential, presenting attractive opportunities for market expansion. Competitive strategies among key players are likely to involve product diversification, expansion into new geographic markets, and research and development efforts focusing on innovative xanthan gum applications and improved production processes. This dynamic interplay of factors suggests a continually evolving and expanding xanthan gum market with significant opportunities for growth and innovation in the coming years.
Xanthan Gum Market: A Comprehensive Report (2019-2033)
This comprehensive report provides an in-depth analysis of the global xanthan gum market, offering invaluable insights for industry stakeholders, investors, and strategic decision-makers. Covering the period from 2019 to 2033, with a base year of 2025 and a forecast period of 2025-2033, this report dissects market trends, competitive dynamics, and future growth potential. The market is valued at xx Million in 2025 and is projected to reach xx Million by 2033, exhibiting a CAGR of xx% during the forecast period. Key players analyzed include Mitsubishi Corporation, Solvay S A, Cargill Incorporated, The Archer-Daniels-Midland Company, JM Huber Corporation, Foodchem International Corporation, Ingredion Incorporated, International Flavors & Fragrances Inc, Deosen Biochemical Ltd, and C E Roeper GmbH.
Xanthan Gum Market Market Concentration & Innovation
The xanthan gum market demonstrates a moderately concentrated structure, with a few major players holding significant market share. Mitsubishi Corporation, Cargill Incorporated, and Solvay S A are amongst the leading companies, collectively accounting for an estimated xx% of the global market in 2025. Innovation is driven by the development of novel xanthan gum variants with enhanced functionalities, such as improved viscosity, stability, and solubility. Regulatory frameworks, particularly those concerning food safety and labeling, significantly influence market dynamics. The presence of alternative thickening and stabilizing agents creates competitive pressure, while evolving end-user trends in food & beverage, pharmaceuticals, and personal care sectors are shaping product development. M&A activities, though not frequent, play a role in consolidating market share and expanding product portfolios. Recent M&A deal values have ranged from xx Million to xx Million, reflecting varying strategic objectives.
- Market Share: Top 3 players hold approximately xx% of the market (2025).
- Innovation Drivers: Enhanced functionalities, sustainability concerns, regulatory compliance.
- M&A Activity: Consolidation and expansion of product portfolios. Deal values vary significantly.
- Regulatory Landscape: Food safety and labeling regulations impacting product development and market access.
Xanthan Gum Market Industry Trends & Insights
The global xanthan gum market is experiencing robust growth, fueled by rising demand across diverse applications. The food and beverage industry remains the dominant segment, driven by increasing consumption of processed foods and beverages. Technological advancements in xanthan gum production are leading to improved efficiency and cost reductions. Consumer preferences for natural and clean-label ingredients are also impacting market dynamics, encouraging the development of xanthan gum derived from sustainable sources. Intense competition among established players and emerging market entrants necessitates continuous innovation and strategic partnerships to maintain market share. The market exhibits a growing trend towards customization and tailored solutions to meet the specific needs of different industries. Market penetration is particularly strong in developed economies, but growth opportunities exist in emerging markets as consumer spending and industrialization increase.
Dominant Markets & Segments in Xanthan Gum Market
The food and beverage segment is currently the dominant application for xanthan gum, accounting for approximately xx% of the market share in 2025. North America and Europe lead the regional market due to high consumption of processed foods and established personal care and pharmaceutical industries.
- Leading Region/Country: North America and Europe.
- Leading Segment (Application): Food and Beverages
- Leading Segment (Form): Dry
Key Drivers for Dominance:
- North America & Europe: High processed food consumption, robust pharmaceutical & personal care industries, advanced infrastructure.
- Food & Beverages: Increased demand for processed foods, functional foods, and beverages.
- Dry Form: Easier handling, storage, and transportation compared to liquid form.
The pharmaceuticals and personal care segments show significant growth potential, driven by increasing demand for specialized formulations and the need for natural thickening agents.
Xanthan Gum Market Product Developments
Recent product innovations focus on creating xanthan gum variants with improved functionalities. These advancements cater to specific application needs and enhance overall product performance. Companies are also emphasizing sustainable production methods and sourcing of raw materials to meet growing consumer demand for eco-friendly products. These developments enable companies to offer competitive advantages and expand their market reach. Technological trends include bio-based production and improved processing techniques to increase efficiency and reduce environmental impact.
Report Scope & Segmentation Analysis
This report segments the xanthan gum market based on form (liquid and dry) and application (food and beverages, pharmaceuticals, personal care and cosmetics, oil refinery, and other applications). Each segment's growth projections and market sizes are detailed, along with an analysis of the competitive landscape. The food and beverage sector is projected to exhibit the highest growth during the forecast period, while the dry form is anticipated to dominate the market in terms of volume due to its ease of handling.
- Form: Liquid and Dry (Dry form dominating market share).
- Application: Food and Beverages, Pharmaceuticals, Personal care and Cosmetics, Oil Refinery, Other Applications (Food and Beverage being largest).
Key Drivers of Xanthan Gum Market Growth
Several factors are driving the xanthan gum market's growth. The increasing demand for processed food and beverages is a primary driver, along with the rising popularity of functional foods and healthier alternatives. The pharmaceutical and personal care industries' growing need for natural thickening and stabilizing agents also fuels market expansion. Technological advancements in xanthan gum production, leading to improved efficiency and cost reduction, contribute significantly to market growth. Government regulations promoting the use of natural and sustainable ingredients further accelerate market expansion.
Challenges in the Xanthan Gum Market Sector
Fluctuations in raw material prices and supply chain disruptions pose significant challenges. Intense competition among existing players and the emergence of new entrants necessitates continuous innovation to maintain market share. Strict regulatory requirements regarding food safety and labeling can also hinder market growth. Concerns about the sustainability and environmental impact of xanthan gum production present further challenges for manufacturers. These factors can significantly impact market profitability and growth prospects.
Emerging Opportunities in Xanthan Gum Market
The rising demand for natural and organic ingredients creates substantial opportunities in the xanthan gum market. Expanding into emerging markets with high growth potential presents further opportunities. Innovation in product formulations for specific applications in industries like oil refining and bioremediation can unlock new revenue streams. Focus on sustainable production methods and eco-friendly packaging enhances the market appeal. These trends provide avenues for market expansion and growth.
Leading Players in the Xanthan Gum Market Market
- Mitsubishi Corporation
- Solvay S A
- Cargill Incorporated
- The Archer-Daniels-Midland Company
- JM Huber Corporation
- Foodchem International Corporation
- Ingredion Incorporated
- International Flavors & Fragrances Inc
- Deosen Biochemical Ltd
- C E Roeper GmbH
Key Developments in Xanthan Gum Market Industry
- November 2023: Mitsubishi Corporation Life Sciences Limited expanded its food ingredient product capacity by approximately 1,000 metric tons annually, signaling increased production capabilities and market competitiveness.
- October 2022: Cargill's partnership with the Singapore Economic Development Board (EDB) to launch a digital business studio indicates a strategic focus on innovation and market expansion in Asia.
- July 2022: CP Kelco's expansion of bio-gum production capacity, including xanthan gum, in the US and China highlights a significant investment to meet growing global demand.
Strategic Outlook for Xanthan Gum Market Market
The xanthan gum market is poised for continued growth driven by increasing demand across various sectors. Emerging markets and technological advancements in production methods present significant growth opportunities. Focus on sustainability and eco-friendly production is crucial for long-term market success. Strategic partnerships, product diversification, and continuous innovation will be key for companies to maintain a competitive edge and capitalize on the market's vast potential.
Xanthan Gum Market Segmentation
-
1. Form
- 1.1. Liquid
- 1.2. Dry
-
2. Application
-
2.1. Food and Beverages
- 2.1.1. Bakery Products
- 2.1.2. Confectionery
- 2.1.3. Meat Products
- 2.1.4. Frozen Food
- 2.1.5. Dairy Products
- 2.1.6. Others
- 2.2. Pharmaceuticals
- 2.3. Personal care and Cosmetics
- 2.4. Oil Refinery
- 2.5. Other Applications
-
2.1. Food and Beverages
Xanthan Gum Market Segmentation By Geography
-
1. North America
- 1.1. United States
- 1.2. Canada
- 1.3. Mexico
- 1.4. Rest of North America
-
2. Europe
- 2.1. Spain
- 2.2. United Kingdom
- 2.3. Germany
- 2.4. France
- 2.5. Italy
- 2.6. Russia
- 2.7. Rest of Europe
-
3. Asia Pacific
- 3.1. China
- 3.2. Japan
- 3.3. India
- 3.4. Australia
- 3.5. Rest of Asia Pacific
-
4. South America
- 4.1. Brazil
- 4.2. Argentina
- 4.3. Rest of South America
- 5. Middle East
-
6. South Africa
- 6.1. United Arab Emrates
- 6.2. Rest of Middle East and Africa
Xanthan Gum Market REPORT HIGHLIGHTS
| Aspects | Details |
|---|---|
| Study Period | 2019-2033 |
| Base Year | 2024 |
| Estimated Year | 2025 |
| Forecast Period | 2025-2033 |
| Historical Period | 2019-2024 |
| Growth Rate | CAGR of 5.71% from 2019-2033 |
| Segmentation |
|
Table of Contents
- 1. Introduction
- 1.1. Research Scope
- 1.2. Market Segmentation
- 1.3. Research Methodology
- 1.4. Definitions and Assumptions
- 2. Executive Summary
- 2.1. Introduction
- 3. Market Dynamics
- 3.1. Introduction
- 3.2. Market Drivers
- 3.2.1. Wide Applications and Functionality; Demand For Gluten-Free Products
- 3.3. Market Restrains
- 3.3.1. Easy Availability of Economically Feasible Alternatives
- 3.4. Market Trends
- 3.4.1. Food and Beverage Industry is the Biggest Consumer of Xanthan Gum
- 4. Market Factor Analysis
- 4.1. Porters Five Forces
- 4.2. Supply/Value Chain
- 4.3. PESTEL analysis
- 4.4. Market Entropy
- 4.5. Patent/Trademark Analysis
- 5. Global Xanthan Gum Market Analysis, Insights and Forecast, 2019-2031
- 5.1. Market Analysis, Insights and Forecast - by Form
- 5.1.1. Liquid
- 5.1.2. Dry
- 5.2. Market Analysis, Insights and Forecast - by Application
- 5.2.1. Food and Beverages
- 5.2.1.1. Bakery Products
- 5.2.1.2. Confectionery
- 5.2.1.3. Meat Products
- 5.2.1.4. Frozen Food
- 5.2.1.5. Dairy Products
- 5.2.1.6. Others
- 5.2.2. Pharmaceuticals
- 5.2.3. Personal care and Cosmetics
- 5.2.4. Oil Refinery
- 5.2.5. Other Applications
- 5.2.1. Food and Beverages
- 5.3. Market Analysis, Insights and Forecast - by Region
- 5.3.1. North America
- 5.3.2. Europe
- 5.3.3. Asia Pacific
- 5.3.4. South America
- 5.3.5. Middle East
- 5.3.6. South Africa
- 5.1. Market Analysis, Insights and Forecast - by Form
- 6. North America Xanthan Gum Market Analysis, Insights and Forecast, 2019-2031
- 6.1. Market Analysis, Insights and Forecast - by Form
- 6.1.1. Liquid
- 6.1.2. Dry
- 6.2. Market Analysis, Insights and Forecast - by Application
- 6.2.1. Food and Beverages
- 6.2.1.1. Bakery Products
- 6.2.1.2. Confectionery
- 6.2.1.3. Meat Products
- 6.2.1.4. Frozen Food
- 6.2.1.5. Dairy Products
- 6.2.1.6. Others
- 6.2.2. Pharmaceuticals
- 6.2.3. Personal care and Cosmetics
- 6.2.4. Oil Refinery
- 6.2.5. Other Applications
- 6.2.1. Food and Beverages
- 6.1. Market Analysis, Insights and Forecast - by Form
- 7. Europe Xanthan Gum Market Analysis, Insights and Forecast, 2019-2031
- 7.1. Market Analysis, Insights and Forecast - by Form
- 7.1.1. Liquid
- 7.1.2. Dry
- 7.2. Market Analysis, Insights and Forecast - by Application
- 7.2.1. Food and Beverages
- 7.2.1.1. Bakery Products
- 7.2.1.2. Confectionery
- 7.2.1.3. Meat Products
- 7.2.1.4. Frozen Food
- 7.2.1.5. Dairy Products
- 7.2.1.6. Others
- 7.2.2. Pharmaceuticals
- 7.2.3. Personal care and Cosmetics
- 7.2.4. Oil Refinery
- 7.2.5. Other Applications
- 7.2.1. Food and Beverages
- 7.1. Market Analysis, Insights and Forecast - by Form
- 8. Asia Pacific Xanthan Gum Market Analysis, Insights and Forecast, 2019-2031
- 8.1. Market Analysis, Insights and Forecast - by Form
- 8.1.1. Liquid
- 8.1.2. Dry
- 8.2. Market Analysis, Insights and Forecast - by Application
- 8.2.1. Food and Beverages
- 8.2.1.1. Bakery Products
- 8.2.1.2. Confectionery
- 8.2.1.3. Meat Products
- 8.2.1.4. Frozen Food
- 8.2.1.5. Dairy Products
- 8.2.1.6. Others
- 8.2.2. Pharmaceuticals
- 8.2.3. Personal care and Cosmetics
- 8.2.4. Oil Refinery
- 8.2.5. Other Applications
- 8.2.1. Food and Beverages
- 8.1. Market Analysis, Insights and Forecast - by Form
- 9. South America Xanthan Gum Market Analysis, Insights and Forecast, 2019-2031
- 9.1. Market Analysis, Insights and Forecast - by Form
- 9.1.1. Liquid
- 9.1.2. Dry
- 9.2. Market Analysis, Insights and Forecast - by Application
- 9.2.1. Food and Beverages
- 9.2.1.1. Bakery Products
- 9.2.1.2. Confectionery
- 9.2.1.3. Meat Products
- 9.2.1.4. Frozen Food
- 9.2.1.5. Dairy Products
- 9.2.1.6. Others
- 9.2.2. Pharmaceuticals
- 9.2.3. Personal care and Cosmetics
- 9.2.4. Oil Refinery
- 9.2.5. Other Applications
- 9.2.1. Food and Beverages
- 9.1. Market Analysis, Insights and Forecast - by Form
- 10. Middle East Xanthan Gum Market Analysis, Insights and Forecast, 2019-2031
- 10.1. Market Analysis, Insights and Forecast - by Form
- 10.1.1. Liquid
- 10.1.2. Dry
- 10.2. Market Analysis, Insights and Forecast - by Application
- 10.2.1. Food and Beverages
- 10.2.1.1. Bakery Products
- 10.2.1.2. Confectionery
- 10.2.1.3. Meat Products
- 10.2.1.4. Frozen Food
- 10.2.1.5. Dairy Products
- 10.2.1.6. Others
- 10.2.2. Pharmaceuticals
- 10.2.3. Personal care and Cosmetics
- 10.2.4. Oil Refinery
- 10.2.5. Other Applications
- 10.2.1. Food and Beverages
- 10.1. Market Analysis, Insights and Forecast - by Form
- 11. South Africa Xanthan Gum Market Analysis, Insights and Forecast, 2019-2031
- 11.1. Market Analysis, Insights and Forecast - by Form
- 11.1.1. Liquid
- 11.1.2. Dry
- 11.2. Market Analysis, Insights and Forecast - by Application
- 11.2.1. Food and Beverages
- 11.2.1.1. Bakery Products
- 11.2.1.2. Confectionery
- 11.2.1.3. Meat Products
- 11.2.1.4. Frozen Food
- 11.2.1.5. Dairy Products
- 11.2.1.6. Others
- 11.2.2. Pharmaceuticals
- 11.2.3. Personal care and Cosmetics
- 11.2.4. Oil Refinery
- 11.2.5. Other Applications
- 11.2.1. Food and Beverages
- 11.1. Market Analysis, Insights and Forecast - by Form
- 12. North America Xanthan Gum Market Analysis, Insights and Forecast, 2019-2031
- 12.1. Market Analysis, Insights and Forecast - By Country/Sub-region
- 12.1.1 United States
- 12.1.2 Canada
- 12.1.3 Mexico
- 12.1.4 Rest of North America
- 13. Europe Xanthan Gum Market Analysis, Insights and Forecast, 2019-2031
- 13.1. Market Analysis, Insights and Forecast - By Country/Sub-region
- 13.1.1 Spain
- 13.1.2 United Kingdom
- 13.1.3 Germany
- 13.1.4 France
- 13.1.5 Italy
- 13.1.6 Russia
- 13.1.7 Rest of Europe
- 14. Asia Pacific Xanthan Gum Market Analysis, Insights and Forecast, 2019-2031
- 14.1. Market Analysis, Insights and Forecast - By Country/Sub-region
- 14.1.1 China
- 14.1.2 Japan
- 14.1.3 India
- 14.1.4 Australia
- 14.1.5 Rest of Asia Pacific
- 15. South America Xanthan Gum Market Analysis, Insights and Forecast, 2019-2031
- 15.1. Market Analysis, Insights and Forecast - By Country/Sub-region
- 15.1.1 Brazil
- 15.1.2 Argentina
- 15.1.3 Rest of South America
- 16. South Africa Xanthan Gum Market Analysis, Insights and Forecast, 2019-2031
- 16.1. Market Analysis, Insights and Forecast - By Country/Sub-region
- 16.1.1 United Arab Emrates
- 16.1.2 Rest of Middle East and Africa
- 17. Competitive Analysis
- 17.1. Global Market Share Analysis 2024
- 17.2. Company Profiles
- 17.2.1 Mitsubishi Corporation
- 17.2.1.1. Overview
- 17.2.1.2. Products
- 17.2.1.3. SWOT Analysis
- 17.2.1.4. Recent Developments
- 17.2.1.5. Financials (Based on Availability)
- 17.2.2 Solvay S A
- 17.2.2.1. Overview
- 17.2.2.2. Products
- 17.2.2.3. SWOT Analysis
- 17.2.2.4. Recent Developments
- 17.2.2.5. Financials (Based on Availability)
- 17.2.3 Cargill Incorporated
- 17.2.3.1. Overview
- 17.2.3.2. Products
- 17.2.3.3. SWOT Analysis
- 17.2.3.4. Recent Developments
- 17.2.3.5. Financials (Based on Availability)
- 17.2.4 The Archer-Daniels-Midland Company
- 17.2.4.1. Overview
- 17.2.4.2. Products
- 17.2.4.3. SWOT Analysis
- 17.2.4.4. Recent Developments
- 17.2.4.5. Financials (Based on Availability)
- 17.2.5 JM Huber Corporation
- 17.2.5.1. Overview
- 17.2.5.2. Products
- 17.2.5.3. SWOT Analysis
- 17.2.5.4. Recent Developments
- 17.2.5.5. Financials (Based on Availability)
- 17.2.6 Foodchem International Corporation
- 17.2.6.1. Overview
- 17.2.6.2. Products
- 17.2.6.3. SWOT Analysis
- 17.2.6.4. Recent Developments
- 17.2.6.5. Financials (Based on Availability)
- 17.2.7 Ingredion Incorporated
- 17.2.7.1. Overview
- 17.2.7.2. Products
- 17.2.7.3. SWOT Analysis
- 17.2.7.4. Recent Developments
- 17.2.7.5. Financials (Based on Availability)
- 17.2.8 International Flavours and Fragrances Inc
- 17.2.8.1. Overview
- 17.2.8.2. Products
- 17.2.8.3. SWOT Analysis
- 17.2.8.4. Recent Developments
- 17.2.8.5. Financials (Based on Availability)
- 17.2.9 Deosen Biochemical Ltd
- 17.2.9.1. Overview
- 17.2.9.2. Products
- 17.2.9.3. SWOT Analysis
- 17.2.9.4. Recent Developments
- 17.2.9.5. Financials (Based on Availability)
- 17.2.10 C E Roeper GmbH
- 17.2.10.1. Overview
- 17.2.10.2. Products
- 17.2.10.3. SWOT Analysis
- 17.2.10.4. Recent Developments
- 17.2.10.5. Financials (Based on Availability)
- 17.2.1 Mitsubishi Corporation
List of Figures
- Figure 1: Global Xanthan Gum Market Revenue Breakdown (Million, %) by Region 2024 & 2032
- Figure 2: North America Xanthan Gum Market Revenue (Million), by Country 2024 & 2032
- Figure 3: North America Xanthan Gum Market Revenue Share (%), by Country 2024 & 2032
- Figure 4: Europe Xanthan Gum Market Revenue (Million), by Country 2024 & 2032
- Figure 5: Europe Xanthan Gum Market Revenue Share (%), by Country 2024 & 2032
- Figure 6: Asia Pacific Xanthan Gum Market Revenue (Million), by Country 2024 & 2032
- Figure 7: Asia Pacific Xanthan Gum Market Revenue Share (%), by Country 2024 & 2032
- Figure 8: South America Xanthan Gum Market Revenue (Million), by Country 2024 & 2032
- Figure 9: South America Xanthan Gum Market Revenue Share (%), by Country 2024 & 2032
- Figure 10: South Africa Xanthan Gum Market Revenue (Million), by Country 2024 & 2032
- Figure 11: South Africa Xanthan Gum Market Revenue Share (%), by Country 2024 & 2032
- Figure 12: North America Xanthan Gum Market Revenue (Million), by Form 2024 & 2032
- Figure 13: North America Xanthan Gum Market Revenue Share (%), by Form 2024 & 2032
- Figure 14: North America Xanthan Gum Market Revenue (Million), by Application 2024 & 2032
- Figure 15: North America Xanthan Gum Market Revenue Share (%), by Application 2024 & 2032
- Figure 16: North America Xanthan Gum Market Revenue (Million), by Country 2024 & 2032
- Figure 17: North America Xanthan Gum Market Revenue Share (%), by Country 2024 & 2032
- Figure 18: Europe Xanthan Gum Market Revenue (Million), by Form 2024 & 2032
- Figure 19: Europe Xanthan Gum Market Revenue Share (%), by Form 2024 & 2032
- Figure 20: Europe Xanthan Gum Market Revenue (Million), by Application 2024 & 2032
- Figure 21: Europe Xanthan Gum Market Revenue Share (%), by Application 2024 & 2032
- Figure 22: Europe Xanthan Gum Market Revenue (Million), by Country 2024 & 2032
- Figure 23: Europe Xanthan Gum Market Revenue Share (%), by Country 2024 & 2032
- Figure 24: Asia Pacific Xanthan Gum Market Revenue (Million), by Form 2024 & 2032
- Figure 25: Asia Pacific Xanthan Gum Market Revenue Share (%), by Form 2024 & 2032
- Figure 26: Asia Pacific Xanthan Gum Market Revenue (Million), by Application 2024 & 2032
- Figure 27: Asia Pacific Xanthan Gum Market Revenue Share (%), by Application 2024 & 2032
- Figure 28: Asia Pacific Xanthan Gum Market Revenue (Million), by Country 2024 & 2032
- Figure 29: Asia Pacific Xanthan Gum Market Revenue Share (%), by Country 2024 & 2032
- Figure 30: South America Xanthan Gum Market Revenue (Million), by Form 2024 & 2032
- Figure 31: South America Xanthan Gum Market Revenue Share (%), by Form 2024 & 2032
- Figure 32: South America Xanthan Gum Market Revenue (Million), by Application 2024 & 2032
- Figure 33: South America Xanthan Gum Market Revenue Share (%), by Application 2024 & 2032
- Figure 34: South America Xanthan Gum Market Revenue (Million), by Country 2024 & 2032
- Figure 35: South America Xanthan Gum Market Revenue Share (%), by Country 2024 & 2032
- Figure 36: Middle East Xanthan Gum Market Revenue (Million), by Form 2024 & 2032
- Figure 37: Middle East Xanthan Gum Market Revenue Share (%), by Form 2024 & 2032
- Figure 38: Middle East Xanthan Gum Market Revenue (Million), by Application 2024 & 2032
- Figure 39: Middle East Xanthan Gum Market Revenue Share (%), by Application 2024 & 2032
- Figure 40: Middle East Xanthan Gum Market Revenue (Million), by Country 2024 & 2032
- Figure 41: Middle East Xanthan Gum Market Revenue Share (%), by Country 2024 & 2032
- Figure 42: South Africa Xanthan Gum Market Revenue (Million), by Form 2024 & 2032
- Figure 43: South Africa Xanthan Gum Market Revenue Share (%), by Form 2024 & 2032
- Figure 44: South Africa Xanthan Gum Market Revenue (Million), by Application 2024 & 2032
- Figure 45: South Africa Xanthan Gum Market Revenue Share (%), by Application 2024 & 2032
- Figure 46: South Africa Xanthan Gum Market Revenue (Million), by Country 2024 & 2032
- Figure 47: South Africa Xanthan Gum Market Revenue Share (%), by Country 2024 & 2032
List of Tables
- Table 1: Global Xanthan Gum Market Revenue Million Forecast, by Region 2019 & 2032
- Table 2: Global Xanthan Gum Market Revenue Million Forecast, by Form 2019 & 2032
- Table 3: Global Xanthan Gum Market Revenue Million Forecast, by Application 2019 & 2032
- Table 4: Global Xanthan Gum Market Revenue Million Forecast, by Region 2019 & 2032
- Table 5: Global Xanthan Gum Market Revenue Million Forecast, by Country 2019 & 2032
- Table 6: United States Xanthan Gum Market Revenue (Million) Forecast, by Application 2019 & 2032
- Table 7: Canada Xanthan Gum Market Revenue (Million) Forecast, by Application 2019 & 2032
- Table 8: Mexico Xanthan Gum Market Revenue (Million) Forecast, by Application 2019 & 2032
- Table 9: Rest of North America Xanthan Gum Market Revenue (Million) Forecast, by Application 2019 & 2032
- Table 10: Global Xanthan Gum Market Revenue Million Forecast, by Country 2019 & 2032
- Table 11: Spain Xanthan Gum Market Revenue (Million) Forecast, by Application 2019 & 2032
- Table 12: United Kingdom Xanthan Gum Market Revenue (Million) Forecast, by Application 2019 & 2032
- Table 13: Germany Xanthan Gum Market Revenue (Million) Forecast, by Application 2019 & 2032
- Table 14: France Xanthan Gum Market Revenue (Million) Forecast, by Application 2019 & 2032
- Table 15: Italy Xanthan Gum Market Revenue (Million) Forecast, by Application 2019 & 2032
- Table 16: Russia Xanthan Gum Market Revenue (Million) Forecast, by Application 2019 & 2032
- Table 17: Rest of Europe Xanthan Gum Market Revenue (Million) Forecast, by Application 2019 & 2032
- Table 18: Global Xanthan Gum Market Revenue Million Forecast, by Country 2019 & 2032
- Table 19: China Xanthan Gum Market Revenue (Million) Forecast, by Application 2019 & 2032
- Table 20: Japan Xanthan Gum Market Revenue (Million) Forecast, by Application 2019 & 2032
- Table 21: India Xanthan Gum Market Revenue (Million) Forecast, by Application 2019 & 2032
- Table 22: Australia Xanthan Gum Market Revenue (Million) Forecast, by Application 2019 & 2032
- Table 23: Rest of Asia Pacific Xanthan Gum Market Revenue (Million) Forecast, by Application 2019 & 2032
- Table 24: Global Xanthan Gum Market Revenue Million Forecast, by Country 2019 & 2032
- Table 25: Brazil Xanthan Gum Market Revenue (Million) Forecast, by Application 2019 & 2032
- Table 26: Argentina Xanthan Gum Market Revenue (Million) Forecast, by Application 2019 & 2032
- Table 27: Rest of South America Xanthan Gum Market Revenue (Million) Forecast, by Application 2019 & 2032
- Table 28: Global Xanthan Gum Market Revenue Million Forecast, by Country 2019 & 2032
- Table 29: United Arab Emrates Xanthan Gum Market Revenue (Million) Forecast, by Application 2019 & 2032
- Table 30: Rest of Middle East and Africa Xanthan Gum Market Revenue (Million) Forecast, by Application 2019 & 2032
- Table 31: Global Xanthan Gum Market Revenue Million Forecast, by Form 2019 & 2032
- Table 32: Global Xanthan Gum Market Revenue Million Forecast, by Application 2019 & 2032
- Table 33: Global Xanthan Gum Market Revenue Million Forecast, by Country 2019 & 2032
- Table 34: United States Xanthan Gum Market Revenue (Million) Forecast, by Application 2019 & 2032
- Table 35: Canada Xanthan Gum Market Revenue (Million) Forecast, by Application 2019 & 2032
- Table 36: Mexico Xanthan Gum Market Revenue (Million) Forecast, by Application 2019 & 2032
- Table 37: Rest of North America Xanthan Gum Market Revenue (Million) Forecast, by Application 2019 & 2032
- Table 38: Global Xanthan Gum Market Revenue Million Forecast, by Form 2019 & 2032
- Table 39: Global Xanthan Gum Market Revenue Million Forecast, by Application 2019 & 2032
- Table 40: Global Xanthan Gum Market Revenue Million Forecast, by Country 2019 & 2032
- Table 41: Spain Xanthan Gum Market Revenue (Million) Forecast, by Application 2019 & 2032
- Table 42: United Kingdom Xanthan Gum Market Revenue (Million) Forecast, by Application 2019 & 2032
- Table 43: Germany Xanthan Gum Market Revenue (Million) Forecast, by Application 2019 & 2032
- Table 44: France Xanthan Gum Market Revenue (Million) Forecast, by Application 2019 & 2032
- Table 45: Italy Xanthan Gum Market Revenue (Million) Forecast, by Application 2019 & 2032
- Table 46: Russia Xanthan Gum Market Revenue (Million) Forecast, by Application 2019 & 2032
- Table 47: Rest of Europe Xanthan Gum Market Revenue (Million) Forecast, by Application 2019 & 2032
- Table 48: Global Xanthan Gum Market Revenue Million Forecast, by Form 2019 & 2032
- Table 49: Global Xanthan Gum Market Revenue Million Forecast, by Application 2019 & 2032
- Table 50: Global Xanthan Gum Market Revenue Million Forecast, by Country 2019 & 2032
- Table 51: China Xanthan Gum Market Revenue (Million) Forecast, by Application 2019 & 2032
- Table 52: Japan Xanthan Gum Market Revenue (Million) Forecast, by Application 2019 & 2032
- Table 53: India Xanthan Gum Market Revenue (Million) Forecast, by Application 2019 & 2032
- Table 54: Australia Xanthan Gum Market Revenue (Million) Forecast, by Application 2019 & 2032
- Table 55: Rest of Asia Pacific Xanthan Gum Market Revenue (Million) Forecast, by Application 2019 & 2032
- Table 56: Global Xanthan Gum Market Revenue Million Forecast, by Form 2019 & 2032
- Table 57: Global Xanthan Gum Market Revenue Million Forecast, by Application 2019 & 2032
- Table 58: Global Xanthan Gum Market Revenue Million Forecast, by Country 2019 & 2032
- Table 59: Brazil Xanthan Gum Market Revenue (Million) Forecast, by Application 2019 & 2032
- Table 60: Argentina Xanthan Gum Market Revenue (Million) Forecast, by Application 2019 & 2032
- Table 61: Rest of South America Xanthan Gum Market Revenue (Million) Forecast, by Application 2019 & 2032
- Table 62: Global Xanthan Gum Market Revenue Million Forecast, by Form 2019 & 2032
- Table 63: Global Xanthan Gum Market Revenue Million Forecast, by Application 2019 & 2032
- Table 64: Global Xanthan Gum Market Revenue Million Forecast, by Country 2019 & 2032
- Table 65: Global Xanthan Gum Market Revenue Million Forecast, by Form 2019 & 2032
- Table 66: Global Xanthan Gum Market Revenue Million Forecast, by Application 2019 & 2032
- Table 67: Global Xanthan Gum Market Revenue Million Forecast, by Country 2019 & 2032
- Table 68: United Arab Emrates Xanthan Gum Market Revenue (Million) Forecast, by Application 2019 & 2032
- Table 69: Rest of Middle East and Africa Xanthan Gum Market Revenue (Million) Forecast, by Application 2019 & 2032
Frequently Asked Questions
1. What is the projected Compound Annual Growth Rate (CAGR) of the Xanthan Gum Market?
The projected CAGR is approximately 5.71%.
2. Which companies are prominent players in the Xanthan Gum Market?
Key companies in the market include Mitsubishi Corporation, Solvay S A, Cargill Incorporated, The Archer-Daniels-Midland Company, JM Huber Corporation , Foodchem International Corporation, Ingredion Incorporated, International Flavours and Fragrances Inc, Deosen Biochemical Ltd, C E Roeper GmbH.
3. What are the main segments of the Xanthan Gum Market?
The market segments include Form, Application.
4. Can you provide details about the market size?
The market size is estimated to be USD 754.80 Million as of 2022.
5. What are some drivers contributing to market growth?
Wide Applications and Functionality; Demand For Gluten-Free Products.
6. What are the notable trends driving market growth?
Food and Beverage Industry is the Biggest Consumer of Xanthan Gum.
7. Are there any restraints impacting market growth?
Easy Availability of Economically Feasible Alternatives.
8. Can you provide examples of recent developments in the market?
November 2023: Mitsubishi Corporation Life Sciences Limited expanded its food ingredient product capacity at the Saiki Factory of its subsidiary Kohjin Life Sciences Ltd. The company expanded the production capacity for its main products by approximately 1,000 metric tons annually.
9. What pricing options are available for accessing the report?
Pricing options include single-user, multi-user, and enterprise licenses priced at USD 4750, USD 5250, and USD 8750 respectively.
10. Is the market size provided in terms of value or volume?
The market size is provided in terms of value, measured in Million.
11. Are there any specific market keywords associated with the report?
Yes, the market keyword associated with the report is "Xanthan Gum Market," which aids in identifying and referencing the specific market segment covered.
12. How do I determine which pricing option suits my needs best?
The pricing options vary based on user requirements and access needs. Individual users may opt for single-user licenses, while businesses requiring broader access may choose multi-user or enterprise licenses for cost-effective access to the report.
13. Are there any additional resources or data provided in the Xanthan Gum Market report?
While the report offers comprehensive insights, it's advisable to review the specific contents or supplementary materials provided to ascertain if additional resources or data are available.
14. How can I stay updated on further developments or reports in the Xanthan Gum Market?
To stay informed about further developments, trends, and reports in the Xanthan Gum Market, consider subscribing to industry newsletters, following relevant companies and organizations, or regularly checking reputable industry news sources and publications.
Methodology
Step 1 - Identification of Relevant Samples Size from Population Database


Step 2 - Approaches for Defining Global Market Size (Value, Volume* & Price*)

Note*: In applicable scenarios
Step 3 - Data Sources
Primary Research
- Web Analytics
- Survey Reports
- Research Institute
- Latest Research Reports
- Opinion Leaders
Secondary Research
- Annual Reports
- White Paper
- Latest Press Release
- Industry Association
- Paid Database
- Investor Presentations

Step 4 - Data Triangulation
Involves using different sources of information in order to increase the validity of a study
These sources are likely to be stakeholders in a program - participants, other researchers, program staff, other community members, and so on.
Then we put all data in single framework & apply various statistical tools to find out the dynamic on the market.
During the analysis stage, feedback from the stakeholder groups would be compared to determine areas of agreement as well as areas of divergence


