

Key Insights
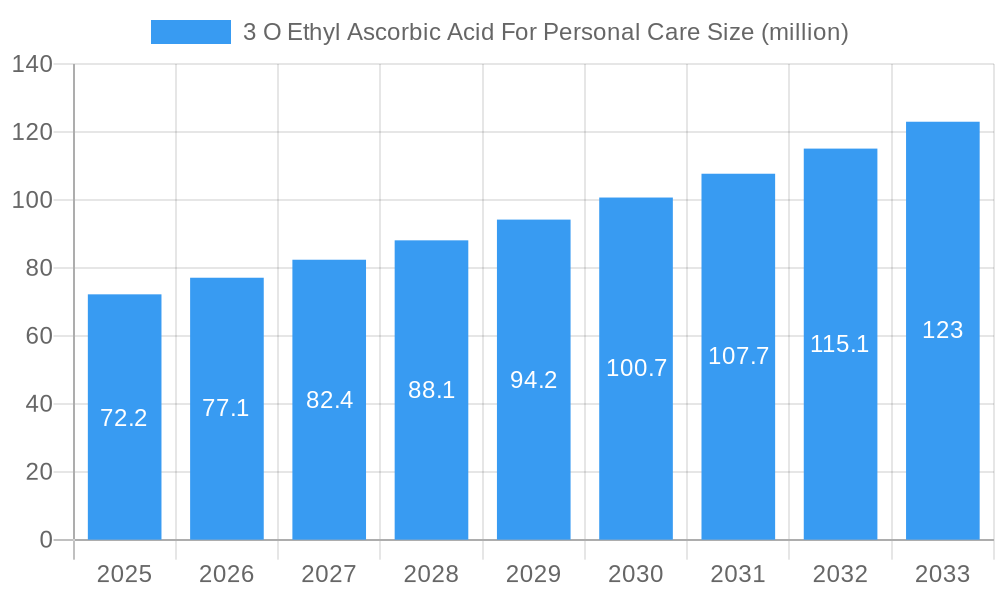
The global market for 3-O-Ethyl Ascorbic Acid (3-OEA) for personal care applications is experiencing robust growth, projected to reach $72.2 million in 2025 and maintain a Compound Annual Growth Rate (CAGR) of 6.7% from 2025 to 2033. This expansion is driven by several key factors. Increasing consumer awareness of the benefits of Vitamin C for skincare, particularly its antioxidant and anti-aging properties, fuels demand for stable and effective Vitamin C derivatives like 3-OEA. The superior stability of 3-OEA compared to L-Ascorbic Acid, allowing for better formulation and longer shelf life, is another significant driver. Furthermore, the growing popularity of natural and organic skincare products, along with the rising demand for efficacious anti-aging solutions, contributes to the market's positive trajectory. The market is segmented by application (serums, creams, lotions, etc.), distribution channel (online, retail), and geographic region. Key players, such as Bisor Corporation, Spec-Chem Group, and JAKA Biotech, are actively involved in the production and distribution of 3-OEA, fueling competition and innovation within the market.
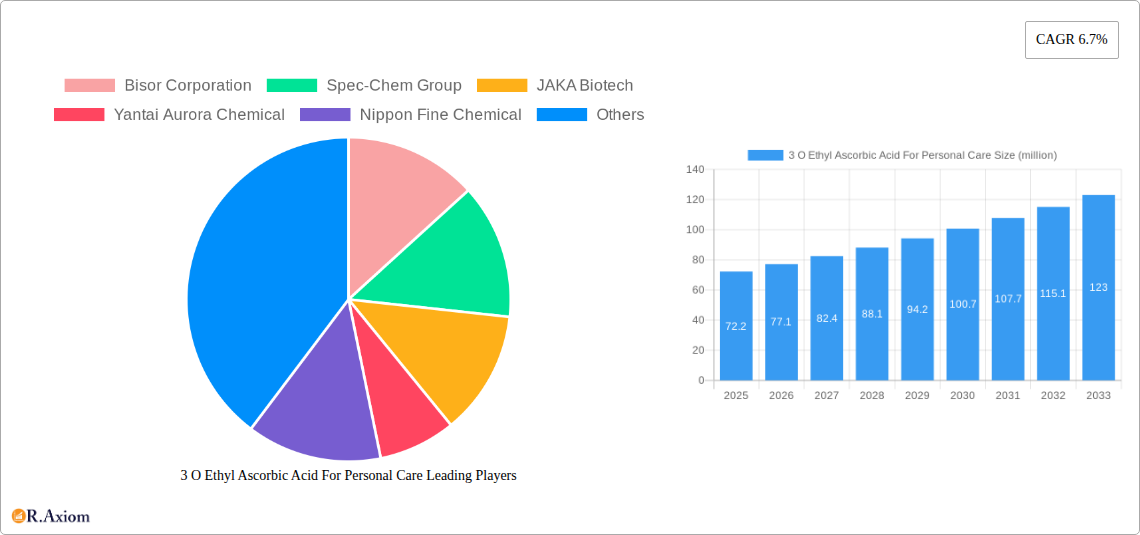
3 O Ethyl Ascorbic Acid For Personal Care Market Size (In Million)
The forecast period (2025-2033) anticipates continued growth, with the market likely exceeding $120 million by 2033. This projection incorporates anticipated advancements in formulation technology, expansion into new geographic markets, and sustained consumer demand for effective and stable Vitamin C-based skincare solutions. While challenges may include raw material price fluctuations and competition from other Vitamin C derivatives, the overall market outlook remains positive. The increasing adoption of 3-OEA in high-end cosmetic formulations and its incorporation into sunscreens, given its UV-protective properties, further solidify its promising growth potential. Continued research and development efforts focused on enhancing its efficacy and exploring new applications within the personal care sector are expected to further propel market expansion.
3 O Ethyl Ascorbic Acid For Personal Care Company Market Share
3-O-Ethyl Ascorbic Acid for Personal Care: A Comprehensive Market Report (2019-2033)
This in-depth report provides a comprehensive analysis of the 3-O-Ethyl Ascorbic Acid for Personal Care market, offering invaluable insights for industry stakeholders, investors, and strategic decision-makers. The study period covers 2019-2033, with 2025 as the base and estimated year. The forecast period spans 2025-2033, and the historical period encompasses 2019-2024. The report projects a market valued at xx million in 2025, expected to reach xx million by 2033, exhibiting a CAGR of xx%.
3-O-Ethyl Ascorbic Acid For Personal Care Market Concentration & Innovation
This section analyzes the market concentration, innovation drivers, regulatory landscape, product substitutes, end-user trends, and merger & acquisition (M&A) activities within the 3-O-Ethyl Ascorbic Acid for Personal Care market. The report assesses market share distribution among key players, identifying dominant companies and emerging competitors.
Market Concentration: The market demonstrates a moderately concentrated structure with the top five players holding approximately xx% of the market share in 2025. This is projected to shift slightly by 2033, with a potential increase to xx% market share for the top five players.
Innovation Drivers: Key innovation drivers include the development of more stable and effective formulations, improved delivery systems (e.g., liposomes, nanoemulsions), and the exploration of synergistic combinations with other active ingredients.
Regulatory Framework: The report details the relevant regulations and standards governing the use of 3-O-Ethyl Ascorbic Acid in personal care products across key regions, highlighting potential compliance challenges and opportunities.
Product Substitutes: The report identifies and analyzes potential substitutes for 3-O-Ethyl Ascorbic Acid in the personal care market, including other forms of vitamin C and alternative antioxidants.
End-User Trends: Growing consumer awareness of skincare benefits and a preference for natural and effective ingredients are driving demand. The report examines evolving consumer preferences and their influence on product development and marketing strategies.
M&A Activities: The report analyzes recent M&A activities in the industry, including deal values and strategic rationale. For example, in 2022, there were approximately xx M&A deals totaling xx million, primarily driven by strategies to expand product portfolios and market reach.
3-O-Ethyl Ascorbic Acid For Personal Care Industry Trends & Insights
This section delves into the market growth drivers, technological disruptions, consumer preferences, and competitive dynamics shaping the 3-O-Ethyl Ascorbic Acid for Personal Care market. The report examines the impact of these factors on market growth and penetration rates. Detailed analysis includes the influence of evolving consumer preferences towards natural and sustainable ingredients on market dynamics. Further, it addresses the competitive landscape and how technological advancements are impacting market strategies and product development. The report highlights the increasing adoption of advanced delivery systems and formulations, driving market growth and shaping future trends. Furthermore, it explores regional variations in market trends and identifies areas of significant growth potential. The report also analyzes pricing dynamics and their impact on market profitability, along with a detailed assessment of the competitive landscape, including strategic positioning and market share of key players.
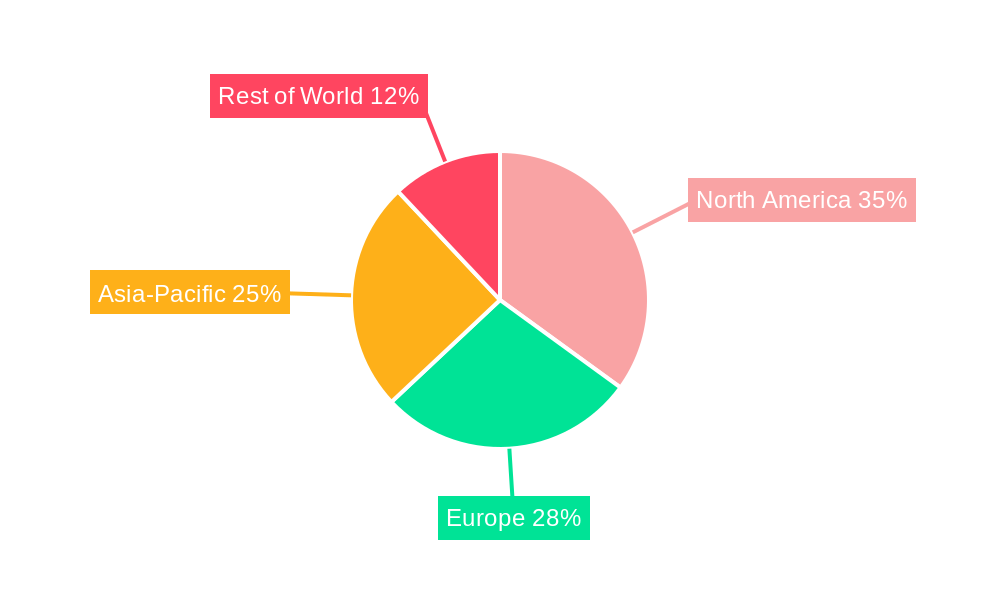
Dominant Markets & Segments in 3-O-Ethyl Ascorbic Acid For Personal Care
This section pinpoints the leading regions, countries, or segments within the 3-O-Ethyl Ascorbic Acid for Personal Care market. The detailed dominance analysis incorporates key drivers such as economic policies, infrastructure development, and consumer behavior, providing a comprehensive understanding of regional variations in market dynamics.
North America Dominance: North America holds a leading position, driven by high consumer awareness of skincare benefits, strong regulatory frameworks, and a robust personal care industry.
Asia-Pacific Growth Potential: The Asia-Pacific region exhibits significant growth potential, fueled by increasing disposable incomes, rising demand for premium skincare products, and a burgeoning middle class.
European Market Stability: The European market demonstrates stability, influenced by stringent regulations and a mature personal care industry.
Key Drivers:
- Economic Growth: Strong economic performance in key regions fuels consumer spending on personal care products.
- Infrastructure Development: Robust infrastructure supports the efficient distribution of personal care products.
- Favorable Government Policies: Supportive regulatory frameworks incentivize industry growth and innovation.
3-O-Ethyl Ascorbic Acid For Personal Care Product Developments
This section summarizes recent product innovations, applications, and competitive advantages within the 3-O-Ethyl Ascorbic Acid for Personal Care market, emphasizing technological advancements and their market fit. It highlights the emergence of novel formulations optimized for enhanced stability and efficacy, alongside the exploration of advanced delivery systems, and the development of targeted products tailored for specific skincare concerns. Furthermore, this section explores the competitive landscape through an analysis of leading players' product portfolios and strategic initiatives.
Report Scope & Segmentation Analysis
This report segments the 3-O-Ethyl Ascorbic Acid for Personal Care market based on product type (e.g., powder, liquid), application (e.g., serums, creams), and geography. Each segment's growth projections, market size, and competitive dynamics are detailed, offering a granular view of the market structure.
By Product Type: The powder segment currently dominates, while the liquid segment is exhibiting faster growth.
By Application: Serums and creams represent major application segments, with projected growth in specialized skincare products.
By Geography: Regional segmentations detail growth projections and market size for key geographic regions.
Key Drivers of 3-O-Ethyl Ascorbic Acid For Personal Care Growth
Key drivers include the increasing consumer demand for effective and safe skincare products, coupled with the growing awareness of the benefits of 3-O-Ethyl Ascorbic Acid as a potent antioxidant. Technological advancements in formulation and delivery systems are also boosting market growth. Further, supportive government regulations in several key regions are encouraging innovation and market expansion.
Challenges in the 3-O-Ethyl Ascorbic Acid For Personal Care Sector
Challenges include the high cost of production, potential supply chain disruptions, and stringent regulatory requirements that may impact product development and market entry. Moreover, competition from alternative antioxidants and established players presents significant competitive pressures.
Emerging Opportunities in 3-O-Ethyl Ascorbic Acid For Personal Care
Emerging opportunities exist in developing innovative and sustainable formulations, expanding into new geographic markets with high growth potential, and leveraging advanced technologies such as nanotechnology and AI-driven product development. Personalized skincare solutions incorporating 3-O-Ethyl Ascorbic Acid present another significant opportunity.
Leading Players in the 3-O-Ethyl Ascorbic Acid For Personal Care Market
- Bisor Corporation
- Spec-Chem Group
- JAKA Biotech
- Yantai Aurora Chemical
- Nippon Fine Chemical
- CosMol
- MCBIOTEC
- GfN & Selco
- CORUM
- Hubei Ataike Biotechnology
- Lanzhou Xinweirong
- Onlystar Biotechnology
- Sunchem Pharmaceutical
- Hangzhou Lingeba Technology
- Tianmen Chengyin Fine Chemical Factory
- Krishana Enterprises
Key Developments in 3-O-Ethyl Ascorbic Acid For Personal Care Industry
- Oct 2022: Bisor Corporation launched a new line of 3-O-Ethyl Ascorbic Acid-based serums.
- Mar 2023: JAKA Biotech announced a strategic partnership with a major personal care company to develop innovative formulations.
- June 2023: Yantai Aurora Chemical invested in expanding its production capacity for 3-O-Ethyl Ascorbic Acid.
Strategic Outlook for 3-O-Ethyl Ascorbic Acid For Personal Care Market
The 3-O-Ethyl Ascorbic Acid for Personal Care market is poised for significant growth driven by consumer demand, technological advancements, and expanding applications. Continued innovation in product formulations and delivery systems will be key to sustaining market expansion. Strategic partnerships and collaborations will play a crucial role in enhancing market competitiveness and accelerating growth.
3 O Ethyl Ascorbic Acid For Personal Care Segmentation
-
1. Application
- 1.1. Whitening and Freckle Products
- 1.2. Anti-aging Products
- 1.3. Others
-
2. Type
- 2.1. Purity 98%-99%
- 2.2. Purity 99%-99.5%
- 2.3. Purity ≥99.5%
3 O Ethyl Ascorbic Acid For Personal Care Segmentation By Geography
-
1. North America
- 1.1. United States
- 1.2. Canada
- 1.3. Mexico
-
2. South America
- 2.1. Brazil
- 2.2. Argentina
- 2.3. Rest of South America
-
3. Europe
- 3.1. United Kingdom
- 3.2. Germany
- 3.3. France
- 3.4. Italy
- 3.5. Spain
- 3.6. Russia
- 3.7. Benelux
- 3.8. Nordics
- 3.9. Rest of Europe
-
4. Middle East & Africa
- 4.1. Turkey
- 4.2. Israel
- 4.3. GCC
- 4.4. North Africa
- 4.5. South Africa
- 4.6. Rest of Middle East & Africa
-
5. Asia Pacific
- 5.1. China
- 5.2. India
- 5.3. Japan
- 5.4. South Korea
- 5.5. ASEAN
- 5.6. Oceania
- 5.7. Rest of Asia Pacific
3 O Ethyl Ascorbic Acid For Personal Care Regional Market Share
Geographic Coverage of 3 O Ethyl Ascorbic Acid For Personal Care
3 O Ethyl Ascorbic Acid For Personal Care REPORT HIGHLIGHTS
| Aspects | Details |
|---|---|
| Study Period | 2020-2034 |
| Base Year | 2025 |
| Estimated Year | 2026 |
| Forecast Period | 2026-2034 |
| Historical Period | 2020-2025 |
| Growth Rate | CAGR of 6.7% from 2020-2034 |
| Segmentation |
|
Table of Contents
- 1. Introduction
- 1.1. Research Scope
- 1.2. Market Segmentation
- 1.3. Research Objective
- 1.4. Definitions and Assumptions
- 2. Executive Summary
- 2.1. Market Snapshot
- 3. Market Dynamics
- 3.1. Market Drivers
- 3.2. Market Restrains
- 3.3. Market Trends
- 3.4. Market Opportunities
- 4. Market Factor Analysis
- 4.1. Porters Five Forces
- 4.1.1. Bargaining Power of Suppliers
- 4.1.2. Bargaining Power of Buyers
- 4.1.3. Threat of New Entrants
- 4.1.4. Threat of Substitutes
- 4.1.5. Competitive Rivalry
- 4.2. PESTEL analysis
- 4.3. BCG Analysis
- 4.3.1. Stars (High Growth, High Market Share)
- 4.3.2. Cash Cows (Low Growth, High Market Share)
- 4.3.3. Question Mark (High Growth, Low Market Share)
- 4.3.4. Dogs (Low Growth, Low Market Share)
- 4.4. Ansoff Matrix Analysis
- 4.5. Supply Chain Analysis
- 4.6. Regulatory Landscape
- 4.7. Current Market Potential and Opportunity Assessment (TAM–SAM–SOM Framework)
- 4.8. RAX Analyst Note
- 4.1. Porters Five Forces
- 5. Market Analysis, Insights and Forecast 2021-2033
- 5.1. Market Analysis, Insights and Forecast - by Application
- 5.1.1. Whitening and Freckle Products
- 5.1.2. Anti-aging Products
- 5.1.3. Others
- 5.2. Market Analysis, Insights and Forecast - by Type
- 5.2.1. Purity 98%-99%
- 5.2.2. Purity 99%-99.5%
- 5.2.3. Purity ≥99.5%
- 5.3. Market Analysis, Insights and Forecast - by Region
- 5.3.1. North America
- 5.3.2. South America
- 5.3.3. Europe
- 5.3.4. Middle East & Africa
- 5.3.5. Asia Pacific
- 5.1. Market Analysis, Insights and Forecast - by Application
- 6. Global 3 O Ethyl Ascorbic Acid For Personal Care Analysis, Insights and Forecast, 2021-2033
- 6.1. Market Analysis, Insights and Forecast - by Application
- 6.1.1. Whitening and Freckle Products
- 6.1.2. Anti-aging Products
- 6.1.3. Others
- 6.2. Market Analysis, Insights and Forecast - by Type
- 6.2.1. Purity 98%-99%
- 6.2.2. Purity 99%-99.5%
- 6.2.3. Purity ≥99.5%
- 6.1. Market Analysis, Insights and Forecast - by Application
- 7. North America 3 O Ethyl Ascorbic Acid For Personal Care Analysis, Insights and Forecast, 2020-2032
- 7.1. Market Analysis, Insights and Forecast - by Application
- 7.1.1. Whitening and Freckle Products
- 7.1.2. Anti-aging Products
- 7.1.3. Others
- 7.2. Market Analysis, Insights and Forecast - by Type
- 7.2.1. Purity 98%-99%
- 7.2.2. Purity 99%-99.5%
- 7.2.3. Purity ≥99.5%
- 7.1. Market Analysis, Insights and Forecast - by Application
- 8. South America 3 O Ethyl Ascorbic Acid For Personal Care Analysis, Insights and Forecast, 2020-2032
- 8.1. Market Analysis, Insights and Forecast - by Application
- 8.1.1. Whitening and Freckle Products
- 8.1.2. Anti-aging Products
- 8.1.3. Others
- 8.2. Market Analysis, Insights and Forecast - by Type
- 8.2.1. Purity 98%-99%
- 8.2.2. Purity 99%-99.5%
- 8.2.3. Purity ≥99.5%
- 8.1. Market Analysis, Insights and Forecast - by Application
- 9. Europe 3 O Ethyl Ascorbic Acid For Personal Care Analysis, Insights and Forecast, 2020-2032
- 9.1. Market Analysis, Insights and Forecast - by Application
- 9.1.1. Whitening and Freckle Products
- 9.1.2. Anti-aging Products
- 9.1.3. Others
- 9.2. Market Analysis, Insights and Forecast - by Type
- 9.2.1. Purity 98%-99%
- 9.2.2. Purity 99%-99.5%
- 9.2.3. Purity ≥99.5%
- 9.1. Market Analysis, Insights and Forecast - by Application
- 10. Middle East & Africa 3 O Ethyl Ascorbic Acid For Personal Care Analysis, Insights and Forecast, 2020-2032
- 10.1. Market Analysis, Insights and Forecast - by Application
- 10.1.1. Whitening and Freckle Products
- 10.1.2. Anti-aging Products
- 10.1.3. Others
- 10.2. Market Analysis, Insights and Forecast - by Type
- 10.2.1. Purity 98%-99%
- 10.2.2. Purity 99%-99.5%
- 10.2.3. Purity ≥99.5%
- 10.1. Market Analysis, Insights and Forecast - by Application
- 11. Asia Pacific 3 O Ethyl Ascorbic Acid For Personal Care Analysis, Insights and Forecast, 2020-2032
- 11.1. Market Analysis, Insights and Forecast - by Application
- 11.1.1. Whitening and Freckle Products
- 11.1.2. Anti-aging Products
- 11.1.3. Others
- 11.2. Market Analysis, Insights and Forecast - by Type
- 11.2.1. Purity 98%-99%
- 11.2.2. Purity 99%-99.5%
- 11.2.3. Purity ≥99.5%
- 11.1. Market Analysis, Insights and Forecast - by Application
- 12. Competitive Analysis
- 12.1. Company Profiles
- 12.1.1 Bisor Corporation
- 12.1.1.1. Company Overview
- 12.1.1.2. Products
- 12.1.1.3. Company Financials
- 12.1.1.4. SWOT Analysis
- 12.1.2 Spec-Chem Group
- 12.1.2.1. Company Overview
- 12.1.2.2. Products
- 12.1.2.3. Company Financials
- 12.1.2.4. SWOT Analysis
- 12.1.3 JAKA Biotech
- 12.1.3.1. Company Overview
- 12.1.3.2. Products
- 12.1.3.3. Company Financials
- 12.1.3.4. SWOT Analysis
- 12.1.4 Yantai Aurora Chemical
- 12.1.4.1. Company Overview
- 12.1.4.2. Products
- 12.1.4.3. Company Financials
- 12.1.4.4. SWOT Analysis
- 12.1.5 Nippon Fine Chemical
- 12.1.5.1. Company Overview
- 12.1.5.2. Products
- 12.1.5.3. Company Financials
- 12.1.5.4. SWOT Analysis
- 12.1.6 CosMol
- 12.1.6.1. Company Overview
- 12.1.6.2. Products
- 12.1.6.3. Company Financials
- 12.1.6.4. SWOT Analysis
- 12.1.7 MCBIOTEC
- 12.1.7.1. Company Overview
- 12.1.7.2. Products
- 12.1.7.3. Company Financials
- 12.1.7.4. SWOT Analysis
- 12.1.8 GfN & Selco
- 12.1.8.1. Company Overview
- 12.1.8.2. Products
- 12.1.8.3. Company Financials
- 12.1.8.4. SWOT Analysis
- 12.1.9 CORUM
- 12.1.9.1. Company Overview
- 12.1.9.2. Products
- 12.1.9.3. Company Financials
- 12.1.9.4. SWOT Analysis
- 12.1.10 Hubei Ataike Biotechnology
- 12.1.10.1. Company Overview
- 12.1.10.2. Products
- 12.1.10.3. Company Financials
- 12.1.10.4. SWOT Analysis
- 12.1.11 Lanzhou Xinweirong
- 12.1.11.1. Company Overview
- 12.1.11.2. Products
- 12.1.11.3. Company Financials
- 12.1.11.4. SWOT Analysis
- 12.1.12 Onlystar Biotechnology
- 12.1.12.1. Company Overview
- 12.1.12.2. Products
- 12.1.12.3. Company Financials
- 12.1.12.4. SWOT Analysis
- 12.1.13 Sunchem Pharmaceutical
- 12.1.13.1. Company Overview
- 12.1.13.2. Products
- 12.1.13.3. Company Financials
- 12.1.13.4. SWOT Analysis
- 12.1.14 Hangzhou Lingeba Technology
- 12.1.14.1. Company Overview
- 12.1.14.2. Products
- 12.1.14.3. Company Financials
- 12.1.14.4. SWOT Analysis
- 12.1.15 Tianmen Chengyin Fine Chemical Factory
- 12.1.15.1. Company Overview
- 12.1.15.2. Products
- 12.1.15.3. Company Financials
- 12.1.15.4. SWOT Analysis
- 12.1.16 Krishana Enterprises
- 12.1.16.1. Company Overview
- 12.1.16.2. Products
- 12.1.16.3. Company Financials
- 12.1.16.4. SWOT Analysis
- 12.1.1 Bisor Corporation
- 12.2. Market Entropy
- 12.2.1 Company's Key Areas Served
- 12.2.2 Recent Developments
- 12.3. Company Market Share Analysis 2025
- 12.3.1 Top 5 Companies Market Share Analysis
- 12.3.2 Top 3 Companies Market Share Analysis
- 12.4. List of Potential Customers
- 13. Research Methodology
List of Figures
- Figure 1: Global 3 O Ethyl Ascorbic Acid For Personal Care Revenue Breakdown (million, %) by Region 2025 & 2033
- Figure 2: Global 3 O Ethyl Ascorbic Acid For Personal Care Volume Breakdown (K, %) by Region 2025 & 2033
- Figure 3: North America 3 O Ethyl Ascorbic Acid For Personal Care Revenue (million), by Application 2025 & 2033
- Figure 4: North America 3 O Ethyl Ascorbic Acid For Personal Care Volume (K), by Application 2025 & 2033
- Figure 5: North America 3 O Ethyl Ascorbic Acid For Personal Care Revenue Share (%), by Application 2025 & 2033
- Figure 6: North America 3 O Ethyl Ascorbic Acid For Personal Care Volume Share (%), by Application 2025 & 2033
- Figure 7: North America 3 O Ethyl Ascorbic Acid For Personal Care Revenue (million), by Type 2025 & 2033
- Figure 8: North America 3 O Ethyl Ascorbic Acid For Personal Care Volume (K), by Type 2025 & 2033
- Figure 9: North America 3 O Ethyl Ascorbic Acid For Personal Care Revenue Share (%), by Type 2025 & 2033
- Figure 10: North America 3 O Ethyl Ascorbic Acid For Personal Care Volume Share (%), by Type 2025 & 2033
- Figure 11: North America 3 O Ethyl Ascorbic Acid For Personal Care Revenue (million), by Country 2025 & 2033
- Figure 12: North America 3 O Ethyl Ascorbic Acid For Personal Care Volume (K), by Country 2025 & 2033
- Figure 13: North America 3 O Ethyl Ascorbic Acid For Personal Care Revenue Share (%), by Country 2025 & 2033
- Figure 14: North America 3 O Ethyl Ascorbic Acid For Personal Care Volume Share (%), by Country 2025 & 2033
- Figure 15: South America 3 O Ethyl Ascorbic Acid For Personal Care Revenue (million), by Application 2025 & 2033
- Figure 16: South America 3 O Ethyl Ascorbic Acid For Personal Care Volume (K), by Application 2025 & 2033
- Figure 17: South America 3 O Ethyl Ascorbic Acid For Personal Care Revenue Share (%), by Application 2025 & 2033
- Figure 18: South America 3 O Ethyl Ascorbic Acid For Personal Care Volume Share (%), by Application 2025 & 2033
- Figure 19: South America 3 O Ethyl Ascorbic Acid For Personal Care Revenue (million), by Type 2025 & 2033
- Figure 20: South America 3 O Ethyl Ascorbic Acid For Personal Care Volume (K), by Type 2025 & 2033
- Figure 21: South America 3 O Ethyl Ascorbic Acid For Personal Care Revenue Share (%), by Type 2025 & 2033
- Figure 22: South America 3 O Ethyl Ascorbic Acid For Personal Care Volume Share (%), by Type 2025 & 2033
- Figure 23: South America 3 O Ethyl Ascorbic Acid For Personal Care Revenue (million), by Country 2025 & 2033
- Figure 24: South America 3 O Ethyl Ascorbic Acid For Personal Care Volume (K), by Country 2025 & 2033
- Figure 25: South America 3 O Ethyl Ascorbic Acid For Personal Care Revenue Share (%), by Country 2025 & 2033
- Figure 26: South America 3 O Ethyl Ascorbic Acid For Personal Care Volume Share (%), by Country 2025 & 2033
- Figure 27: Europe 3 O Ethyl Ascorbic Acid For Personal Care Revenue (million), by Application 2025 & 2033
- Figure 28: Europe 3 O Ethyl Ascorbic Acid For Personal Care Volume (K), by Application 2025 & 2033
- Figure 29: Europe 3 O Ethyl Ascorbic Acid For Personal Care Revenue Share (%), by Application 2025 & 2033
- Figure 30: Europe 3 O Ethyl Ascorbic Acid For Personal Care Volume Share (%), by Application 2025 & 2033
- Figure 31: Europe 3 O Ethyl Ascorbic Acid For Personal Care Revenue (million), by Type 2025 & 2033
- Figure 32: Europe 3 O Ethyl Ascorbic Acid For Personal Care Volume (K), by Type 2025 & 2033
- Figure 33: Europe 3 O Ethyl Ascorbic Acid For Personal Care Revenue Share (%), by Type 2025 & 2033
- Figure 34: Europe 3 O Ethyl Ascorbic Acid For Personal Care Volume Share (%), by Type 2025 & 2033
- Figure 35: Europe 3 O Ethyl Ascorbic Acid For Personal Care Revenue (million), by Country 2025 & 2033
- Figure 36: Europe 3 O Ethyl Ascorbic Acid For Personal Care Volume (K), by Country 2025 & 2033
- Figure 37: Europe 3 O Ethyl Ascorbic Acid For Personal Care Revenue Share (%), by Country 2025 & 2033
- Figure 38: Europe 3 O Ethyl Ascorbic Acid For Personal Care Volume Share (%), by Country 2025 & 2033
- Figure 39: Middle East & Africa 3 O Ethyl Ascorbic Acid For Personal Care Revenue (million), by Application 2025 & 2033
- Figure 40: Middle East & Africa 3 O Ethyl Ascorbic Acid For Personal Care Volume (K), by Application 2025 & 2033
- Figure 41: Middle East & Africa 3 O Ethyl Ascorbic Acid For Personal Care Revenue Share (%), by Application 2025 & 2033
- Figure 42: Middle East & Africa 3 O Ethyl Ascorbic Acid For Personal Care Volume Share (%), by Application 2025 & 2033
- Figure 43: Middle East & Africa 3 O Ethyl Ascorbic Acid For Personal Care Revenue (million), by Type 2025 & 2033
- Figure 44: Middle East & Africa 3 O Ethyl Ascorbic Acid For Personal Care Volume (K), by Type 2025 & 2033
- Figure 45: Middle East & Africa 3 O Ethyl Ascorbic Acid For Personal Care Revenue Share (%), by Type 2025 & 2033
- Figure 46: Middle East & Africa 3 O Ethyl Ascorbic Acid For Personal Care Volume Share (%), by Type 2025 & 2033
- Figure 47: Middle East & Africa 3 O Ethyl Ascorbic Acid For Personal Care Revenue (million), by Country 2025 & 2033
- Figure 48: Middle East & Africa 3 O Ethyl Ascorbic Acid For Personal Care Volume (K), by Country 2025 & 2033
- Figure 49: Middle East & Africa 3 O Ethyl Ascorbic Acid For Personal Care Revenue Share (%), by Country 2025 & 2033
- Figure 50: Middle East & Africa 3 O Ethyl Ascorbic Acid For Personal Care Volume Share (%), by Country 2025 & 2033
- Figure 51: Asia Pacific 3 O Ethyl Ascorbic Acid For Personal Care Revenue (million), by Application 2025 & 2033
- Figure 52: Asia Pacific 3 O Ethyl Ascorbic Acid For Personal Care Volume (K), by Application 2025 & 2033
- Figure 53: Asia Pacific 3 O Ethyl Ascorbic Acid For Personal Care Revenue Share (%), by Application 2025 & 2033
- Figure 54: Asia Pacific 3 O Ethyl Ascorbic Acid For Personal Care Volume Share (%), by Application 2025 & 2033
- Figure 55: Asia Pacific 3 O Ethyl Ascorbic Acid For Personal Care Revenue (million), by Type 2025 & 2033
- Figure 56: Asia Pacific 3 O Ethyl Ascorbic Acid For Personal Care Volume (K), by Type 2025 & 2033
- Figure 57: Asia Pacific 3 O Ethyl Ascorbic Acid For Personal Care Revenue Share (%), by Type 2025 & 2033
- Figure 58: Asia Pacific 3 O Ethyl Ascorbic Acid For Personal Care Volume Share (%), by Type 2025 & 2033
- Figure 59: Asia Pacific 3 O Ethyl Ascorbic Acid For Personal Care Revenue (million), by Country 2025 & 2033
- Figure 60: Asia Pacific 3 O Ethyl Ascorbic Acid For Personal Care Volume (K), by Country 2025 & 2033
- Figure 61: Asia Pacific 3 O Ethyl Ascorbic Acid For Personal Care Revenue Share (%), by Country 2025 & 2033
- Figure 62: Asia Pacific 3 O Ethyl Ascorbic Acid For Personal Care Volume Share (%), by Country 2025 & 2033
List of Tables
- Table 1: Global 3 O Ethyl Ascorbic Acid For Personal Care Revenue million Forecast, by Application 2020 & 2033
- Table 2: Global 3 O Ethyl Ascorbic Acid For Personal Care Volume K Forecast, by Application 2020 & 2033
- Table 3: Global 3 O Ethyl Ascorbic Acid For Personal Care Revenue million Forecast, by Type 2020 & 2033
- Table 4: Global 3 O Ethyl Ascorbic Acid For Personal Care Volume K Forecast, by Type 2020 & 2033
- Table 5: Global 3 O Ethyl Ascorbic Acid For Personal Care Revenue million Forecast, by Region 2020 & 2033
- Table 6: Global 3 O Ethyl Ascorbic Acid For Personal Care Volume K Forecast, by Region 2020 & 2033
- Table 7: Global 3 O Ethyl Ascorbic Acid For Personal Care Revenue million Forecast, by Application 2020 & 2033
- Table 8: Global 3 O Ethyl Ascorbic Acid For Personal Care Volume K Forecast, by Application 2020 & 2033
- Table 9: Global 3 O Ethyl Ascorbic Acid For Personal Care Revenue million Forecast, by Type 2020 & 2033
- Table 10: Global 3 O Ethyl Ascorbic Acid For Personal Care Volume K Forecast, by Type 2020 & 2033
- Table 11: Global 3 O Ethyl Ascorbic Acid For Personal Care Revenue million Forecast, by Country 2020 & 2033
- Table 12: Global 3 O Ethyl Ascorbic Acid For Personal Care Volume K Forecast, by Country 2020 & 2033
- Table 13: United States 3 O Ethyl Ascorbic Acid For Personal Care Revenue (million) Forecast, by Application 2020 & 2033
- Table 14: United States 3 O Ethyl Ascorbic Acid For Personal Care Volume (K) Forecast, by Application 2020 & 2033
- Table 15: Canada 3 O Ethyl Ascorbic Acid For Personal Care Revenue (million) Forecast, by Application 2020 & 2033
- Table 16: Canada 3 O Ethyl Ascorbic Acid For Personal Care Volume (K) Forecast, by Application 2020 & 2033
- Table 17: Mexico 3 O Ethyl Ascorbic Acid For Personal Care Revenue (million) Forecast, by Application 2020 & 2033
- Table 18: Mexico 3 O Ethyl Ascorbic Acid For Personal Care Volume (K) Forecast, by Application 2020 & 2033
- Table 19: Global 3 O Ethyl Ascorbic Acid For Personal Care Revenue million Forecast, by Application 2020 & 2033
- Table 20: Global 3 O Ethyl Ascorbic Acid For Personal Care Volume K Forecast, by Application 2020 & 2033
- Table 21: Global 3 O Ethyl Ascorbic Acid For Personal Care Revenue million Forecast, by Type 2020 & 2033
- Table 22: Global 3 O Ethyl Ascorbic Acid For Personal Care Volume K Forecast, by Type 2020 & 2033
- Table 23: Global 3 O Ethyl Ascorbic Acid For Personal Care Revenue million Forecast, by Country 2020 & 2033
- Table 24: Global 3 O Ethyl Ascorbic Acid For Personal Care Volume K Forecast, by Country 2020 & 2033
- Table 25: Brazil 3 O Ethyl Ascorbic Acid For Personal Care Revenue (million) Forecast, by Application 2020 & 2033
- Table 26: Brazil 3 O Ethyl Ascorbic Acid For Personal Care Volume (K) Forecast, by Application 2020 & 2033
- Table 27: Argentina 3 O Ethyl Ascorbic Acid For Personal Care Revenue (million) Forecast, by Application 2020 & 2033
- Table 28: Argentina 3 O Ethyl Ascorbic Acid For Personal Care Volume (K) Forecast, by Application 2020 & 2033
- Table 29: Rest of South America 3 O Ethyl Ascorbic Acid For Personal Care Revenue (million) Forecast, by Application 2020 & 2033
- Table 30: Rest of South America 3 O Ethyl Ascorbic Acid For Personal Care Volume (K) Forecast, by Application 2020 & 2033
- Table 31: Global 3 O Ethyl Ascorbic Acid For Personal Care Revenue million Forecast, by Application 2020 & 2033
- Table 32: Global 3 O Ethyl Ascorbic Acid For Personal Care Volume K Forecast, by Application 2020 & 2033
- Table 33: Global 3 O Ethyl Ascorbic Acid For Personal Care Revenue million Forecast, by Type 2020 & 2033
- Table 34: Global 3 O Ethyl Ascorbic Acid For Personal Care Volume K Forecast, by Type 2020 & 2033
- Table 35: Global 3 O Ethyl Ascorbic Acid For Personal Care Revenue million Forecast, by Country 2020 & 2033
- Table 36: Global 3 O Ethyl Ascorbic Acid For Personal Care Volume K Forecast, by Country 2020 & 2033
- Table 37: United Kingdom 3 O Ethyl Ascorbic Acid For Personal Care Revenue (million) Forecast, by Application 2020 & 2033
- Table 38: United Kingdom 3 O Ethyl Ascorbic Acid For Personal Care Volume (K) Forecast, by Application 2020 & 2033
- Table 39: Germany 3 O Ethyl Ascorbic Acid For Personal Care Revenue (million) Forecast, by Application 2020 & 2033
- Table 40: Germany 3 O Ethyl Ascorbic Acid For Personal Care Volume (K) Forecast, by Application 2020 & 2033
- Table 41: France 3 O Ethyl Ascorbic Acid For Personal Care Revenue (million) Forecast, by Application 2020 & 2033
- Table 42: France 3 O Ethyl Ascorbic Acid For Personal Care Volume (K) Forecast, by Application 2020 & 2033
- Table 43: Italy 3 O Ethyl Ascorbic Acid For Personal Care Revenue (million) Forecast, by Application 2020 & 2033
- Table 44: Italy 3 O Ethyl Ascorbic Acid For Personal Care Volume (K) Forecast, by Application 2020 & 2033
- Table 45: Spain 3 O Ethyl Ascorbic Acid For Personal Care Revenue (million) Forecast, by Application 2020 & 2033
- Table 46: Spain 3 O Ethyl Ascorbic Acid For Personal Care Volume (K) Forecast, by Application 2020 & 2033
- Table 47: Russia 3 O Ethyl Ascorbic Acid For Personal Care Revenue (million) Forecast, by Application 2020 & 2033
- Table 48: Russia 3 O Ethyl Ascorbic Acid For Personal Care Volume (K) Forecast, by Application 2020 & 2033
- Table 49: Benelux 3 O Ethyl Ascorbic Acid For Personal Care Revenue (million) Forecast, by Application 2020 & 2033
- Table 50: Benelux 3 O Ethyl Ascorbic Acid For Personal Care Volume (K) Forecast, by Application 2020 & 2033
- Table 51: Nordics 3 O Ethyl Ascorbic Acid For Personal Care Revenue (million) Forecast, by Application 2020 & 2033
- Table 52: Nordics 3 O Ethyl Ascorbic Acid For Personal Care Volume (K) Forecast, by Application 2020 & 2033
- Table 53: Rest of Europe 3 O Ethyl Ascorbic Acid For Personal Care Revenue (million) Forecast, by Application 2020 & 2033
- Table 54: Rest of Europe 3 O Ethyl Ascorbic Acid For Personal Care Volume (K) Forecast, by Application 2020 & 2033
- Table 55: Global 3 O Ethyl Ascorbic Acid For Personal Care Revenue million Forecast, by Application 2020 & 2033
- Table 56: Global 3 O Ethyl Ascorbic Acid For Personal Care Volume K Forecast, by Application 2020 & 2033
- Table 57: Global 3 O Ethyl Ascorbic Acid For Personal Care Revenue million Forecast, by Type 2020 & 2033
- Table 58: Global 3 O Ethyl Ascorbic Acid For Personal Care Volume K Forecast, by Type 2020 & 2033
- Table 59: Global 3 O Ethyl Ascorbic Acid For Personal Care Revenue million Forecast, by Country 2020 & 2033
- Table 60: Global 3 O Ethyl Ascorbic Acid For Personal Care Volume K Forecast, by Country 2020 & 2033
- Table 61: Turkey 3 O Ethyl Ascorbic Acid For Personal Care Revenue (million) Forecast, by Application 2020 & 2033
- Table 62: Turkey 3 O Ethyl Ascorbic Acid For Personal Care Volume (K) Forecast, by Application 2020 & 2033
- Table 63: Israel 3 O Ethyl Ascorbic Acid For Personal Care Revenue (million) Forecast, by Application 2020 & 2033
- Table 64: Israel 3 O Ethyl Ascorbic Acid For Personal Care Volume (K) Forecast, by Application 2020 & 2033
- Table 65: GCC 3 O Ethyl Ascorbic Acid For Personal Care Revenue (million) Forecast, by Application 2020 & 2033
- Table 66: GCC 3 O Ethyl Ascorbic Acid For Personal Care Volume (K) Forecast, by Application 2020 & 2033
- Table 67: North Africa 3 O Ethyl Ascorbic Acid For Personal Care Revenue (million) Forecast, by Application 2020 & 2033
- Table 68: North Africa 3 O Ethyl Ascorbic Acid For Personal Care Volume (K) Forecast, by Application 2020 & 2033
- Table 69: South Africa 3 O Ethyl Ascorbic Acid For Personal Care Revenue (million) Forecast, by Application 2020 & 2033
- Table 70: South Africa 3 O Ethyl Ascorbic Acid For Personal Care Volume (K) Forecast, by Application 2020 & 2033
- Table 71: Rest of Middle East & Africa 3 O Ethyl Ascorbic Acid For Personal Care Revenue (million) Forecast, by Application 2020 & 2033
- Table 72: Rest of Middle East & Africa 3 O Ethyl Ascorbic Acid For Personal Care Volume (K) Forecast, by Application 2020 & 2033
- Table 73: Global 3 O Ethyl Ascorbic Acid For Personal Care Revenue million Forecast, by Application 2020 & 2033
- Table 74: Global 3 O Ethyl Ascorbic Acid For Personal Care Volume K Forecast, by Application 2020 & 2033
- Table 75: Global 3 O Ethyl Ascorbic Acid For Personal Care Revenue million Forecast, by Type 2020 & 2033
- Table 76: Global 3 O Ethyl Ascorbic Acid For Personal Care Volume K Forecast, by Type 2020 & 2033
- Table 77: Global 3 O Ethyl Ascorbic Acid For Personal Care Revenue million Forecast, by Country 2020 & 2033
- Table 78: Global 3 O Ethyl Ascorbic Acid For Personal Care Volume K Forecast, by Country 2020 & 2033
- Table 79: China 3 O Ethyl Ascorbic Acid For Personal Care Revenue (million) Forecast, by Application 2020 & 2033
- Table 80: China 3 O Ethyl Ascorbic Acid For Personal Care Volume (K) Forecast, by Application 2020 & 2033
- Table 81: India 3 O Ethyl Ascorbic Acid For Personal Care Revenue (million) Forecast, by Application 2020 & 2033
- Table 82: India 3 O Ethyl Ascorbic Acid For Personal Care Volume (K) Forecast, by Application 2020 & 2033
- Table 83: Japan 3 O Ethyl Ascorbic Acid For Personal Care Revenue (million) Forecast, by Application 2020 & 2033
- Table 84: Japan 3 O Ethyl Ascorbic Acid For Personal Care Volume (K) Forecast, by Application 2020 & 2033
- Table 85: South Korea 3 O Ethyl Ascorbic Acid For Personal Care Revenue (million) Forecast, by Application 2020 & 2033
- Table 86: South Korea 3 O Ethyl Ascorbic Acid For Personal Care Volume (K) Forecast, by Application 2020 & 2033
- Table 87: ASEAN 3 O Ethyl Ascorbic Acid For Personal Care Revenue (million) Forecast, by Application 2020 & 2033
- Table 88: ASEAN 3 O Ethyl Ascorbic Acid For Personal Care Volume (K) Forecast, by Application 2020 & 2033
- Table 89: Oceania 3 O Ethyl Ascorbic Acid For Personal Care Revenue (million) Forecast, by Application 2020 & 2033
- Table 90: Oceania 3 O Ethyl Ascorbic Acid For Personal Care Volume (K) Forecast, by Application 2020 & 2033
- Table 91: Rest of Asia Pacific 3 O Ethyl Ascorbic Acid For Personal Care Revenue (million) Forecast, by Application 2020 & 2033
- Table 92: Rest of Asia Pacific 3 O Ethyl Ascorbic Acid For Personal Care Volume (K) Forecast, by Application 2020 & 2033
Frequently Asked Questions
1. What is the projected Compound Annual Growth Rate (CAGR) of the 3 O Ethyl Ascorbic Acid For Personal Care?
The projected CAGR is approximately 6.7%.
2. Which companies are prominent players in the 3 O Ethyl Ascorbic Acid For Personal Care?
Key companies in the market include Bisor Corporation, Spec-Chem Group, JAKA Biotech, Yantai Aurora Chemical, Nippon Fine Chemical, CosMol, MCBIOTEC, GfN & Selco, CORUM, Hubei Ataike Biotechnology, Lanzhou Xinweirong, Onlystar Biotechnology, Sunchem Pharmaceutical, Hangzhou Lingeba Technology, Tianmen Chengyin Fine Chemical Factory, Krishana Enterprises.
3. What are the main segments of the 3 O Ethyl Ascorbic Acid For Personal Care?
The market segments include Application, Type.
4. Can you provide details about the market size?
The market size is estimated to be USD 72.2 million as of 2022.
5. What are some drivers contributing to market growth?
N/A
6. What are the notable trends driving market growth?
N/A
7. Are there any restraints impacting market growth?
N/A
8. Can you provide examples of recent developments in the market?
N/A
9. What pricing options are available for accessing the report?
Pricing options include single-user, multi-user, and enterprise licenses priced at USD 3950.00, USD 5925.00, and USD 7900.00 respectively.
10. Is the market size provided in terms of value or volume?
The market size is provided in terms of value, measured in million and volume, measured in K.
11. Are there any specific market keywords associated with the report?
Yes, the market keyword associated with the report is "3 O Ethyl Ascorbic Acid For Personal Care," which aids in identifying and referencing the specific market segment covered.
12. How do I determine which pricing option suits my needs best?
The pricing options vary based on user requirements and access needs. Individual users may opt for single-user licenses, while businesses requiring broader access may choose multi-user or enterprise licenses for cost-effective access to the report.
13. Are there any additional resources or data provided in the 3 O Ethyl Ascorbic Acid For Personal Care report?
While the report offers comprehensive insights, it's advisable to review the specific contents or supplementary materials provided to ascertain if additional resources or data are available.
14. How can I stay updated on further developments or reports in the 3 O Ethyl Ascorbic Acid For Personal Care?
To stay informed about further developments, trends, and reports in the 3 O Ethyl Ascorbic Acid For Personal Care, consider subscribing to industry newsletters, following relevant companies and organizations, or regularly checking reputable industry news sources and publications.
Methodology
Step 1 - Identification of Relevant Samples Size from Population Database


Step 2 - Approaches for Defining Global Market Size (Value, Volume* & Price*)

Note*: In applicable scenarios
Step 3 - Data Sources
Primary Research
- Web Analytics
- Survey Reports
- Research Institute
- Latest Research Reports
- Opinion Leaders
Secondary Research
- Annual Reports
- White Paper
- Latest Press Release
- Industry Association
- Paid Database
- Investor Presentations

Step 4 - Data Triangulation
Involves using different sources of information in order to increase the validity of a study
These sources are likely to be stakeholders in a program - participants, other researchers, program staff, other community members, and so on.
Then we put all data in single framework & apply various statistical tools to find out the dynamic on the market.
During the analysis stage, feedback from the stakeholder groups would be compared to determine areas of agreement as well as areas of divergence