

Key Insights
The US activated carbon market is projected for robust expansion, with an estimated market size of $4,068.8 million in 2025, growing at a Compound Annual Growth Rate (CAGR) of 4% through 2033. This growth is propelled by increasing global concerns over environmental sustainability and the critical role activated carbon plays in pollution control and purification processes. Key drivers include stringent environmental regulations mandating cleaner air and water, particularly in industrial and municipal sectors. The rising demand for potable water, coupled with the need for efficient wastewater treatment, is a significant contributor to market expansion. Furthermore, the growing healthcare sector's reliance on activated carbon for medical applications, such as detoxification and pharmaceutical purification, adds to its market impetus. The automotive industry also presents a growing opportunity through its use in emission control systems.
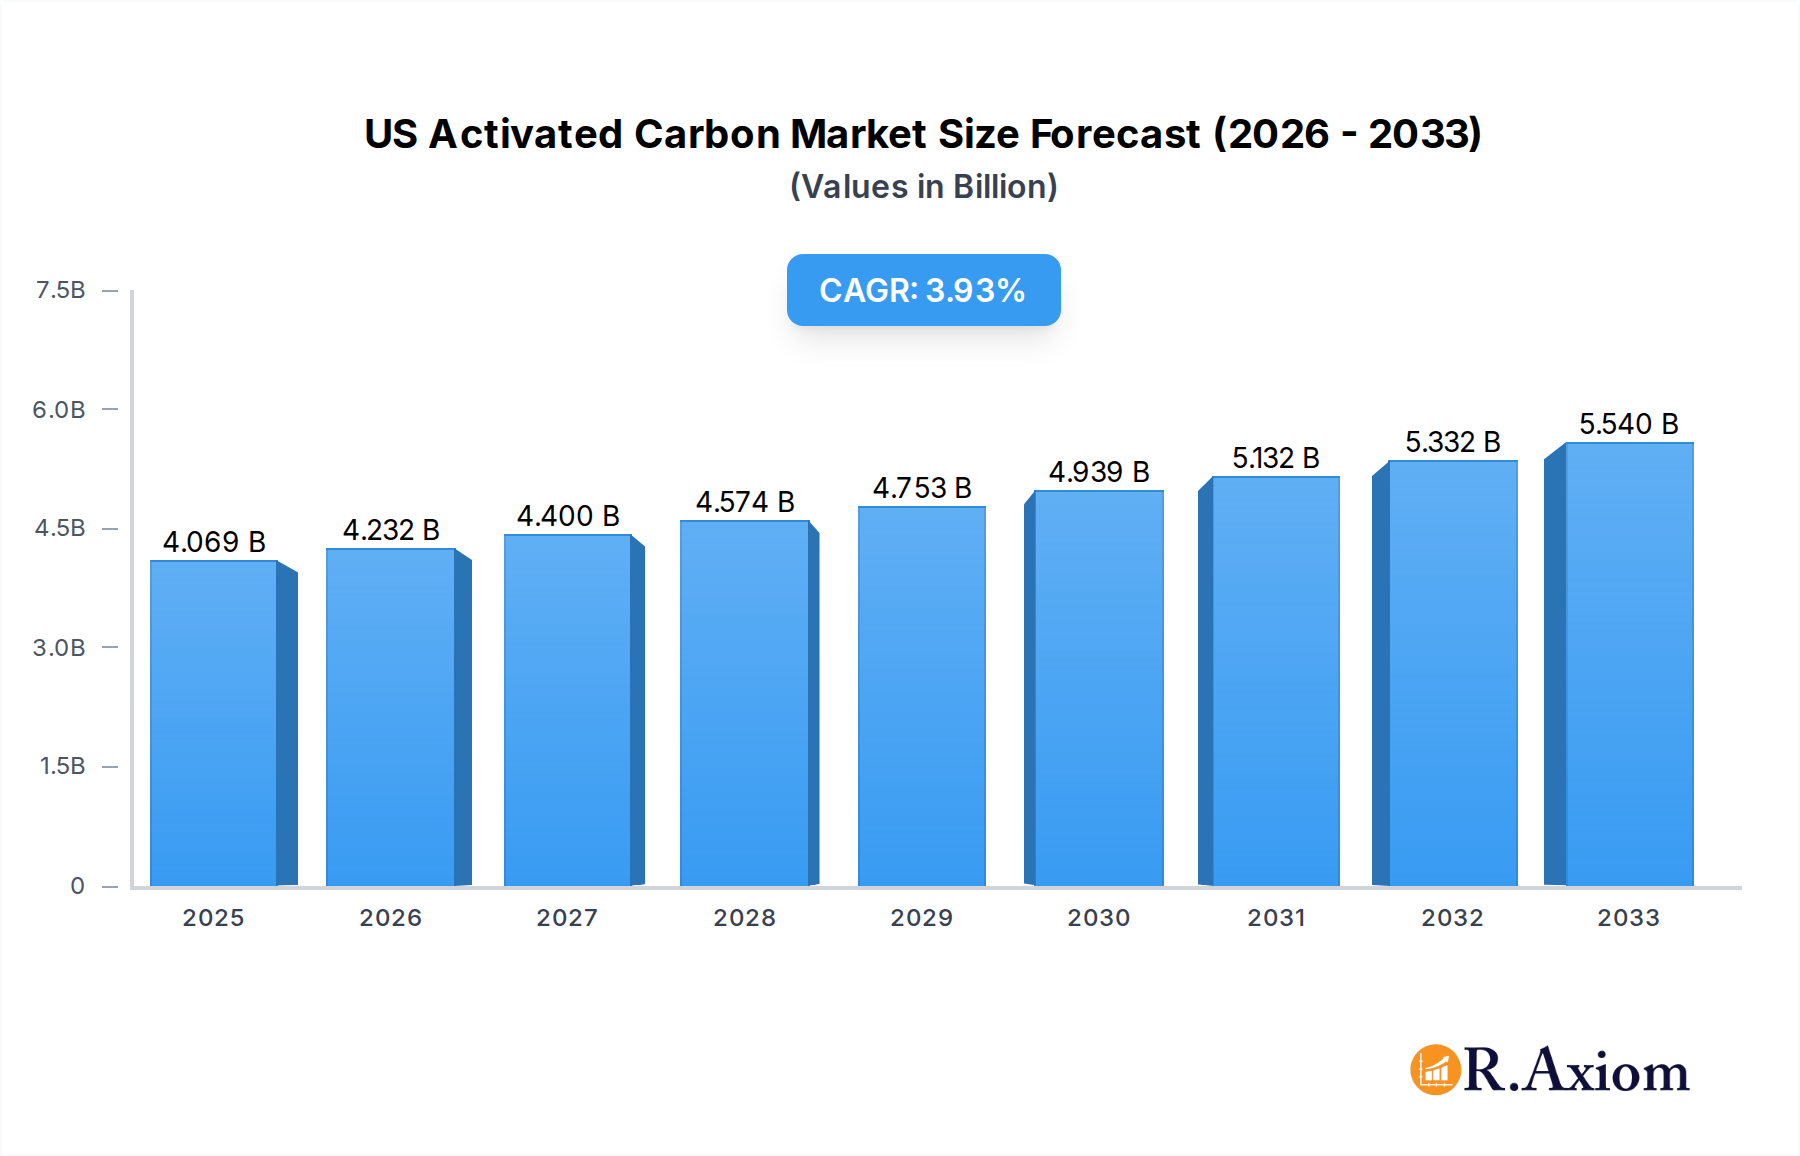
US Activated Carbon Market Market Size (In Billion)
The market is segmented across diverse product types, including powdered, granular, and extruded activated carbon, each catering to specific application needs. Powdered activated carbon (PAC) finds extensive use in water treatment due to its high surface area and rapid adsorption capabilities, while granular activated carbon (GAC) is preferred for its regenerability and suitability for large-scale applications like gas purification. The food and beverage industry's increasing focus on product purity and the industrial processing sector's demand for contaminant removal further fuel market dynamics. While the market exhibits strong growth potential, challenges such as fluctuating raw material costs and the development of alternative purification technologies could pose restraints. However, ongoing innovation in activated carbon production, focusing on enhanced performance and sustainability, is expected to mitigate these challenges and sustain the market's upward trajectory.

US Activated Carbon Market Company Market Share
This in-depth report provides a detailed analysis of the United States Activated Carbon Market, a crucial component in environmental remediation, industrial purification, and various specialized applications. Covering the historical period from 2019 to 2024 and extending through a robust forecast period to 2033, with a base year of 2025, this study offers actionable insights for industry stakeholders. The market is characterized by significant growth drivers, technological advancements, and evolving regulatory landscapes. Understanding the intricacies of this dynamic market is paramount for companies seeking to capitalize on emerging opportunities and navigate competitive challenges. The report delves into market concentration, key industry trends, dominant segments, product developments, growth drivers, challenges, emerging opportunities, leading players, and pivotal industry developments.
US Activated Carbon Market Market Concentration & Innovation
The US Activated Carbon Market exhibits a moderate to high level of concentration, with several key players holding substantial market share. Major companies like Calgon Carbon Corporation, Cabot Corporation, and Evoqua Water Technologies LLC are prominent. Innovation is a critical driver, fueled by the increasing demand for high-performance activated carbon solutions in stringent environmental applications and specialized industrial processes. Companies are investing heavily in research and development to create novel activated carbon materials with enhanced adsorption capacities, selectivity, and regeneration efficiencies. Regulatory frameworks, particularly those related to air and water quality standards, significantly influence innovation. For instance, stricter EPA regulations drive the development of activated carbons for mercury removal and volatile organic compound (VOC) abatement. Product substitutes, while present in some niche applications, generally lack the broad applicability and cost-effectiveness of activated carbon. End-user trends favor more sustainable and regenerable activated carbon solutions. Mergers and acquisitions (M&A) remain an active strategy for market consolidation and technology acquisition. Notable M&A deals, such as the acquisition of Peerless by Jacobi Carbons Group, highlight the ongoing consolidation. The market size for M&A activities in recent years is estimated in the hundreds of millions.
US Activated Carbon Market Industry Trends & Insights
The US Activated Carbon Market is poised for significant expansion, driven by a confluence of factors including stringent environmental regulations, growing industrial output, and increasing awareness of water and air quality. The market is projected to witness a Compound Annual Growth Rate (CAGR) of approximately 6.5% during the forecast period of 2025–2033. This growth is underpinned by the expanding adoption of activated carbon in diverse applications such as municipal water treatment, industrial wastewater management, and industrial gas purification. Technological advancements are playing a pivotal role, with ongoing research into new activation methods, enhanced impregnation techniques, and the development of specialized activated carbons for specific contaminant removal. For example, the development of activated carbons with tailored pore structures and surface chemistries is improving their efficacy in removing emerging contaminants like PFAS. Consumer preferences are shifting towards eco-friendly and sustainable solutions, boosting demand for regenerable activated carbon products and those derived from renewable feedstocks. The competitive landscape is characterized by intense rivalry among established players and emerging innovators, leading to continuous product development and price competition. Market penetration is steadily increasing across various end-user industries, reflecting the growing reliance on activated carbon for purification and separation processes. The market size for activated carbon in the US is estimated to be over 2,500 million in 2025, with substantial growth anticipated.
Dominant Markets & Segments in US Activated Carbon Market
Dominant Product Type: Granular Activated Carbon (GAC) Granular Activated Carbon (GAC) currently holds the largest market share within the US Activated Carbon Market, estimated at over 1,200 million in 2025. Its dominance is attributed to its versatility and widespread application in water purification and gas phase applications.
- Key Drivers for GAC Dominance:
- Infrastructure Investment: Significant investments in municipal water treatment plants and industrial wastewater facilities across the US.
- Regulatory Compliance: Stringent EPA regulations for drinking water and wastewater discharge necessitate the use of GAC for contaminant removal.
- Cost-Effectiveness: Compared to some specialized activated carbons, GAC offers a favorable cost-to-performance ratio for bulk purification.
Dominant Application: Water Purification The Water Purification segment is the leading application for activated carbon in the US, projected to reach over 1,500 million in 2025. This is driven by the critical need for safe and clean drinking water, as well as the effective treatment of industrial effluents.
- Key Drivers for Water Purification Dominance:
- Aging Infrastructure: The need to upgrade and maintain aging water infrastructure to meet evolving quality standards.
- Emerging Contaminants: Growing concerns and regulations surrounding emerging contaminants like pharmaceuticals, personal care products (PPCPs), and per- and polyfluoroalkyl substances (PFAS).
- Industrial Growth: Expansion in manufacturing and industrial sectors leading to increased generation of complex wastewater requiring advanced treatment.
Dominant End-user Industry: Water Treatment The Water Treatment sector, encompassing both municipal and industrial applications, is the primary end-user industry for activated carbon in the US, with an estimated market size of over 1,800 million in 2025.
- Key Drivers for Water Treatment Dominance:
- Public Health: The fundamental importance of providing safe drinking water to the public.
- Environmental Protection: Strict regulations aimed at preventing water pollution from industrial discharges.
- Resource Recovery: Increasing interest in water reuse and resource recovery within industrial processes, where activated carbon plays a crucial role in polishing treated water.
US Activated Carbon Market Product Developments
Product innovation in the US Activated Carbon Market is centered on enhancing adsorption efficiency, selectivity, and sustainability. Companies are developing specialized activated carbons from novel raw materials, including biomass and waste streams, to meet sustainability goals. Advanced impregnation techniques are yielding carbons with superior capabilities for specific contaminant removal, such as mercury and VOCs. These developments offer competitive advantages by providing tailored solutions to meet increasingly stringent regulatory requirements and evolving end-user needs for higher purity and environmental performance.
Report Scope & Segmentation Analysis
This report comprehensively analyzes the US Activated Carbon Market, segmenting it by Product Type (Powdered Activated Carbon, Granular Activated Carbon, Extruded or Pelletized Activated Carbon), Application (Gas Purification, Water Purification, Metal Extraction, Medicine, Other Applications), and End-user Industry (Water Treatment, Food & Beverage, Healthcare, Automotive, Industrial Processing, Other End-user Industries). The Powdered Activated Carbon segment is anticipated to witness a CAGR of approximately 5.8%, while Extruded or Pelletized Activated Carbon is expected to grow at around 6.2%. The Gas Purification application is projected to grow at a CAGR of 5.5%. In the end-user industry segment, the Healthcare sector is expected to demonstrate robust growth due to its application in medical devices and pharmaceutical purification.
Key Drivers of US Activated Carbon Market Growth
The growth of the US Activated Carbon Market is propelled by several critical factors. Firstly, increasingly stringent environmental regulations concerning air and water quality are compelling industries and municipalities to adopt advanced purification technologies. Secondly, the expanding industrial sector, particularly in manufacturing and chemicals, generates more complex wastewater and air emissions requiring effective treatment solutions. Thirdly, technological advancements in activated carbon production and application, such as the development of highly selective and regenerable carbons, are driving demand. Finally, growing consumer awareness and demand for cleaner environments and safer products further bolster market growth.
Challenges in the US Activated Carbon Market Sector
Despite robust growth prospects, the US Activated Carbon Market faces certain challenges. Fluctuations in raw material prices, such as coal and coconut shells, can impact production costs and profit margins. Stringent disposal regulations for spent activated carbon, particularly in certain hazardous waste applications, can add complexity and cost to end-user operations. Furthermore, the availability of effective substitutes in some niche applications, while not directly replacing the broad utility of activated carbon, can create competitive pressure. Supply chain disruptions, as experienced in recent years, can also affect the availability and timely delivery of activated carbon products.
Emerging Opportunities in US Activated Carbon Market
The US Activated Carbon Market presents significant emerging opportunities. The growing demand for activated carbon in the renewable energy sector, particularly for battery manufacturing and carbon capture technologies, is a key area. The increasing focus on circular economy principles is driving the development of advanced regeneration technologies and the use of activated carbon derived from waste biomass, creating a niche for sustainable solutions. Furthermore, the ongoing concern over emerging contaminants in water, such as PFAS, is creating a substantial market for specialized activated carbons with enhanced removal capabilities. The expansion of the pharmaceutical and food & beverage industries also presents opportunities for high-purity activated carbon applications.
Leading Players in the US Activated Carbon Market Market
- CarbUSA
- Carbon Activated Corporation
- Advanced Emissions Solutions Inc
- CPL Activated Carbons
- KURARAY CO LTD
- JACOBI CARBONS GROUP
- Evoqua Water Technologies LLC
- Cabot Corporation
- Prominent Systems Inc
- Calgon Carbon Corporation
- Ingevity
- KUREHA CORPORATION
- Veolia
- Donau Chemie AG
- Albemarle Corporation
- PURAGEN ACTIVATED CARBONS
Key Developments in US Activated Carbon Market Industry
- 2023: Calgon Carbon Corporation launched a new line of activated carbon for advanced mercury removal in coal-fired power plants, responding to evolving emissions standards.
- 2022: Evoqua Water Technologies LLC expanded its activated carbon services to include enhanced on-site regeneration, offering greater cost-efficiency and sustainability for its clients.
- 2021: Cabot Corporation announced significant investments in expanding its activated carbon production capacity to meet growing demand in industrial and environmental applications.
- 2020: Jacobi Carbons Group acquired Peerless, a leading producer of specialty activated carbons, to strengthen its portfolio and market presence.
- 2019: Ingevity introduced a new range of bio-based activated carbons derived from sustainable sources, catering to the increasing demand for eco-friendly solutions.
Strategic Outlook for US Activated Carbon Market Market
The strategic outlook for the US Activated Carbon Market remains highly positive, driven by an unwavering commitment to environmental stewardship and industrial efficiency. Continued investment in research and development will unlock further advancements in activated carbon performance and sustainability, enabling it to address increasingly complex purification challenges. The expansion into new application areas, such as carbon capture and battery manufacturing, will provide substantial growth avenues. Strategic partnerships and M&A activities are expected to continue, fostering market consolidation and innovation. Companies that prioritize offering tailored, high-performance, and sustainable activated carbon solutions will be best positioned to thrive in this dynamic and expanding market.
US Activated Carbon Market Segmentation
-
1. Product Type
- 1.1. Powdered Activated Carbon
- 1.2. Granular Activated Carbon
- 1.3. Extruded or Pelletized Activated Carbon
-
2. Application
- 2.1. Gas Purification
- 2.2. Water Purification
- 2.3. Metal Extraction
- 2.4. Medicine
- 2.5. Other Applications
-
3. End-user Industry
- 3.1. Water Treatment
- 3.2. Food & Beverage
- 3.3. Healthcare
- 3.4. Automotive
- 3.5. Industrial Processing
- 3.6. Other End-user Industries
US Activated Carbon Market Segmentation By Geography
-
1. North America
- 1.1. United States
- 1.2. Canada
- 1.3. Mexico
-
2. South America
- 2.1. Brazil
- 2.2. Argentina
- 2.3. Rest of South America
-
3. Europe
- 3.1. United Kingdom
- 3.2. Germany
- 3.3. France
- 3.4. Italy
- 3.5. Spain
- 3.6. Russia
- 3.7. Benelux
- 3.8. Nordics
- 3.9. Rest of Europe
-
4. Middle East & Africa
- 4.1. Turkey
- 4.2. Israel
- 4.3. GCC
- 4.4. North Africa
- 4.5. South Africa
- 4.6. Rest of Middle East & Africa
-
5. Asia Pacific
- 5.1. China
- 5.2. India
- 5.3. Japan
- 5.4. South Korea
- 5.5. ASEAN
- 5.6. Oceania
- 5.7. Rest of Asia Pacific
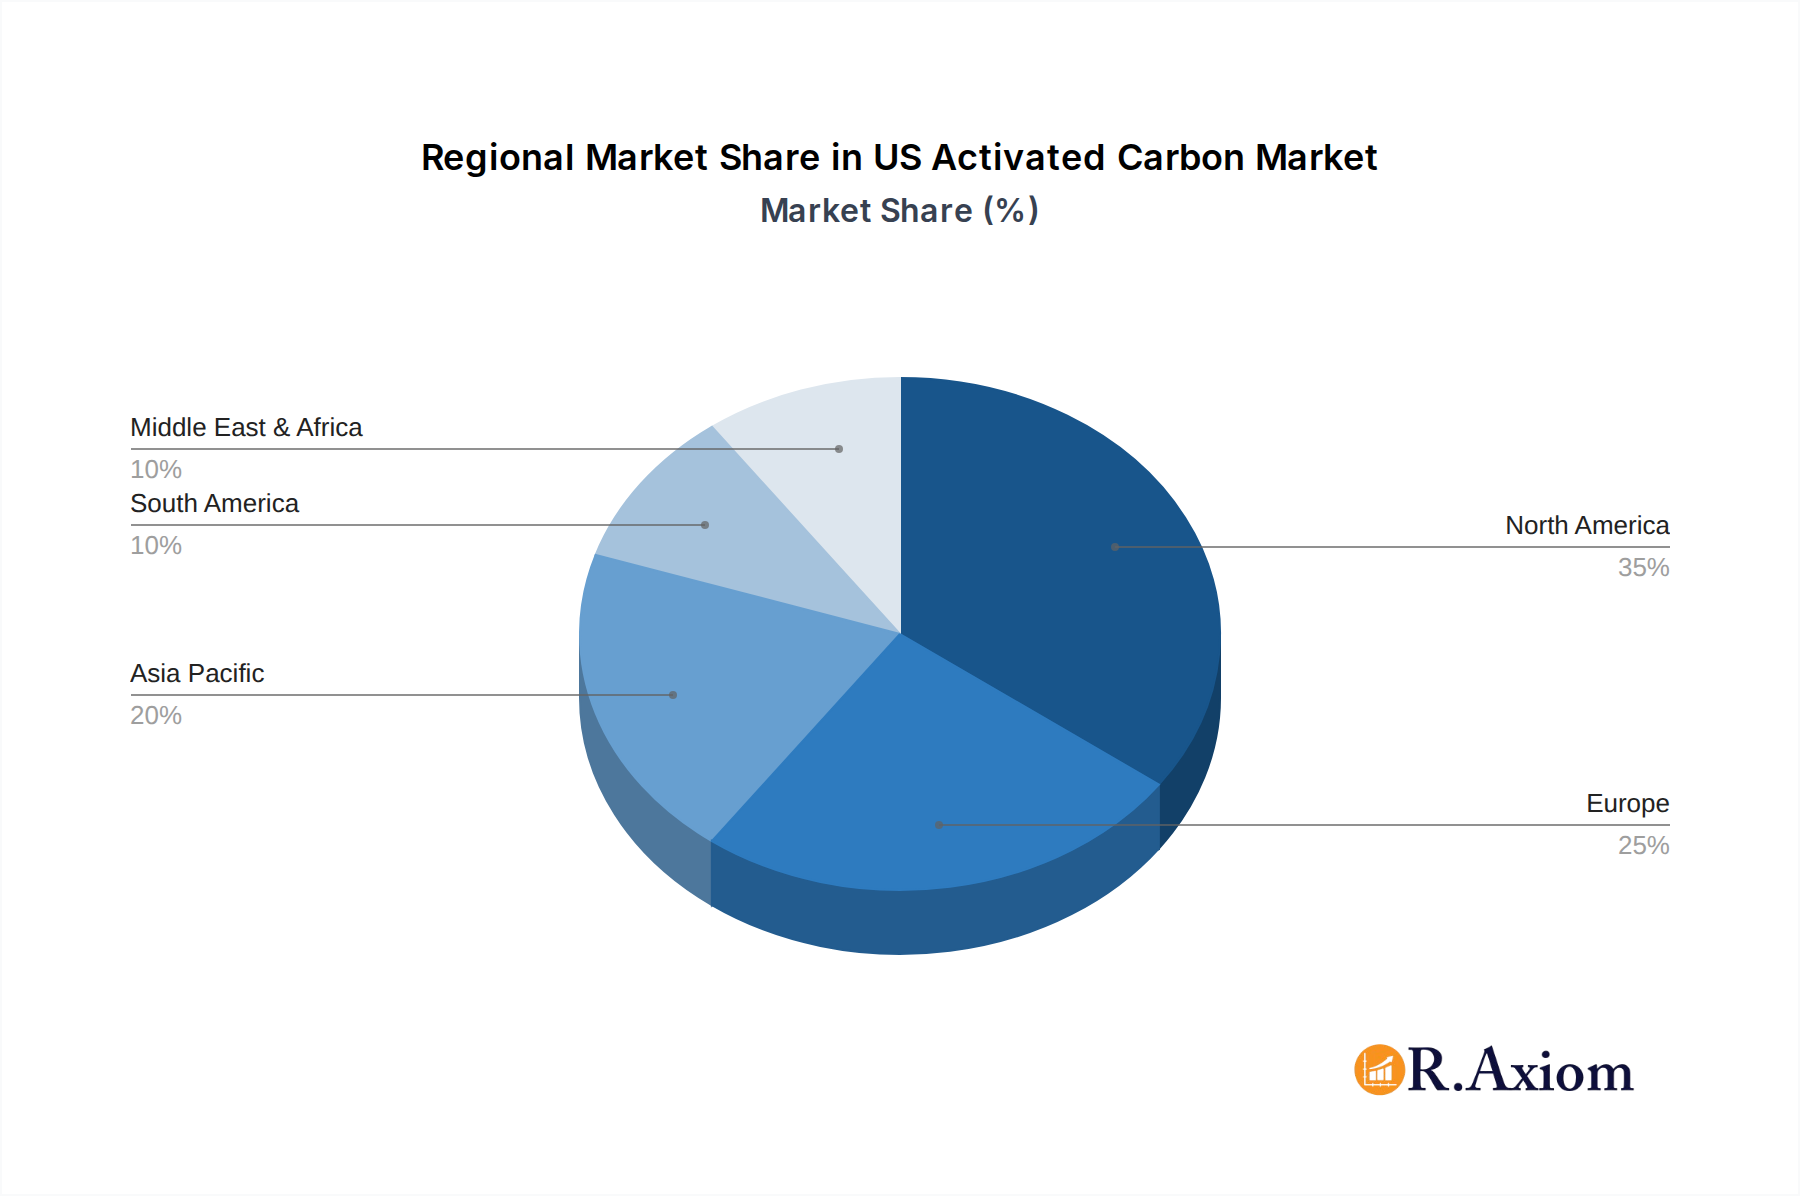
US Activated Carbon Market Regional Market Share
Geographic Coverage of US Activated Carbon Market
US Activated Carbon Market REPORT HIGHLIGHTS
| Aspects | Details |
|---|---|
| Study Period | 2020-2034 |
| Base Year | 2025 |
| Estimated Year | 2026 |
| Forecast Period | 2026-2034 |
| Historical Period | 2020-2025 |
| Growth Rate | CAGR of 8.8% from 2020-2034 |
| Segmentation |
|
Table of Contents
- 1. Introduction
- 1.1. Research Scope
- 1.2. Market Segmentation
- 1.3. Research Objective
- 1.4. Definitions and Assumptions
- 2. Executive Summary
- 2.1. Market Snapshot
- 3. Market Dynamics
- 3.1. Market Drivers
- 3.2. Market Restrains
- 3.3. Market Trends
- 3.4. Market Opportunities
- 4. Market Factor Analysis
- 4.1. Porters Five Forces
- 4.1.1. Bargaining Power of Suppliers
- 4.1.2. Bargaining Power of Buyers
- 4.1.3. Threat of New Entrants
- 4.1.4. Threat of Substitutes
- 4.1.5. Competitive Rivalry
- 4.2. PESTEL analysis
- 4.3. BCG Analysis
- 4.3.1. Stars (High Growth, High Market Share)
- 4.3.2. Cash Cows (Low Growth, High Market Share)
- 4.3.3. Question Mark (High Growth, Low Market Share)
- 4.3.4. Dogs (Low Growth, Low Market Share)
- 4.4. Ansoff Matrix Analysis
- 4.5. Supply Chain Analysis
- 4.6. Regulatory Landscape
- 4.7. Current Market Potential and Opportunity Assessment (TAM–SAM–SOM Framework)
- 4.8. RAX Analyst Note
- 4.1. Porters Five Forces
- 5. Market Analysis, Insights and Forecast 2021-2033
- 5.1. Market Analysis, Insights and Forecast - by Product Type
- 5.1.1. Powdered Activated Carbon
- 5.1.2. Granular Activated Carbon
- 5.1.3. Extruded or Pelletized Activated Carbon
- 5.2. Market Analysis, Insights and Forecast - by Application
- 5.2.1. Gas Purification
- 5.2.2. Water Purification
- 5.2.3. Metal Extraction
- 5.2.4. Medicine
- 5.2.5. Other Applications
- 5.3. Market Analysis, Insights and Forecast - by End-user Industry
- 5.3.1. Water Treatment
- 5.3.2. Food & Beverage
- 5.3.3. Healthcare
- 5.3.4. Automotive
- 5.3.5. Industrial Processing
- 5.3.6. Other End-user Industries
- 5.4. Market Analysis, Insights and Forecast - by Region
- 5.4.1. North America
- 5.4.2. South America
- 5.4.3. Europe
- 5.4.4. Middle East & Africa
- 5.4.5. Asia Pacific
- 5.1. Market Analysis, Insights and Forecast - by Product Type
- 6. Global US Activated Carbon Market Analysis, Insights and Forecast, 2021-2033
- 6.1. Market Analysis, Insights and Forecast - by Product Type
- 6.1.1. Powdered Activated Carbon
- 6.1.2. Granular Activated Carbon
- 6.1.3. Extruded or Pelletized Activated Carbon
- 6.2. Market Analysis, Insights and Forecast - by Application
- 6.2.1. Gas Purification
- 6.2.2. Water Purification
- 6.2.3. Metal Extraction
- 6.2.4. Medicine
- 6.2.5. Other Applications
- 6.3. Market Analysis, Insights and Forecast - by End-user Industry
- 6.3.1. Water Treatment
- 6.3.2. Food & Beverage
- 6.3.3. Healthcare
- 6.3.4. Automotive
- 6.3.5. Industrial Processing
- 6.3.6. Other End-user Industries
- 6.1. Market Analysis, Insights and Forecast - by Product Type
- 7. North America US Activated Carbon Market Analysis, Insights and Forecast, 2020-2032
- 7.1. Market Analysis, Insights and Forecast - by Product Type
- 7.1.1. Powdered Activated Carbon
- 7.1.2. Granular Activated Carbon
- 7.1.3. Extruded or Pelletized Activated Carbon
- 7.2. Market Analysis, Insights and Forecast - by Application
- 7.2.1. Gas Purification
- 7.2.2. Water Purification
- 7.2.3. Metal Extraction
- 7.2.4. Medicine
- 7.2.5. Other Applications
- 7.3. Market Analysis, Insights and Forecast - by End-user Industry
- 7.3.1. Water Treatment
- 7.3.2. Food & Beverage
- 7.3.3. Healthcare
- 7.3.4. Automotive
- 7.3.5. Industrial Processing
- 7.3.6. Other End-user Industries
- 7.1. Market Analysis, Insights and Forecast - by Product Type
- 8. South America US Activated Carbon Market Analysis, Insights and Forecast, 2020-2032
- 8.1. Market Analysis, Insights and Forecast - by Product Type
- 8.1.1. Powdered Activated Carbon
- 8.1.2. Granular Activated Carbon
- 8.1.3. Extruded or Pelletized Activated Carbon
- 8.2. Market Analysis, Insights and Forecast - by Application
- 8.2.1. Gas Purification
- 8.2.2. Water Purification
- 8.2.3. Metal Extraction
- 8.2.4. Medicine
- 8.2.5. Other Applications
- 8.3. Market Analysis, Insights and Forecast - by End-user Industry
- 8.3.1. Water Treatment
- 8.3.2. Food & Beverage
- 8.3.3. Healthcare
- 8.3.4. Automotive
- 8.3.5. Industrial Processing
- 8.3.6. Other End-user Industries
- 8.1. Market Analysis, Insights and Forecast - by Product Type
- 9. Europe US Activated Carbon Market Analysis, Insights and Forecast, 2020-2032
- 9.1. Market Analysis, Insights and Forecast - by Product Type
- 9.1.1. Powdered Activated Carbon
- 9.1.2. Granular Activated Carbon
- 9.1.3. Extruded or Pelletized Activated Carbon
- 9.2. Market Analysis, Insights and Forecast - by Application
- 9.2.1. Gas Purification
- 9.2.2. Water Purification
- 9.2.3. Metal Extraction
- 9.2.4. Medicine
- 9.2.5. Other Applications
- 9.3. Market Analysis, Insights and Forecast - by End-user Industry
- 9.3.1. Water Treatment
- 9.3.2. Food & Beverage
- 9.3.3. Healthcare
- 9.3.4. Automotive
- 9.3.5. Industrial Processing
- 9.3.6. Other End-user Industries
- 9.1. Market Analysis, Insights and Forecast - by Product Type
- 10. Middle East & Africa US Activated Carbon Market Analysis, Insights and Forecast, 2020-2032
- 10.1. Market Analysis, Insights and Forecast - by Product Type
- 10.1.1. Powdered Activated Carbon
- 10.1.2. Granular Activated Carbon
- 10.1.3. Extruded or Pelletized Activated Carbon
- 10.2. Market Analysis, Insights and Forecast - by Application
- 10.2.1. Gas Purification
- 10.2.2. Water Purification
- 10.2.3. Metal Extraction
- 10.2.4. Medicine
- 10.2.5. Other Applications
- 10.3. Market Analysis, Insights and Forecast - by End-user Industry
- 10.3.1. Water Treatment
- 10.3.2. Food & Beverage
- 10.3.3. Healthcare
- 10.3.4. Automotive
- 10.3.5. Industrial Processing
- 10.3.6. Other End-user Industries
- 10.1. Market Analysis, Insights and Forecast - by Product Type
- 11. Asia Pacific US Activated Carbon Market Analysis, Insights and Forecast, 2020-2032
- 11.1. Market Analysis, Insights and Forecast - by Product Type
- 11.1.1. Powdered Activated Carbon
- 11.1.2. Granular Activated Carbon
- 11.1.3. Extruded or Pelletized Activated Carbon
- 11.2. Market Analysis, Insights and Forecast - by Application
- 11.2.1. Gas Purification
- 11.2.2. Water Purification
- 11.2.3. Metal Extraction
- 11.2.4. Medicine
- 11.2.5. Other Applications
- 11.3. Market Analysis, Insights and Forecast - by End-user Industry
- 11.3.1. Water Treatment
- 11.3.2. Food & Beverage
- 11.3.3. Healthcare
- 11.3.4. Automotive
- 11.3.5. Industrial Processing
- 11.3.6. Other End-user Industries
- 11.1. Market Analysis, Insights and Forecast - by Product Type
- 12. Competitive Analysis
- 12.1. Company Profiles
- 12.1.1 CarbUSA
- 12.1.1.1. Company Overview
- 12.1.1.2. Products
- 12.1.1.3. Company Financials
- 12.1.1.4. SWOT Analysis
- 12.1.2 Carbon Activated Corporation
- 12.1.2.1. Company Overview
- 12.1.2.2. Products
- 12.1.2.3. Company Financials
- 12.1.2.4. SWOT Analysis
- 12.1.3 Advanced Emissions Solutions Inc
- 12.1.3.1. Company Overview
- 12.1.3.2. Products
- 12.1.3.3. Company Financials
- 12.1.3.4. SWOT Analysis
- 12.1.4 CPL Activated Carbons
- 12.1.4.1. Company Overview
- 12.1.4.2. Products
- 12.1.4.3. Company Financials
- 12.1.4.4. SWOT Analysis
- 12.1.5 KURARAY CO LTD
- 12.1.5.1. Company Overview
- 12.1.5.2. Products
- 12.1.5.3. Company Financials
- 12.1.5.4. SWOT Analysis
- 12.1.6 JACOBI CARBONS GROUP
- 12.1.6.1. Company Overview
- 12.1.6.2. Products
- 12.1.6.3. Company Financials
- 12.1.6.4. SWOT Analysis
- 12.1.7 Evoqua Water Technologies LLC
- 12.1.7.1. Company Overview
- 12.1.7.2. Products
- 12.1.7.3. Company Financials
- 12.1.7.4. SWOT Analysis
- 12.1.8 Cabot Corporation
- 12.1.8.1. Company Overview
- 12.1.8.2. Products
- 12.1.8.3. Company Financials
- 12.1.8.4. SWOT Analysis
- 12.1.9 Prominent Systems Inc
- 12.1.9.1. Company Overview
- 12.1.9.2. Products
- 12.1.9.3. Company Financials
- 12.1.9.4. SWOT Analysis
- 12.1.10 Calgon Carbon Corporation
- 12.1.10.1. Company Overview
- 12.1.10.2. Products
- 12.1.10.3. Company Financials
- 12.1.10.4. SWOT Analysis
- 12.1.11 Ingevity
- 12.1.11.1. Company Overview
- 12.1.11.2. Products
- 12.1.11.3. Company Financials
- 12.1.11.4. SWOT Analysis
- 12.1.12 KUREHA CORPORATION
- 12.1.12.1. Company Overview
- 12.1.12.2. Products
- 12.1.12.3. Company Financials
- 12.1.12.4. SWOT Analysis
- 12.1.13 Veolia*List Not Exhaustive
- 12.1.13.1. Company Overview
- 12.1.13.2. Products
- 12.1.13.3. Company Financials
- 12.1.13.4. SWOT Analysis
- 12.1.14 Donau Chemie AG
- 12.1.14.1. Company Overview
- 12.1.14.2. Products
- 12.1.14.3. Company Financials
- 12.1.14.4. SWOT Analysis
- 12.1.15 Albemarle Corporation
- 12.1.15.1. Company Overview
- 12.1.15.2. Products
- 12.1.15.3. Company Financials
- 12.1.15.4. SWOT Analysis
- 12.1.16 PURAGEN ACTIVATED CARBONS
- 12.1.16.1. Company Overview
- 12.1.16.2. Products
- 12.1.16.3. Company Financials
- 12.1.16.4. SWOT Analysis
- 12.1.1 CarbUSA
- 12.2. Market Entropy
- 12.2.1 Company's Key Areas Served
- 12.2.2 Recent Developments
- 12.3. Company Market Share Analysis 2025
- 12.3.1 Top 5 Companies Market Share Analysis
- 12.3.2 Top 3 Companies Market Share Analysis
- 12.4. List of Potential Customers
- 13. Research Methodology
List of Figures
- Figure 1: Global US Activated Carbon Market Revenue Breakdown (million, %) by Region 2025 & 2033
- Figure 2: North America US Activated Carbon Market Revenue (million), by Product Type 2025 & 2033
- Figure 3: North America US Activated Carbon Market Revenue Share (%), by Product Type 2025 & 2033
- Figure 4: North America US Activated Carbon Market Revenue (million), by Application 2025 & 2033
- Figure 5: North America US Activated Carbon Market Revenue Share (%), by Application 2025 & 2033
- Figure 6: North America US Activated Carbon Market Revenue (million), by End-user Industry 2025 & 2033
- Figure 7: North America US Activated Carbon Market Revenue Share (%), by End-user Industry 2025 & 2033
- Figure 8: North America US Activated Carbon Market Revenue (million), by Country 2025 & 2033
- Figure 9: North America US Activated Carbon Market Revenue Share (%), by Country 2025 & 2033
- Figure 10: South America US Activated Carbon Market Revenue (million), by Product Type 2025 & 2033
- Figure 11: South America US Activated Carbon Market Revenue Share (%), by Product Type 2025 & 2033
- Figure 12: South America US Activated Carbon Market Revenue (million), by Application 2025 & 2033
- Figure 13: South America US Activated Carbon Market Revenue Share (%), by Application 2025 & 2033
- Figure 14: South America US Activated Carbon Market Revenue (million), by End-user Industry 2025 & 2033
- Figure 15: South America US Activated Carbon Market Revenue Share (%), by End-user Industry 2025 & 2033
- Figure 16: South America US Activated Carbon Market Revenue (million), by Country 2025 & 2033
- Figure 17: South America US Activated Carbon Market Revenue Share (%), by Country 2025 & 2033
- Figure 18: Europe US Activated Carbon Market Revenue (million), by Product Type 2025 & 2033
- Figure 19: Europe US Activated Carbon Market Revenue Share (%), by Product Type 2025 & 2033
- Figure 20: Europe US Activated Carbon Market Revenue (million), by Application 2025 & 2033
- Figure 21: Europe US Activated Carbon Market Revenue Share (%), by Application 2025 & 2033
- Figure 22: Europe US Activated Carbon Market Revenue (million), by End-user Industry 2025 & 2033
- Figure 23: Europe US Activated Carbon Market Revenue Share (%), by End-user Industry 2025 & 2033
- Figure 24: Europe US Activated Carbon Market Revenue (million), by Country 2025 & 2033
- Figure 25: Europe US Activated Carbon Market Revenue Share (%), by Country 2025 & 2033
- Figure 26: Middle East & Africa US Activated Carbon Market Revenue (million), by Product Type 2025 & 2033
- Figure 27: Middle East & Africa US Activated Carbon Market Revenue Share (%), by Product Type 2025 & 2033
- Figure 28: Middle East & Africa US Activated Carbon Market Revenue (million), by Application 2025 & 2033
- Figure 29: Middle East & Africa US Activated Carbon Market Revenue Share (%), by Application 2025 & 2033
- Figure 30: Middle East & Africa US Activated Carbon Market Revenue (million), by End-user Industry 2025 & 2033
- Figure 31: Middle East & Africa US Activated Carbon Market Revenue Share (%), by End-user Industry 2025 & 2033
- Figure 32: Middle East & Africa US Activated Carbon Market Revenue (million), by Country 2025 & 2033
- Figure 33: Middle East & Africa US Activated Carbon Market Revenue Share (%), by Country 2025 & 2033
- Figure 34: Asia Pacific US Activated Carbon Market Revenue (million), by Product Type 2025 & 2033
- Figure 35: Asia Pacific US Activated Carbon Market Revenue Share (%), by Product Type 2025 & 2033
- Figure 36: Asia Pacific US Activated Carbon Market Revenue (million), by Application 2025 & 2033
- Figure 37: Asia Pacific US Activated Carbon Market Revenue Share (%), by Application 2025 & 2033
- Figure 38: Asia Pacific US Activated Carbon Market Revenue (million), by End-user Industry 2025 & 2033
- Figure 39: Asia Pacific US Activated Carbon Market Revenue Share (%), by End-user Industry 2025 & 2033
- Figure 40: Asia Pacific US Activated Carbon Market Revenue (million), by Country 2025 & 2033
- Figure 41: Asia Pacific US Activated Carbon Market Revenue Share (%), by Country 2025 & 2033
List of Tables
- Table 1: Global US Activated Carbon Market Revenue million Forecast, by Product Type 2020 & 2033
- Table 2: Global US Activated Carbon Market Revenue million Forecast, by Application 2020 & 2033
- Table 3: Global US Activated Carbon Market Revenue million Forecast, by End-user Industry 2020 & 2033
- Table 4: Global US Activated Carbon Market Revenue million Forecast, by Region 2020 & 2033
- Table 5: Global US Activated Carbon Market Revenue million Forecast, by Product Type 2020 & 2033
- Table 6: Global US Activated Carbon Market Revenue million Forecast, by Application 2020 & 2033
- Table 7: Global US Activated Carbon Market Revenue million Forecast, by End-user Industry 2020 & 2033
- Table 8: Global US Activated Carbon Market Revenue million Forecast, by Country 2020 & 2033
- Table 9: United States US Activated Carbon Market Revenue (million) Forecast, by Application 2020 & 2033
- Table 10: Canada US Activated Carbon Market Revenue (million) Forecast, by Application 2020 & 2033
- Table 11: Mexico US Activated Carbon Market Revenue (million) Forecast, by Application 2020 & 2033
- Table 12: Global US Activated Carbon Market Revenue million Forecast, by Product Type 2020 & 2033
- Table 13: Global US Activated Carbon Market Revenue million Forecast, by Application 2020 & 2033
- Table 14: Global US Activated Carbon Market Revenue million Forecast, by End-user Industry 2020 & 2033
- Table 15: Global US Activated Carbon Market Revenue million Forecast, by Country 2020 & 2033
- Table 16: Brazil US Activated Carbon Market Revenue (million) Forecast, by Application 2020 & 2033
- Table 17: Argentina US Activated Carbon Market Revenue (million) Forecast, by Application 2020 & 2033
- Table 18: Rest of South America US Activated Carbon Market Revenue (million) Forecast, by Application 2020 & 2033
- Table 19: Global US Activated Carbon Market Revenue million Forecast, by Product Type 2020 & 2033
- Table 20: Global US Activated Carbon Market Revenue million Forecast, by Application 2020 & 2033
- Table 21: Global US Activated Carbon Market Revenue million Forecast, by End-user Industry 2020 & 2033
- Table 22: Global US Activated Carbon Market Revenue million Forecast, by Country 2020 & 2033
- Table 23: United Kingdom US Activated Carbon Market Revenue (million) Forecast, by Application 2020 & 2033
- Table 24: Germany US Activated Carbon Market Revenue (million) Forecast, by Application 2020 & 2033
- Table 25: France US Activated Carbon Market Revenue (million) Forecast, by Application 2020 & 2033
- Table 26: Italy US Activated Carbon Market Revenue (million) Forecast, by Application 2020 & 2033
- Table 27: Spain US Activated Carbon Market Revenue (million) Forecast, by Application 2020 & 2033
- Table 28: Russia US Activated Carbon Market Revenue (million) Forecast, by Application 2020 & 2033
- Table 29: Benelux US Activated Carbon Market Revenue (million) Forecast, by Application 2020 & 2033
- Table 30: Nordics US Activated Carbon Market Revenue (million) Forecast, by Application 2020 & 2033
- Table 31: Rest of Europe US Activated Carbon Market Revenue (million) Forecast, by Application 2020 & 2033
- Table 32: Global US Activated Carbon Market Revenue million Forecast, by Product Type 2020 & 2033
- Table 33: Global US Activated Carbon Market Revenue million Forecast, by Application 2020 & 2033
- Table 34: Global US Activated Carbon Market Revenue million Forecast, by End-user Industry 2020 & 2033
- Table 35: Global US Activated Carbon Market Revenue million Forecast, by Country 2020 & 2033
- Table 36: Turkey US Activated Carbon Market Revenue (million) Forecast, by Application 2020 & 2033
- Table 37: Israel US Activated Carbon Market Revenue (million) Forecast, by Application 2020 & 2033
- Table 38: GCC US Activated Carbon Market Revenue (million) Forecast, by Application 2020 & 2033
- Table 39: North Africa US Activated Carbon Market Revenue (million) Forecast, by Application 2020 & 2033
- Table 40: South Africa US Activated Carbon Market Revenue (million) Forecast, by Application 2020 & 2033
- Table 41: Rest of Middle East & Africa US Activated Carbon Market Revenue (million) Forecast, by Application 2020 & 2033
- Table 42: Global US Activated Carbon Market Revenue million Forecast, by Product Type 2020 & 2033
- Table 43: Global US Activated Carbon Market Revenue million Forecast, by Application 2020 & 2033
- Table 44: Global US Activated Carbon Market Revenue million Forecast, by End-user Industry 2020 & 2033
- Table 45: Global US Activated Carbon Market Revenue million Forecast, by Country 2020 & 2033
- Table 46: China US Activated Carbon Market Revenue (million) Forecast, by Application 2020 & 2033
- Table 47: India US Activated Carbon Market Revenue (million) Forecast, by Application 2020 & 2033
- Table 48: Japan US Activated Carbon Market Revenue (million) Forecast, by Application 2020 & 2033
- Table 49: South Korea US Activated Carbon Market Revenue (million) Forecast, by Application 2020 & 2033
- Table 50: ASEAN US Activated Carbon Market Revenue (million) Forecast, by Application 2020 & 2033
- Table 51: Oceania US Activated Carbon Market Revenue (million) Forecast, by Application 2020 & 2033
- Table 52: Rest of Asia Pacific US Activated Carbon Market Revenue (million) Forecast, by Application 2020 & 2033
Frequently Asked Questions
1. What is the projected Compound Annual Growth Rate (CAGR) of the US Activated Carbon Market?
The projected CAGR is approximately 8.8%.
2. Which companies are prominent players in the US Activated Carbon Market?
Key companies in the market include CarbUSA, Carbon Activated Corporation, Advanced Emissions Solutions Inc, CPL Activated Carbons, KURARAY CO LTD, JACOBI CARBONS GROUP, Evoqua Water Technologies LLC, Cabot Corporation, Prominent Systems Inc, Calgon Carbon Corporation, Ingevity, KUREHA CORPORATION, Veolia*List Not Exhaustive, Donau Chemie AG, Albemarle Corporation, PURAGEN ACTIVATED CARBONS.
3. What are the main segments of the US Activated Carbon Market?
The market segments include Product Type, Application, End-user Industry.
4. Can you provide details about the market size?
The market size is estimated to be USD 1214.47 million as of 2022.
5. What are some drivers contributing to market growth?
; Conformance to Stringent Environmental Regulations In Water Treatment Applications; Augmenting Prominence for Air Pollution Control (Especially Mercury Removal).
6. What are the notable trends driving market growth?
Emerging Applications in the Medical and Pharmaceutical Sector.
7. Are there any restraints impacting market growth?
; Narrower Markets Due to Increased Costs of Some Grades of Activated Carbon; Threat of Substitutes Like Silica Gel and Supersand.
8. Can you provide examples of recent developments in the market?
N/A
9. What pricing options are available for accessing the report?
Pricing options include single-user, multi-user, and enterprise licenses priced at USD 3800, USD 4500, and USD 5800 respectively.
10. Is the market size provided in terms of value or volume?
The market size is provided in terms of value, measured in million.
11. Are there any specific market keywords associated with the report?
Yes, the market keyword associated with the report is "US Activated Carbon Market," which aids in identifying and referencing the specific market segment covered.
12. How do I determine which pricing option suits my needs best?
The pricing options vary based on user requirements and access needs. Individual users may opt for single-user licenses, while businesses requiring broader access may choose multi-user or enterprise licenses for cost-effective access to the report.
13. Are there any additional resources or data provided in the US Activated Carbon Market report?
While the report offers comprehensive insights, it's advisable to review the specific contents or supplementary materials provided to ascertain if additional resources or data are available.
14. How can I stay updated on further developments or reports in the US Activated Carbon Market?
To stay informed about further developments, trends, and reports in the US Activated Carbon Market, consider subscribing to industry newsletters, following relevant companies and organizations, or regularly checking reputable industry news sources and publications.
Methodology
Step 1 - Identification of Relevant Samples Size from Population Database


Step 2 - Approaches for Defining Global Market Size (Value, Volume* & Price*)

Note*: In applicable scenarios
Step 3 - Data Sources
Primary Research
- Web Analytics
- Survey Reports
- Research Institute
- Latest Research Reports
- Opinion Leaders
Secondary Research
- Annual Reports
- White Paper
- Latest Press Release
- Industry Association
- Paid Database
- Investor Presentations

Step 4 - Data Triangulation
Involves using different sources of information in order to increase the validity of a study
These sources are likely to be stakeholders in a program - participants, other researchers, program staff, other community members, and so on.
Then we put all data in single framework & apply various statistical tools to find out the dynamic on the market.
During the analysis stage, feedback from the stakeholder groups would be compared to determine areas of agreement as well as areas of divergence