

Key Insights
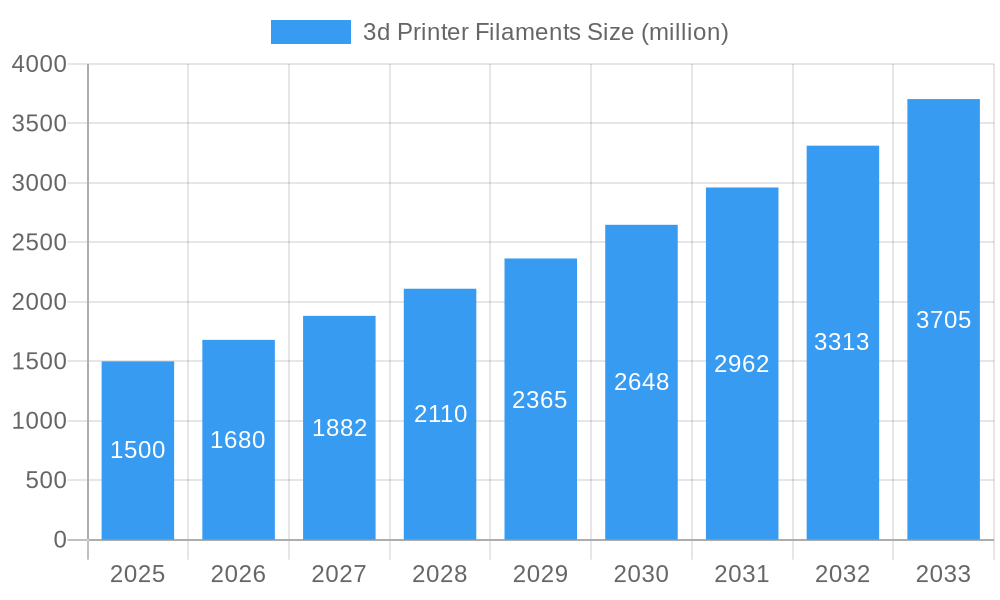
The 3D printer filament market is experiencing robust growth, driven by the increasing adoption of additive manufacturing across diverse sectors. The market, estimated at $1.5 billion in 2025, is projected to expand significantly over the forecast period (2025-2033). This growth is fueled by several key factors: the rising demand for customized and complex parts in industries like aerospace, automotive, and healthcare; the increasing affordability and accessibility of 3D printers; and the development of new filament materials with enhanced properties like strength, flexibility, and biocompatibility. Furthermore, the trend towards on-demand manufacturing and the growing focus on sustainability are contributing to market expansion. Key players like Stratasys, EOS Group, and BASF are driving innovation by introducing new filament types and expanding their product portfolios. However, factors such as the fluctuating prices of raw materials and the potential for market saturation in certain segments could pose challenges to sustained growth.
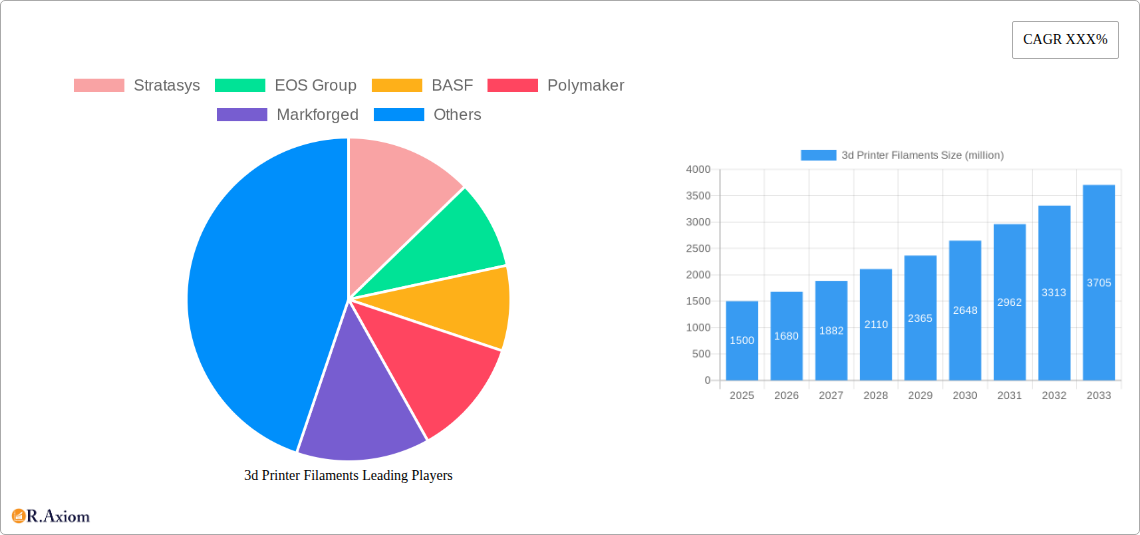
3d Printer Filaments Market Size (In Billion)
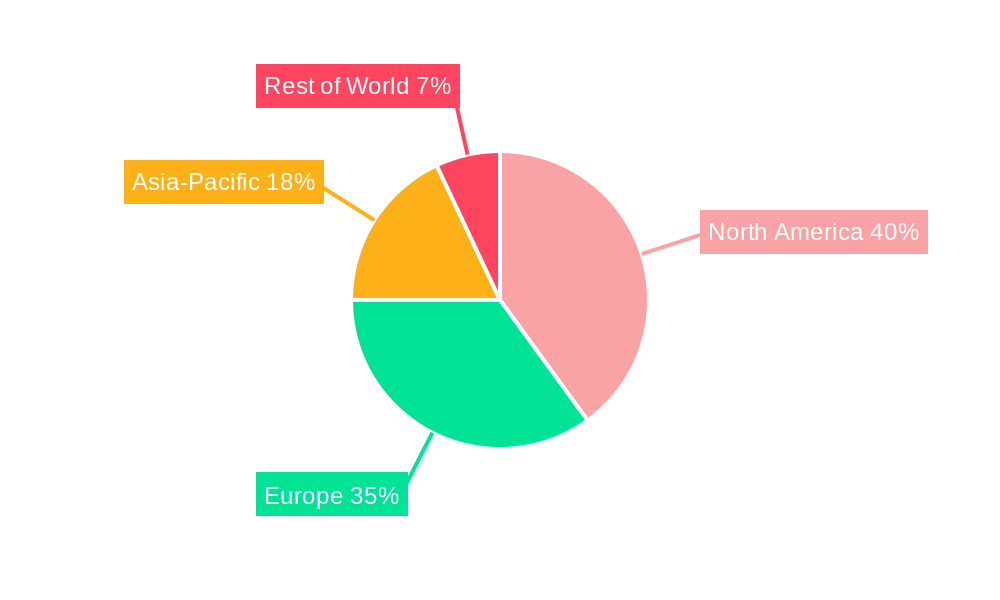
Competition within the 3D printer filament market is intense, with a diverse range of established players and emerging companies vying for market share. While major players like Stratasys and 3D Systems hold significant positions, smaller companies are rapidly innovating and capturing niche markets through specialized filaments and competitive pricing. The market is segmented by material type (PLA, ABS, PETG, TPU, etc.), application (prototyping, tooling, end-use parts), and geographic region. North America and Europe currently dominate the market, but regions like Asia-Pacific are showing rapid growth potential, fueled by increasing industrialization and government support for additive manufacturing initiatives. The future of the market hinges on the continued development of advanced filament materials, the expansion of 3D printing applications, and the overall maturation of the additive manufacturing industry. A conservative estimate for the CAGR (assuming a moderate growth trajectory given potential market saturation and price fluctuations) would be around 12% over the forecast period.
3d Printer Filaments Company Market Share
3D Printer Filaments Market Report: 2019-2033
This comprehensive report provides an in-depth analysis of the global 3D printer filaments market, offering valuable insights for industry stakeholders, investors, and businesses involved in additive manufacturing. The report covers the period from 2019 to 2033, with a focus on the forecast period of 2025-2033 and a base year of 2025. The market is valued at approximately $XX million in 2025 and is projected to reach $XX million by 2033, exhibiting a CAGR of XX%.
3D Printer Filaments Market Concentration & Innovation
This section analyzes the competitive landscape of the 3D printer filaments market, examining market concentration, innovation drivers, regulatory frameworks, product substitutes, end-user trends, and mergers & acquisitions (M&A) activities.
The market is characterized by a moderately concentrated structure, with several major players holding significant market shares. Stratasys, BASF, and 3D Systems are among the leading players, collectively accounting for an estimated XX% of the global market share in 2025. However, numerous smaller companies, including Polymaker, Creality, and MatterHackers, also contribute significantly to market volume and innovation.
Key Market Dynamics:
- Innovation Drivers: Continuous advancements in filament materials (e.g., high-temperature plastics, biocompatible materials, conductive filaments) are driving market growth. New printing technologies and evolving applications are further fueling demand.
- Regulatory Frameworks: Government regulations concerning material safety and environmental impact are shaping the market. Compliance with these regulations is a key challenge for manufacturers.
- Product Substitutes: While 3D printing filaments are the dominant material for Fused Deposition Modeling (FDM) and other additive manufacturing processes, competition exists from other materials and technologies like powder-based additive manufacturing.
- End-User Trends: The increasing adoption of 3D printing across various industries, including healthcare, aerospace, and consumer goods, is a primary growth driver.
- M&A Activities: The market has witnessed several significant M&A activities in recent years, with deal values ranging from $XX million to $XX million. These acquisitions have helped larger companies expand their product portfolios and market reach. For example, the merger of [Company A] and [Company B] in [Year] significantly impacted market consolidation.
3D Printer Filaments Industry Trends & Insights
This section delves into the key industry trends and insights shaping the 3D printer filaments market. The market's growth is fueled by several factors, including the increasing adoption of 3D printing across various sectors, advancements in material science leading to the development of new and improved filaments, and the decreasing cost of 3D printers making them more accessible to both businesses and consumers. Technological disruptions, such as the emergence of new printing technologies and the development of innovative filament materials, are significantly impacting the market landscape.
Consumer preferences are increasingly shifting towards filaments with enhanced properties, such as higher strength, durability, and biocompatibility. The competitive dynamics are characterized by intense competition among both established players and emerging companies, leading to price wars and innovation drives. The market penetration of 3D printing filaments is increasing rapidly, with a projected penetration rate of XX% by 2033. The compounded annual growth rate (CAGR) for the forecast period (2025-2033) is estimated to be XX%, reflecting the strong growth trajectory of the industry.
Dominant Markets & Segments in 3D Printer Filaments
North America currently holds the largest market share, driven by factors such as a strong presence of key industry players, high adoption rates of 3D printing technology, and substantial investments in research and development. However, the Asia-Pacific region is expected to experience the fastest growth over the forecast period, owing to the rapid expansion of the manufacturing sector and the increasing demand for personalized and customized products.
Key Drivers of Regional Dominance:
- North America: Strong presence of established 3D printing companies, high technology adoption rate, supportive government policies.
- Asia-Pacific: Rapid growth of manufacturing industries, rising demand for customized products, and government initiatives promoting technological advancements.
- Europe: Growing adoption of 3D printing in various sectors such as aerospace and healthcare, coupled with a well-established manufacturing base.
3D Printer Filaments Product Developments
Recent innovations in 3D printer filaments include the development of high-performance materials like carbon fiber-reinforced filaments, flexible TPU filaments, and biocompatible filaments for medical applications. These advancements enhance the functionality and applications of 3D printed products, leading to broader adoption across various industries. Competition is largely driven by the development of unique materials with enhanced properties, improved printing performance, and environmentally friendly options. The market's focus on sustainability is also leading to the introduction of recycled and biodegradable filaments.
Report Scope & Segmentation Analysis
This report segments the 3D printer filaments market by material type (PLA, ABS, PETG, Nylon, etc.), application (prototyping, tooling, end-use parts, etc.), printer type (FDM, SLA, SLS, etc.), and region (North America, Europe, Asia-Pacific, etc.). Each segment exhibits varying growth rates and competitive landscapes. For instance, the PLA filament segment is projected to dominate due to its cost-effectiveness and ease of use. The growth projections and market sizes for each segment are detailed within the complete report.
Key Drivers of 3D Printer Filaments Growth
Several factors contribute to the growth of the 3D printer filaments market. Technological advancements leading to improved material properties and printing processes are a key driver. The decreasing cost of 3D printers is making the technology more accessible to a broader range of users, further fueling demand. Moreover, the increasing adoption of 3D printing across various industries, from prototyping to end-use part production, is significantly driving market expansion. Government initiatives promoting additive manufacturing also contribute to this growth.
Challenges in the 3D Printer Filaments Sector
The 3D printer filaments sector faces challenges including the need for consistent material quality control, potential supply chain disruptions affecting raw material availability, and fierce competition among numerous players leading to pricing pressures. Stringent regulatory requirements related to material safety and environmental impact also pose challenges for manufacturers. These factors can collectively impact profitability and growth potential. For instance, a recent shortage of a key raw material resulted in a XX% increase in filament prices.
Emerging Opportunities in 3D Printer Filaments
Emerging opportunities lie in the development of specialized filaments for niche applications, such as high-temperature resistant filaments for aerospace components or biocompatible filaments for medical implants. The increasing demand for sustainable and environmentally friendly filaments presents another significant opportunity for growth. Expanding into new geographic markets with growing adoption of 3D printing technology also offers substantial potential.
Leading Players in the 3D Printer Filaments Market
- Stratasys
- EOS Group
- BASF
- Polymaker
- Markforged
- Creality
- MatterHackers
- SeeMeCNC
- Geeetech
- Repraper
- ASAPTech
- Elephant Technology
- Cutequeen
- MeltInk
- OHFILA
- GP3D
- HATCHBOX 3D Printer
- WYZworks
- 3D Systems
- Generic
- ESUN
- ORD Solutions 3D Printer Filament
- 3Dom USA
- Jet
- ColorFabb
- Raise3D
Key Developments in 3D Printer Filaments Industry
- 2022 Q4: Polymaker launched a new high-temperature filament.
- 2023 Q1: Stratasys announced a strategic partnership for filament distribution.
- 2023 Q2: BASF introduced a new bio-based filament.
- (Further developments will be included in the full report)
Strategic Outlook for 3D Printer Filaments Market
The 3D printer filaments market is poised for continued growth, driven by technological advancements, increasing adoption across diverse industries, and the emergence of new applications. The focus on sustainable and specialized filaments will shape future market dynamics. Companies that can innovate in material science, optimize supply chains, and cater to evolving customer needs are expected to thrive in this dynamic market. The long-term outlook remains positive, with significant potential for market expansion.
3d Printer Filaments Segmentation
-
1. Application
- 1.1. Medical
- 1.2. Automotive
- 1.3. Aerospace
- 1.4. Manufacturing
- 1.5. Military
- 1.6. Others
-
2. Type
- 2.1. HIPS
- 2.2. PVA
- 2.3. PET (CEP)
- 2.4. Metal
- 2.5. Others
3d Printer Filaments Segmentation By Geography
-
1. North America
- 1.1. United States
- 1.2. Canada
- 1.3. Mexico
-
2. South America
- 2.1. Brazil
- 2.2. Argentina
- 2.3. Rest of South America
-
3. Europe
- 3.1. United Kingdom
- 3.2. Germany
- 3.3. France
- 3.4. Italy
- 3.5. Spain
- 3.6. Russia
- 3.7. Benelux
- 3.8. Nordics
- 3.9. Rest of Europe
-
4. Middle East & Africa
- 4.1. Turkey
- 4.2. Israel
- 4.3. GCC
- 4.4. North Africa
- 4.5. South Africa
- 4.6. Rest of Middle East & Africa
-
5. Asia Pacific
- 5.1. China
- 5.2. India
- 5.3. Japan
- 5.4. South Korea
- 5.5. ASEAN
- 5.6. Oceania
- 5.7. Rest of Asia Pacific
3d Printer Filaments Regional Market Share
Geographic Coverage of 3d Printer Filaments
3d Printer Filaments REPORT HIGHLIGHTS
| Aspects | Details |
|---|---|
| Study Period | 2020-2034 |
| Base Year | 2025 |
| Estimated Year | 2026 |
| Forecast Period | 2026-2034 |
| Historical Period | 2020-2025 |
| Growth Rate | CAGR of 18.8% from 2020-2034 |
| Segmentation |
|
Table of Contents
- 1. Introduction
- 1.1. Research Scope
- 1.2. Market Segmentation
- 1.3. Research Objective
- 1.4. Definitions and Assumptions
- 2. Executive Summary
- 2.1. Market Snapshot
- 3. Market Dynamics
- 3.1. Market Drivers
- 3.2. Market Restrains
- 3.3. Market Trends
- 3.4. Market Opportunities
- 4. Market Factor Analysis
- 4.1. Porters Five Forces
- 4.1.1. Bargaining Power of Suppliers
- 4.1.2. Bargaining Power of Buyers
- 4.1.3. Threat of New Entrants
- 4.1.4. Threat of Substitutes
- 4.1.5. Competitive Rivalry
- 4.2. PESTEL analysis
- 4.3. BCG Analysis
- 4.3.1. Stars (High Growth, High Market Share)
- 4.3.2. Cash Cows (Low Growth, High Market Share)
- 4.3.3. Question Mark (High Growth, Low Market Share)
- 4.3.4. Dogs (Low Growth, Low Market Share)
- 4.4. Ansoff Matrix Analysis
- 4.5. Supply Chain Analysis
- 4.6. Regulatory Landscape
- 4.7. Current Market Potential and Opportunity Assessment (TAM–SAM–SOM Framework)
- 4.8. RAX Analyst Note
- 4.1. Porters Five Forces
- 5. Market Analysis, Insights and Forecast 2021-2033
- 5.1. Market Analysis, Insights and Forecast - by Application
- 5.1.1. Medical
- 5.1.2. Automotive
- 5.1.3. Aerospace
- 5.1.4. Manufacturing
- 5.1.5. Military
- 5.1.6. Others
- 5.2. Market Analysis, Insights and Forecast - by Type
- 5.2.1. HIPS
- 5.2.2. PVA
- 5.2.3. PET (CEP)
- 5.2.4. Metal
- 5.2.5. Others
- 5.3. Market Analysis, Insights and Forecast - by Region
- 5.3.1. North America
- 5.3.2. South America
- 5.3.3. Europe
- 5.3.4. Middle East & Africa
- 5.3.5. Asia Pacific
- 5.1. Market Analysis, Insights and Forecast - by Application
- 6. Global 3d Printer Filaments Analysis, Insights and Forecast, 2021-2033
- 6.1. Market Analysis, Insights and Forecast - by Application
- 6.1.1. Medical
- 6.1.2. Automotive
- 6.1.3. Aerospace
- 6.1.4. Manufacturing
- 6.1.5. Military
- 6.1.6. Others
- 6.2. Market Analysis, Insights and Forecast - by Type
- 6.2.1. HIPS
- 6.2.2. PVA
- 6.2.3. PET (CEP)
- 6.2.4. Metal
- 6.2.5. Others
- 6.1. Market Analysis, Insights and Forecast - by Application
- 7. North America 3d Printer Filaments Analysis, Insights and Forecast, 2020-2032
- 7.1. Market Analysis, Insights and Forecast - by Application
- 7.1.1. Medical
- 7.1.2. Automotive
- 7.1.3. Aerospace
- 7.1.4. Manufacturing
- 7.1.5. Military
- 7.1.6. Others
- 7.2. Market Analysis, Insights and Forecast - by Type
- 7.2.1. HIPS
- 7.2.2. PVA
- 7.2.3. PET (CEP)
- 7.2.4. Metal
- 7.2.5. Others
- 7.1. Market Analysis, Insights and Forecast - by Application
- 8. South America 3d Printer Filaments Analysis, Insights and Forecast, 2020-2032
- 8.1. Market Analysis, Insights and Forecast - by Application
- 8.1.1. Medical
- 8.1.2. Automotive
- 8.1.3. Aerospace
- 8.1.4. Manufacturing
- 8.1.5. Military
- 8.1.6. Others
- 8.2. Market Analysis, Insights and Forecast - by Type
- 8.2.1. HIPS
- 8.2.2. PVA
- 8.2.3. PET (CEP)
- 8.2.4. Metal
- 8.2.5. Others
- 8.1. Market Analysis, Insights and Forecast - by Application
- 9. Europe 3d Printer Filaments Analysis, Insights and Forecast, 2020-2032
- 9.1. Market Analysis, Insights and Forecast - by Application
- 9.1.1. Medical
- 9.1.2. Automotive
- 9.1.3. Aerospace
- 9.1.4. Manufacturing
- 9.1.5. Military
- 9.1.6. Others
- 9.2. Market Analysis, Insights and Forecast - by Type
- 9.2.1. HIPS
- 9.2.2. PVA
- 9.2.3. PET (CEP)
- 9.2.4. Metal
- 9.2.5. Others
- 9.1. Market Analysis, Insights and Forecast - by Application
- 10. Middle East & Africa 3d Printer Filaments Analysis, Insights and Forecast, 2020-2032
- 10.1. Market Analysis, Insights and Forecast - by Application
- 10.1.1. Medical
- 10.1.2. Automotive
- 10.1.3. Aerospace
- 10.1.4. Manufacturing
- 10.1.5. Military
- 10.1.6. Others
- 10.2. Market Analysis, Insights and Forecast - by Type
- 10.2.1. HIPS
- 10.2.2. PVA
- 10.2.3. PET (CEP)
- 10.2.4. Metal
- 10.2.5. Others
- 10.1. Market Analysis, Insights and Forecast - by Application
- 11. Asia Pacific 3d Printer Filaments Analysis, Insights and Forecast, 2020-2032
- 11.1. Market Analysis, Insights and Forecast - by Application
- 11.1.1. Medical
- 11.1.2. Automotive
- 11.1.3. Aerospace
- 11.1.4. Manufacturing
- 11.1.5. Military
- 11.1.6. Others
- 11.2. Market Analysis, Insights and Forecast - by Type
- 11.2.1. HIPS
- 11.2.2. PVA
- 11.2.3. PET (CEP)
- 11.2.4. Metal
- 11.2.5. Others
- 11.1. Market Analysis, Insights and Forecast - by Application
- 12. Competitive Analysis
- 12.1. Company Profiles
- 12.1.1 Stratasys
- 12.1.1.1. Company Overview
- 12.1.1.2. Products
- 12.1.1.3. Company Financials
- 12.1.1.4. SWOT Analysis
- 12.1.2 EOS Group
- 12.1.2.1. Company Overview
- 12.1.2.2. Products
- 12.1.2.3. Company Financials
- 12.1.2.4. SWOT Analysis
- 12.1.3 BASF
- 12.1.3.1. Company Overview
- 12.1.3.2. Products
- 12.1.3.3. Company Financials
- 12.1.3.4. SWOT Analysis
- 12.1.4 Polymaker
- 12.1.4.1. Company Overview
- 12.1.4.2. Products
- 12.1.4.3. Company Financials
- 12.1.4.4. SWOT Analysis
- 12.1.5 Markforged
- 12.1.5.1. Company Overview
- 12.1.5.2. Products
- 12.1.5.3. Company Financials
- 12.1.5.4. SWOT Analysis
- 12.1.6 Creality
- 12.1.6.1. Company Overview
- 12.1.6.2. Products
- 12.1.6.3. Company Financials
- 12.1.6.4. SWOT Analysis
- 12.1.7 MatterHackers
- 12.1.7.1. Company Overview
- 12.1.7.2. Products
- 12.1.7.3. Company Financials
- 12.1.7.4. SWOT Analysis
- 12.1.8 SeeMeCNC
- 12.1.8.1. Company Overview
- 12.1.8.2. Products
- 12.1.8.3. Company Financials
- 12.1.8.4. SWOT Analysis
- 12.1.9 Geeetech
- 12.1.9.1. Company Overview
- 12.1.9.2. Products
- 12.1.9.3. Company Financials
- 12.1.9.4. SWOT Analysis
- 12.1.10 Repraper
- 12.1.10.1. Company Overview
- 12.1.10.2. Products
- 12.1.10.3. Company Financials
- 12.1.10.4. SWOT Analysis
- 12.1.11 ASAPTech
- 12.1.11.1. Company Overview
- 12.1.11.2. Products
- 12.1.11.3. Company Financials
- 12.1.11.4. SWOT Analysis
- 12.1.12 Elephant Technology
- 12.1.12.1. Company Overview
- 12.1.12.2. Products
- 12.1.12.3. Company Financials
- 12.1.12.4. SWOT Analysis
- 12.1.13 Cutequeen
- 12.1.13.1. Company Overview
- 12.1.13.2. Products
- 12.1.13.3. Company Financials
- 12.1.13.4. SWOT Analysis
- 12.1.14 MeltInk
- 12.1.14.1. Company Overview
- 12.1.14.2. Products
- 12.1.14.3. Company Financials
- 12.1.14.4. SWOT Analysis
- 12.1.15 OHFILA
- 12.1.15.1. Company Overview
- 12.1.15.2. Products
- 12.1.15.3. Company Financials
- 12.1.15.4. SWOT Analysis
- 12.1.16 GP3D
- 12.1.16.1. Company Overview
- 12.1.16.2. Products
- 12.1.16.3. Company Financials
- 12.1.16.4. SWOT Analysis
- 12.1.17 HATCHBOX 3D Printer
- 12.1.17.1. Company Overview
- 12.1.17.2. Products
- 12.1.17.3. Company Financials
- 12.1.17.4. SWOT Analysis
- 12.1.18 WYZworks
- 12.1.18.1. Company Overview
- 12.1.18.2. Products
- 12.1.18.3. Company Financials
- 12.1.18.4. SWOT Analysis
- 12.1.19 3D Systems
- 12.1.19.1. Company Overview
- 12.1.19.2. Products
- 12.1.19.3. Company Financials
- 12.1.19.4. SWOT Analysis
- 12.1.20 Generic
- 12.1.20.1. Company Overview
- 12.1.20.2. Products
- 12.1.20.3. Company Financials
- 12.1.20.4. SWOT Analysis
- 12.1.21 ESUN
- 12.1.21.1. Company Overview
- 12.1.21.2. Products
- 12.1.21.3. Company Financials
- 12.1.21.4. SWOT Analysis
- 12.1.22 ORD Solutions 3D Printer Filament
- 12.1.22.1. Company Overview
- 12.1.22.2. Products
- 12.1.22.3. Company Financials
- 12.1.22.4. SWOT Analysis
- 12.1.23 3Dom USA
- 12.1.23.1. Company Overview
- 12.1.23.2. Products
- 12.1.23.3. Company Financials
- 12.1.23.4. SWOT Analysis
- 12.1.24 Jet
- 12.1.24.1. Company Overview
- 12.1.24.2. Products
- 12.1.24.3. Company Financials
- 12.1.24.4. SWOT Analysis
- 12.1.25 ColorFabb
- 12.1.25.1. Company Overview
- 12.1.25.2. Products
- 12.1.25.3. Company Financials
- 12.1.25.4. SWOT Analysis
- 12.1.26 Raise3D
- 12.1.26.1. Company Overview
- 12.1.26.2. Products
- 12.1.26.3. Company Financials
- 12.1.26.4. SWOT Analysis
- 12.1.1 Stratasys
- 12.2. Market Entropy
- 12.2.1 Company's Key Areas Served
- 12.2.2 Recent Developments
- 12.3. Company Market Share Analysis 2025
- 12.3.1 Top 5 Companies Market Share Analysis
- 12.3.2 Top 3 Companies Market Share Analysis
- 12.4. List of Potential Customers
- 13. Research Methodology
List of Figures
- Figure 1: Global 3d Printer Filaments Revenue Breakdown (undefined, %) by Region 2025 & 2033
- Figure 2: North America 3d Printer Filaments Revenue (undefined), by Application 2025 & 2033
- Figure 3: North America 3d Printer Filaments Revenue Share (%), by Application 2025 & 2033
- Figure 4: North America 3d Printer Filaments Revenue (undefined), by Type 2025 & 2033
- Figure 5: North America 3d Printer Filaments Revenue Share (%), by Type 2025 & 2033
- Figure 6: North America 3d Printer Filaments Revenue (undefined), by Country 2025 & 2033
- Figure 7: North America 3d Printer Filaments Revenue Share (%), by Country 2025 & 2033
- Figure 8: South America 3d Printer Filaments Revenue (undefined), by Application 2025 & 2033
- Figure 9: South America 3d Printer Filaments Revenue Share (%), by Application 2025 & 2033
- Figure 10: South America 3d Printer Filaments Revenue (undefined), by Type 2025 & 2033
- Figure 11: South America 3d Printer Filaments Revenue Share (%), by Type 2025 & 2033
- Figure 12: South America 3d Printer Filaments Revenue (undefined), by Country 2025 & 2033
- Figure 13: South America 3d Printer Filaments Revenue Share (%), by Country 2025 & 2033
- Figure 14: Europe 3d Printer Filaments Revenue (undefined), by Application 2025 & 2033
- Figure 15: Europe 3d Printer Filaments Revenue Share (%), by Application 2025 & 2033
- Figure 16: Europe 3d Printer Filaments Revenue (undefined), by Type 2025 & 2033
- Figure 17: Europe 3d Printer Filaments Revenue Share (%), by Type 2025 & 2033
- Figure 18: Europe 3d Printer Filaments Revenue (undefined), by Country 2025 & 2033
- Figure 19: Europe 3d Printer Filaments Revenue Share (%), by Country 2025 & 2033
- Figure 20: Middle East & Africa 3d Printer Filaments Revenue (undefined), by Application 2025 & 2033
- Figure 21: Middle East & Africa 3d Printer Filaments Revenue Share (%), by Application 2025 & 2033
- Figure 22: Middle East & Africa 3d Printer Filaments Revenue (undefined), by Type 2025 & 2033
- Figure 23: Middle East & Africa 3d Printer Filaments Revenue Share (%), by Type 2025 & 2033
- Figure 24: Middle East & Africa 3d Printer Filaments Revenue (undefined), by Country 2025 & 2033
- Figure 25: Middle East & Africa 3d Printer Filaments Revenue Share (%), by Country 2025 & 2033
- Figure 26: Asia Pacific 3d Printer Filaments Revenue (undefined), by Application 2025 & 2033
- Figure 27: Asia Pacific 3d Printer Filaments Revenue Share (%), by Application 2025 & 2033
- Figure 28: Asia Pacific 3d Printer Filaments Revenue (undefined), by Type 2025 & 2033
- Figure 29: Asia Pacific 3d Printer Filaments Revenue Share (%), by Type 2025 & 2033
- Figure 30: Asia Pacific 3d Printer Filaments Revenue (undefined), by Country 2025 & 2033
- Figure 31: Asia Pacific 3d Printer Filaments Revenue Share (%), by Country 2025 & 2033
List of Tables
- Table 1: Global 3d Printer Filaments Revenue undefined Forecast, by Application 2020 & 2033
- Table 2: Global 3d Printer Filaments Revenue undefined Forecast, by Type 2020 & 2033
- Table 3: Global 3d Printer Filaments Revenue undefined Forecast, by Region 2020 & 2033
- Table 4: Global 3d Printer Filaments Revenue undefined Forecast, by Application 2020 & 2033
- Table 5: Global 3d Printer Filaments Revenue undefined Forecast, by Type 2020 & 2033
- Table 6: Global 3d Printer Filaments Revenue undefined Forecast, by Country 2020 & 2033
- Table 7: United States 3d Printer Filaments Revenue (undefined) Forecast, by Application 2020 & 2033
- Table 8: Canada 3d Printer Filaments Revenue (undefined) Forecast, by Application 2020 & 2033
- Table 9: Mexico 3d Printer Filaments Revenue (undefined) Forecast, by Application 2020 & 2033
- Table 10: Global 3d Printer Filaments Revenue undefined Forecast, by Application 2020 & 2033
- Table 11: Global 3d Printer Filaments Revenue undefined Forecast, by Type 2020 & 2033
- Table 12: Global 3d Printer Filaments Revenue undefined Forecast, by Country 2020 & 2033
- Table 13: Brazil 3d Printer Filaments Revenue (undefined) Forecast, by Application 2020 & 2033
- Table 14: Argentina 3d Printer Filaments Revenue (undefined) Forecast, by Application 2020 & 2033
- Table 15: Rest of South America 3d Printer Filaments Revenue (undefined) Forecast, by Application 2020 & 2033
- Table 16: Global 3d Printer Filaments Revenue undefined Forecast, by Application 2020 & 2033
- Table 17: Global 3d Printer Filaments Revenue undefined Forecast, by Type 2020 & 2033
- Table 18: Global 3d Printer Filaments Revenue undefined Forecast, by Country 2020 & 2033
- Table 19: United Kingdom 3d Printer Filaments Revenue (undefined) Forecast, by Application 2020 & 2033
- Table 20: Germany 3d Printer Filaments Revenue (undefined) Forecast, by Application 2020 & 2033
- Table 21: France 3d Printer Filaments Revenue (undefined) Forecast, by Application 2020 & 2033
- Table 22: Italy 3d Printer Filaments Revenue (undefined) Forecast, by Application 2020 & 2033
- Table 23: Spain 3d Printer Filaments Revenue (undefined) Forecast, by Application 2020 & 2033
- Table 24: Russia 3d Printer Filaments Revenue (undefined) Forecast, by Application 2020 & 2033
- Table 25: Benelux 3d Printer Filaments Revenue (undefined) Forecast, by Application 2020 & 2033
- Table 26: Nordics 3d Printer Filaments Revenue (undefined) Forecast, by Application 2020 & 2033
- Table 27: Rest of Europe 3d Printer Filaments Revenue (undefined) Forecast, by Application 2020 & 2033
- Table 28: Global 3d Printer Filaments Revenue undefined Forecast, by Application 2020 & 2033
- Table 29: Global 3d Printer Filaments Revenue undefined Forecast, by Type 2020 & 2033
- Table 30: Global 3d Printer Filaments Revenue undefined Forecast, by Country 2020 & 2033
- Table 31: Turkey 3d Printer Filaments Revenue (undefined) Forecast, by Application 2020 & 2033
- Table 32: Israel 3d Printer Filaments Revenue (undefined) Forecast, by Application 2020 & 2033
- Table 33: GCC 3d Printer Filaments Revenue (undefined) Forecast, by Application 2020 & 2033
- Table 34: North Africa 3d Printer Filaments Revenue (undefined) Forecast, by Application 2020 & 2033
- Table 35: South Africa 3d Printer Filaments Revenue (undefined) Forecast, by Application 2020 & 2033
- Table 36: Rest of Middle East & Africa 3d Printer Filaments Revenue (undefined) Forecast, by Application 2020 & 2033
- Table 37: Global 3d Printer Filaments Revenue undefined Forecast, by Application 2020 & 2033
- Table 38: Global 3d Printer Filaments Revenue undefined Forecast, by Type 2020 & 2033
- Table 39: Global 3d Printer Filaments Revenue undefined Forecast, by Country 2020 & 2033
- Table 40: China 3d Printer Filaments Revenue (undefined) Forecast, by Application 2020 & 2033
- Table 41: India 3d Printer Filaments Revenue (undefined) Forecast, by Application 2020 & 2033
- Table 42: Japan 3d Printer Filaments Revenue (undefined) Forecast, by Application 2020 & 2033
- Table 43: South Korea 3d Printer Filaments Revenue (undefined) Forecast, by Application 2020 & 2033
- Table 44: ASEAN 3d Printer Filaments Revenue (undefined) Forecast, by Application 2020 & 2033
- Table 45: Oceania 3d Printer Filaments Revenue (undefined) Forecast, by Application 2020 & 2033
- Table 46: Rest of Asia Pacific 3d Printer Filaments Revenue (undefined) Forecast, by Application 2020 & 2033
Frequently Asked Questions
1. What is the projected Compound Annual Growth Rate (CAGR) of the 3d Printer Filaments?
The projected CAGR is approximately 18.8%.
2. Which companies are prominent players in the 3d Printer Filaments?
Key companies in the market include Stratasys, EOS Group, BASF, Polymaker, Markforged, Creality, MatterHackers, SeeMeCNC, Geeetech, Repraper, ASAPTech, Elephant Technology, Cutequeen, MeltInk, OHFILA, GP3D, HATCHBOX 3D Printer, WYZworks, 3D Systems, Generic, ESUN, ORD Solutions 3D Printer Filament, 3Dom USA, Jet, ColorFabb, Raise3D.
3. What are the main segments of the 3d Printer Filaments?
The market segments include Application, Type.
4. Can you provide details about the market size?
The market size is estimated to be USD XXX N/A as of 2022.
5. What are some drivers contributing to market growth?
N/A
6. What are the notable trends driving market growth?
N/A
7. Are there any restraints impacting market growth?
N/A
8. Can you provide examples of recent developments in the market?
N/A
9. What pricing options are available for accessing the report?
Pricing options include single-user, multi-user, and enterprise licenses priced at USD 4250.00, USD 6375.00, and USD 8500.00 respectively.
10. Is the market size provided in terms of value or volume?
The market size is provided in terms of value, measured in N/A.
11. Are there any specific market keywords associated with the report?
Yes, the market keyword associated with the report is "3d Printer Filaments," which aids in identifying and referencing the specific market segment covered.
12. How do I determine which pricing option suits my needs best?
The pricing options vary based on user requirements and access needs. Individual users may opt for single-user licenses, while businesses requiring broader access may choose multi-user or enterprise licenses for cost-effective access to the report.
13. Are there any additional resources or data provided in the 3d Printer Filaments report?
While the report offers comprehensive insights, it's advisable to review the specific contents or supplementary materials provided to ascertain if additional resources or data are available.
14. How can I stay updated on further developments or reports in the 3d Printer Filaments?
To stay informed about further developments, trends, and reports in the 3d Printer Filaments, consider subscribing to industry newsletters, following relevant companies and organizations, or regularly checking reputable industry news sources and publications.
Methodology
Step 1 - Identification of Relevant Samples Size from Population Database


Step 2 - Approaches for Defining Global Market Size (Value, Volume* & Price*)

Note*: In applicable scenarios
Step 3 - Data Sources
Primary Research
- Web Analytics
- Survey Reports
- Research Institute
- Latest Research Reports
- Opinion Leaders
Secondary Research
- Annual Reports
- White Paper
- Latest Press Release
- Industry Association
- Paid Database
- Investor Presentations

Step 4 - Data Triangulation
Involves using different sources of information in order to increase the validity of a study
These sources are likely to be stakeholders in a program - participants, other researchers, program staff, other community members, and so on.
Then we put all data in single framework & apply various statistical tools to find out the dynamic on the market.
During the analysis stage, feedback from the stakeholder groups would be compared to determine areas of agreement as well as areas of divergence