

Key Insights
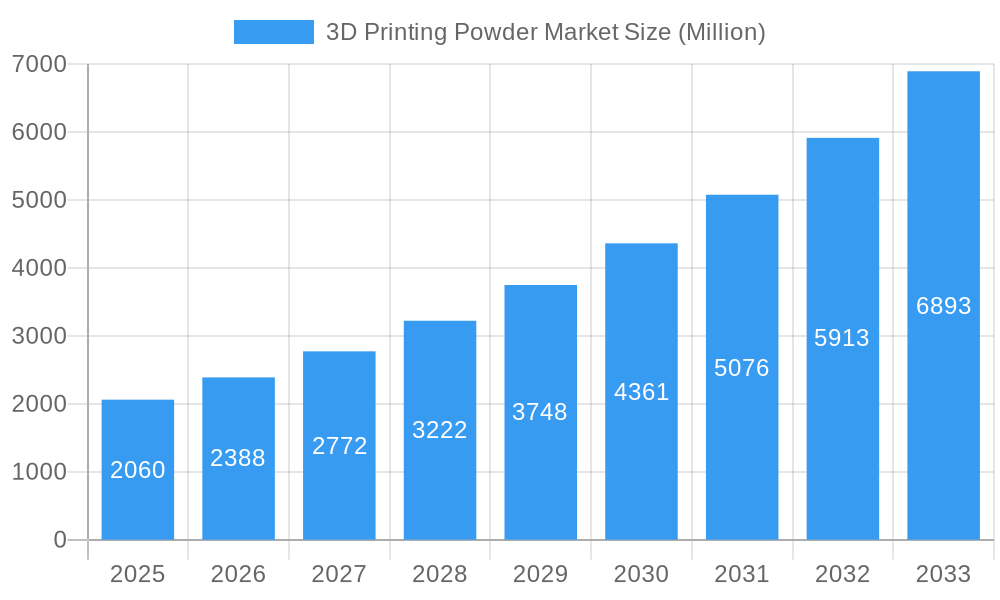
The 3D printing powder market is experiencing robust growth, projected to reach $2.06 billion in 2025 and maintain a Compound Annual Growth Rate (CAGR) exceeding 16.50% from 2025 to 2033. This expansion is fueled by several key drivers. The increasing adoption of additive manufacturing across diverse industries, including automotive, aerospace, medical, and architecture, is a primary factor. These sectors are leveraging 3D printing's ability to create complex geometries, lightweight components, and customized designs, leading to improved efficiency and reduced production costs. Furthermore, advancements in powder material science are continuously expanding the range of applications and performance capabilities of 3D-printed parts. The development of new metal alloys, high-performance polymers, and ceramic powders is broadening the market's reach into new sectors and enabling the creation of more intricate and functional products. The growing demand for prototyping and customized manufacturing further bolsters market growth. While challenges such as the relatively high cost of 3D printing and the need for specialized expertise could act as restraints, the overall market outlook remains highly positive, driven by technological advancements and increasing industry adoption.
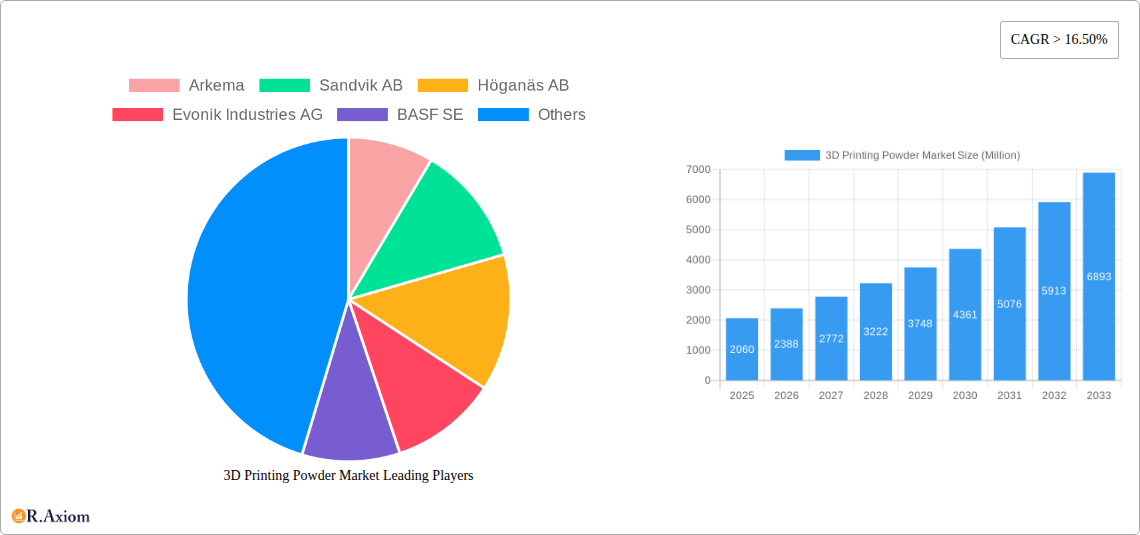
3D Printing Powder Market Market Size (In Billion)
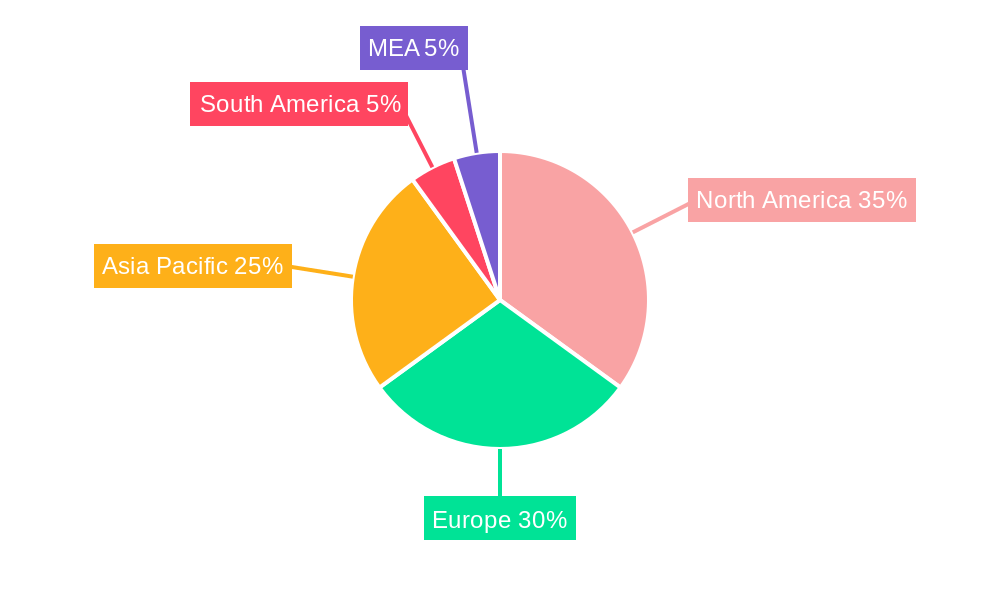
The market segmentation reveals significant opportunities within specific powder types and end-user industries. Metal powders currently dominate the market, owing to their applications in high-value industries like aerospace and automotive. However, the plastic powder segment is experiencing rapid growth, driven by cost-effectiveness and wider adoption in consumer goods and prototyping. Geographically, North America and Europe currently hold a significant market share, but the Asia-Pacific region is expected to experience the fastest growth due to rising industrialization and technological advancements in countries like China and India. Key players like Arkema, Sandvik AB, Höganäs AB, Evonik Industries AG, BASF SE, and others are actively investing in research and development, expanding their product portfolios, and pursuing strategic partnerships to capitalize on the market's growth potential. This competitive landscape fosters innovation and contributes to the overall market expansion. The forecast period of 2025-2033 anticipates continued strong growth, with the market expected to nearly triple in size by 2033. This projection underscores the significant potential for investors and companies operating within this dynamic and rapidly evolving sector.
3D Printing Powder Market Company Market Share
3D Printing Powder Market: A Comprehensive Report (2019-2033)
This in-depth report provides a comprehensive analysis of the 3D printing powder market, offering invaluable insights for industry stakeholders, investors, and researchers. The study covers the period from 2019 to 2033, with 2025 serving as the base year and the forecast period spanning 2025-2033. The report meticulously analyzes market trends, competitive dynamics, and future growth prospects across various segments, including powder type and end-user industries. Key players like Arkema, Sandvik AB, Höganäs AB, Evonik Industries AG, BASF SE, Metalysis, ERASTEEL, GKN Powder Metallurgy, and ExOne are profiled, providing a holistic view of the market landscape.
3D Printing Powder Market Concentration & Innovation
The 3D printing powder market exhibits a moderately consolidated structure, with a few major players holding significant market share. The market share of the top five players is estimated at xx% in 2025, indicating considerable competition. Innovation plays a crucial role, driven by the need for improved material properties, enhanced printing processes, and cost reduction. Key innovation drivers include the development of new powder materials with tailored properties, advancements in binder jetting and selective laser melting technologies, and the exploration of sustainable and recyclable materials. Regulatory frameworks, while evolving, generally encourage innovation through funding and supportive policies. Product substitution is a factor, with the market seeing competition from alternative 3D printing technologies and traditional manufacturing methods. End-user trends favor high-performance materials and customized solutions, particularly in sectors like aerospace and medical. M&A activity has been moderate, with deal values averaging xx Million in recent years, reflecting strategic acquisitions aimed at expanding product portfolios and market reach. Some examples of recent M&A activity include [insert specific examples with deal values, if available, otherwise state "Limited public information is currently available on specific M&A activities within this market"].
3D Printing Powder Market Industry Trends & Insights
The 3D printing powder market is experiencing robust growth, driven by increasing adoption across diverse industries. The market is projected to achieve a CAGR of xx% during the forecast period (2025-2033), reaching a market value of xx Million by 2033. Key growth drivers include the rising demand for customized products, the need for lightweight and high-strength components, the increasing adoption of additive manufacturing technologies, and government initiatives promoting advanced manufacturing. Technological disruptions, such as the development of advanced materials and printing processes, are further accelerating market expansion. Consumer preferences are shifting towards sustainable and environmentally friendly materials, influencing the demand for bio-based and recyclable powders. Competitive dynamics are characterized by intense competition among established players and emerging startups, leading to continuous innovation and product differentiation. Market penetration varies across different end-user industries, with the automotive and aerospace sectors demonstrating the highest adoption rates, reflecting the need for lightweight and high-performance parts.
Dominant Markets & Segments in 3D Printing Powder Market
The global 3D printing powder market is geographically diverse, with significant growth opportunities across various regions. However, [insert name of region, e.g., North America] currently holds the largest market share, driven by factors like strong industrial base, technological advancements, and high adoption rates in key sectors such as aerospace and automotive. Within powder types, metal powders dominate the market owing to their extensive applications in high-performance components. The leading segment within end-user industries is the aerospace and defense sector due to its demand for highly specialized and lightweight components.
- Key Drivers for [Leading Region]:
- Strong presence of key players and advanced manufacturing industries.
- Favorable government policies promoting additive manufacturing.
- High investment in R&D activities.
- Key Drivers for Metal Powders:
- Superior mechanical properties compared to other materials.
- Wide range of applications in high-value industries.
- Ongoing technological advancements in metal powder production.
- Key Drivers for Aerospace and Defense:
- Stringent requirements for high-strength and lightweight components.
- Need for complex geometries and customized designs.
- High willingness to invest in advanced manufacturing technologies.
A detailed dominance analysis reveals that the competitive landscape is shaped by factors such as technological capabilities, production capacity, and market reach.
3D Printing Powder Market Product Developments
Recent product innovations focus on improving material properties, such as strength, durability, and biocompatibility. New powder formulations are being developed to enhance printability and reduce processing costs. Applications are expanding beyond traditional sectors, with increasing adoption in healthcare, consumer goods, and construction. Companies are leveraging their technological expertise to create competitive advantages by offering specialized powders tailored to specific applications and customer needs, focusing on improved surface finish, reduced porosity, and enhanced functionality.
Report Scope & Segmentation Analysis
This report segments the 3D printing powder market based on powder type (Plastic Powder, Metal Powder, Ceramic Powder, Glass Powder, Other Types) and end-user industry (Automotive, Aerospace and Defense, Medical, Architecture, Other End-user Industries). Each segment is analyzed in terms of market size, growth projections, and competitive dynamics. For example, the Metal Powder segment is expected to witness significant growth due to its extensive applications across various industries, while the Automotive segment holds a substantial market share driven by the increasing demand for lightweight and customized components. Detailed projections for market size and growth are provided for each segment for the forecast period.
Key Drivers of 3D Printing Powder Market Growth
Several factors contribute to the growth of the 3D printing powder market. Technological advancements leading to improved material properties and printing techniques are key. Economic drivers such as increasing demand for customized products and cost-effective manufacturing solutions are also vital. Furthermore, supportive government regulations and policies encouraging the adoption of additive manufacturing technologies play a significant role.
Challenges in the 3D Printing Powder Market Sector
Challenges include the high cost of some specialized powders, supply chain disruptions, and the need for stringent quality control. Regulatory hurdles in some regions can hinder market expansion. Competition among established players and emerging companies also poses challenges to market participants. These factors collectively influence market growth and the need for adaptive strategies from market participants.
Emerging Opportunities in 3D Printing Powder Market
Emerging opportunities exist in new materials development, such as bio-compatible and biodegradable powders. The expansion into new applications, like personalized medicine and sustainable manufacturing, presents growth prospects. Growing demand in emerging economies offers significant potential for market growth. These trends suggest a positive outlook for future market growth and expansion.
Leading Players in the 3D Printing Powder Market Market
- Arkema
- Sandvik AB
- Höganäs AB
- Evonik Industries AG
- BASF SE
- Metalysis
- ERASTEEL
- GKN Powder Metallurgy
- ExOne
Key Developments in 3D Printing Powder Market Industry
- [Month, Year]: [Company Name] launched a new range of high-strength metal powders, expanding its product portfolio.
- [Month, Year]: [Company Name] announced a strategic partnership to develop sustainable and recyclable 3D printing powders.
- [Month, Year]: [Company Name] acquired [Company Name], strengthening its market position and expanding its product offerings.
- [Add more bullet points with specific details as available]
Strategic Outlook for 3D Printing Powder Market Market
The 3D printing powder market is poised for continued growth, driven by technological innovation, expanding applications, and increasing demand across diverse industries. Future opportunities lie in the development of new materials with enhanced properties, the expansion into emerging markets, and the integration of advanced manufacturing technologies. The market's strategic outlook remains positive, indicating substantial growth potential in the coming years.
3D Printing Powder Market Segmentation
-
1. Powder Type
- 1.1. Plastic Powder
- 1.2. Metal Powder
- 1.3. Ceramic Powder
- 1.4. Glass Powder
- 1.5. Other Types (Composite Powder, etc.)
-
2. End-user Industry
- 2.1. Automotive
- 2.2. Aerospace and Defense
- 2.3. Medical
- 2.4. Architecture
- 2.5. Other En
3D Printing Powder Market Segmentation By Geography
-
1. Asia Pacific
- 1.1. China
- 1.2. India
- 1.3. Japan
- 1.4. South Korea
- 1.5. Rest of Asia Pacific
-
2. North America
- 2.1. United States
- 2.2. Canada
- 2.3. Mexico
-
3. Europe
- 3.1. Germany
- 3.2. United Kingdom
- 3.3. France
- 3.4. Italy
- 3.5. Rest of Europe
-
4. South America
- 4.1. Brazil
- 4.2. Argentina
- 4.3. Rest of South America
-
5. Middle East and Africa
- 5.1. Saudi Arabia
- 5.2. South Africa
- 5.3. Rest of Middle East and Africa
3D Printing Powder Market Regional Market Share
Geographic Coverage of 3D Printing Powder Market
3D Printing Powder Market REPORT HIGHLIGHTS
| Aspects | Details |
|---|---|
| Study Period | 2020-2034 |
| Base Year | 2025 |
| Estimated Year | 2026 |
| Forecast Period | 2026-2034 |
| Historical Period | 2020-2025 |
| Growth Rate | CAGR of > 16.50% from 2020-2034 |
| Segmentation |
|
Table of Contents
- 1. Introduction
- 1.1. Research Scope
- 1.2. Market Segmentation
- 1.3. Research Objective
- 1.4. Definitions and Assumptions
- 2. Executive Summary
- 2.1. Market Snapshot
- 3. Market Dynamics
- 3.1. Market Drivers
- 3.2. Market Restrains
- 3.3. Market Trends
- 3.4. Market Opportunities
- 4. Market Factor Analysis
- 4.1. Porters Five Forces
- 4.1.1. Bargaining Power of Suppliers
- 4.1.2. Bargaining Power of Buyers
- 4.1.3. Threat of New Entrants
- 4.1.4. Threat of Substitutes
- 4.1.5. Competitive Rivalry
- 4.2. PESTEL analysis
- 4.3. BCG Analysis
- 4.3.1. Stars (High Growth, High Market Share)
- 4.3.2. Cash Cows (Low Growth, High Market Share)
- 4.3.3. Question Mark (High Growth, Low Market Share)
- 4.3.4. Dogs (Low Growth, Low Market Share)
- 4.4. Ansoff Matrix Analysis
- 4.5. Supply Chain Analysis
- 4.6. Regulatory Landscape
- 4.7. Current Market Potential and Opportunity Assessment (TAM–SAM–SOM Framework)
- 4.8. RAX Analyst Note
- 4.1. Porters Five Forces
- 5. Market Analysis, Insights and Forecast 2021-2033
- 5.1. Market Analysis, Insights and Forecast - by Powder Type
- 5.1.1. Plastic Powder
- 5.1.2. Metal Powder
- 5.1.3. Ceramic Powder
- 5.1.4. Glass Powder
- 5.1.5. Other Types (Composite Powder, etc.)
- 5.2. Market Analysis, Insights and Forecast - by End-user Industry
- 5.2.1. Automotive
- 5.2.2. Aerospace and Defense
- 5.2.3. Medical
- 5.2.4. Architecture
- 5.2.5. Other En
- 5.3. Market Analysis, Insights and Forecast - by Region
- 5.3.1. Asia Pacific
- 5.3.2. North America
- 5.3.3. Europe
- 5.3.4. South America
- 5.3.5. Middle East and Africa
- 5.1. Market Analysis, Insights and Forecast - by Powder Type
- 6. Global 3D Printing Powder Market Analysis, Insights and Forecast, 2021-2033
- 6.1. Market Analysis, Insights and Forecast - by Powder Type
- 6.1.1. Plastic Powder
- 6.1.2. Metal Powder
- 6.1.3. Ceramic Powder
- 6.1.4. Glass Powder
- 6.1.5. Other Types (Composite Powder, etc.)
- 6.2. Market Analysis, Insights and Forecast - by End-user Industry
- 6.2.1. Automotive
- 6.2.2. Aerospace and Defense
- 6.2.3. Medical
- 6.2.4. Architecture
- 6.2.5. Other En
- 6.1. Market Analysis, Insights and Forecast - by Powder Type
- 7. Asia Pacific 3D Printing Powder Market Analysis, Insights and Forecast, 2020-2032
- 7.1. Market Analysis, Insights and Forecast - by Powder Type
- 7.1.1. Plastic Powder
- 7.1.2. Metal Powder
- 7.1.3. Ceramic Powder
- 7.1.4. Glass Powder
- 7.1.5. Other Types (Composite Powder, etc.)
- 7.2. Market Analysis, Insights and Forecast - by End-user Industry
- 7.2.1. Automotive
- 7.2.2. Aerospace and Defense
- 7.2.3. Medical
- 7.2.4. Architecture
- 7.2.5. Other En
- 7.1. Market Analysis, Insights and Forecast - by Powder Type
- 8. North America 3D Printing Powder Market Analysis, Insights and Forecast, 2020-2032
- 8.1. Market Analysis, Insights and Forecast - by Powder Type
- 8.1.1. Plastic Powder
- 8.1.2. Metal Powder
- 8.1.3. Ceramic Powder
- 8.1.4. Glass Powder
- 8.1.5. Other Types (Composite Powder, etc.)
- 8.2. Market Analysis, Insights and Forecast - by End-user Industry
- 8.2.1. Automotive
- 8.2.2. Aerospace and Defense
- 8.2.3. Medical
- 8.2.4. Architecture
- 8.2.5. Other En
- 8.1. Market Analysis, Insights and Forecast - by Powder Type
- 9. Europe 3D Printing Powder Market Analysis, Insights and Forecast, 2020-2032
- 9.1. Market Analysis, Insights and Forecast - by Powder Type
- 9.1.1. Plastic Powder
- 9.1.2. Metal Powder
- 9.1.3. Ceramic Powder
- 9.1.4. Glass Powder
- 9.1.5. Other Types (Composite Powder, etc.)
- 9.2. Market Analysis, Insights and Forecast - by End-user Industry
- 9.2.1. Automotive
- 9.2.2. Aerospace and Defense
- 9.2.3. Medical
- 9.2.4. Architecture
- 9.2.5. Other En
- 9.1. Market Analysis, Insights and Forecast - by Powder Type
- 10. South America 3D Printing Powder Market Analysis, Insights and Forecast, 2020-2032
- 10.1. Market Analysis, Insights and Forecast - by Powder Type
- 10.1.1. Plastic Powder
- 10.1.2. Metal Powder
- 10.1.3. Ceramic Powder
- 10.1.4. Glass Powder
- 10.1.5. Other Types (Composite Powder, etc.)
- 10.2. Market Analysis, Insights and Forecast - by End-user Industry
- 10.2.1. Automotive
- 10.2.2. Aerospace and Defense
- 10.2.3. Medical
- 10.2.4. Architecture
- 10.2.5. Other En
- 10.1. Market Analysis, Insights and Forecast - by Powder Type
- 11. Middle East and Africa 3D Printing Powder Market Analysis, Insights and Forecast, 2020-2032
- 11.1. Market Analysis, Insights and Forecast - by Powder Type
- 11.1.1. Plastic Powder
- 11.1.2. Metal Powder
- 11.1.3. Ceramic Powder
- 11.1.4. Glass Powder
- 11.1.5. Other Types (Composite Powder, etc.)
- 11.2. Market Analysis, Insights and Forecast - by End-user Industry
- 11.2.1. Automotive
- 11.2.2. Aerospace and Defense
- 11.2.3. Medical
- 11.2.4. Architecture
- 11.2.5. Other En
- 11.1. Market Analysis, Insights and Forecast - by Powder Type
- 12. Competitive Analysis
- 12.1. Company Profiles
- 12.1.1 Arkema
- 12.1.1.1. Company Overview
- 12.1.1.2. Products
- 12.1.1.3. Company Financials
- 12.1.1.4. SWOT Analysis
- 12.1.2 Sandvik AB
- 12.1.2.1. Company Overview
- 12.1.2.2. Products
- 12.1.2.3. Company Financials
- 12.1.2.4. SWOT Analysis
- 12.1.3 Höganäs AB
- 12.1.3.1. Company Overview
- 12.1.3.2. Products
- 12.1.3.3. Company Financials
- 12.1.3.4. SWOT Analysis
- 12.1.4 Evonik Industries AG
- 12.1.4.1. Company Overview
- 12.1.4.2. Products
- 12.1.4.3. Company Financials
- 12.1.4.4. SWOT Analysis
- 12.1.5 BASF SE
- 12.1.5.1. Company Overview
- 12.1.5.2. Products
- 12.1.5.3. Company Financials
- 12.1.5.4. SWOT Analysis
- 12.1.6 Metalysis
- 12.1.6.1. Company Overview
- 12.1.6.2. Products
- 12.1.6.3. Company Financials
- 12.1.6.4. SWOT Analysis
- 12.1.7 ERASTEEL
- 12.1.7.1. Company Overview
- 12.1.7.2. Products
- 12.1.7.3. Company Financials
- 12.1.7.4. SWOT Analysis
- 12.1.8 GKN Powder Metallurgy
- 12.1.8.1. Company Overview
- 12.1.8.2. Products
- 12.1.8.3. Company Financials
- 12.1.8.4. SWOT Analysis
- 12.1.9 ExOne
- 12.1.9.1. Company Overview
- 12.1.9.2. Products
- 12.1.9.3. Company Financials
- 12.1.9.4. SWOT Analysis
- 12.1.1 Arkema
- 12.2. Market Entropy
- 12.2.1 Company's Key Areas Served
- 12.2.2 Recent Developments
- 12.3. Company Market Share Analysis 2025
- 12.3.1 Top 5 Companies Market Share Analysis
- 12.3.2 Top 3 Companies Market Share Analysis
- 12.4. List of Potential Customers
- 13. Research Methodology
List of Figures
- Figure 1: Global 3D Printing Powder Market Revenue Breakdown (Million, %) by Region 2025 & 2033
- Figure 2: Global 3D Printing Powder Market Volume Breakdown (K Tons, %) by Region 2025 & 2033
- Figure 3: Asia Pacific 3D Printing Powder Market Revenue (Million), by Powder Type 2025 & 2033
- Figure 4: Asia Pacific 3D Printing Powder Market Volume (K Tons), by Powder Type 2025 & 2033
- Figure 5: Asia Pacific 3D Printing Powder Market Revenue Share (%), by Powder Type 2025 & 2033
- Figure 6: Asia Pacific 3D Printing Powder Market Volume Share (%), by Powder Type 2025 & 2033
- Figure 7: Asia Pacific 3D Printing Powder Market Revenue (Million), by End-user Industry 2025 & 2033
- Figure 8: Asia Pacific 3D Printing Powder Market Volume (K Tons), by End-user Industry 2025 & 2033
- Figure 9: Asia Pacific 3D Printing Powder Market Revenue Share (%), by End-user Industry 2025 & 2033
- Figure 10: Asia Pacific 3D Printing Powder Market Volume Share (%), by End-user Industry 2025 & 2033
- Figure 11: Asia Pacific 3D Printing Powder Market Revenue (Million), by Country 2025 & 2033
- Figure 12: Asia Pacific 3D Printing Powder Market Volume (K Tons), by Country 2025 & 2033
- Figure 13: Asia Pacific 3D Printing Powder Market Revenue Share (%), by Country 2025 & 2033
- Figure 14: Asia Pacific 3D Printing Powder Market Volume Share (%), by Country 2025 & 2033
- Figure 15: North America 3D Printing Powder Market Revenue (Million), by Powder Type 2025 & 2033
- Figure 16: North America 3D Printing Powder Market Volume (K Tons), by Powder Type 2025 & 2033
- Figure 17: North America 3D Printing Powder Market Revenue Share (%), by Powder Type 2025 & 2033
- Figure 18: North America 3D Printing Powder Market Volume Share (%), by Powder Type 2025 & 2033
- Figure 19: North America 3D Printing Powder Market Revenue (Million), by End-user Industry 2025 & 2033
- Figure 20: North America 3D Printing Powder Market Volume (K Tons), by End-user Industry 2025 & 2033
- Figure 21: North America 3D Printing Powder Market Revenue Share (%), by End-user Industry 2025 & 2033
- Figure 22: North America 3D Printing Powder Market Volume Share (%), by End-user Industry 2025 & 2033
- Figure 23: North America 3D Printing Powder Market Revenue (Million), by Country 2025 & 2033
- Figure 24: North America 3D Printing Powder Market Volume (K Tons), by Country 2025 & 2033
- Figure 25: North America 3D Printing Powder Market Revenue Share (%), by Country 2025 & 2033
- Figure 26: North America 3D Printing Powder Market Volume Share (%), by Country 2025 & 2033
- Figure 27: Europe 3D Printing Powder Market Revenue (Million), by Powder Type 2025 & 2033
- Figure 28: Europe 3D Printing Powder Market Volume (K Tons), by Powder Type 2025 & 2033
- Figure 29: Europe 3D Printing Powder Market Revenue Share (%), by Powder Type 2025 & 2033
- Figure 30: Europe 3D Printing Powder Market Volume Share (%), by Powder Type 2025 & 2033
- Figure 31: Europe 3D Printing Powder Market Revenue (Million), by End-user Industry 2025 & 2033
- Figure 32: Europe 3D Printing Powder Market Volume (K Tons), by End-user Industry 2025 & 2033
- Figure 33: Europe 3D Printing Powder Market Revenue Share (%), by End-user Industry 2025 & 2033
- Figure 34: Europe 3D Printing Powder Market Volume Share (%), by End-user Industry 2025 & 2033
- Figure 35: Europe 3D Printing Powder Market Revenue (Million), by Country 2025 & 2033
- Figure 36: Europe 3D Printing Powder Market Volume (K Tons), by Country 2025 & 2033
- Figure 37: Europe 3D Printing Powder Market Revenue Share (%), by Country 2025 & 2033
- Figure 38: Europe 3D Printing Powder Market Volume Share (%), by Country 2025 & 2033
- Figure 39: South America 3D Printing Powder Market Revenue (Million), by Powder Type 2025 & 2033
- Figure 40: South America 3D Printing Powder Market Volume (K Tons), by Powder Type 2025 & 2033
- Figure 41: South America 3D Printing Powder Market Revenue Share (%), by Powder Type 2025 & 2033
- Figure 42: South America 3D Printing Powder Market Volume Share (%), by Powder Type 2025 & 2033
- Figure 43: South America 3D Printing Powder Market Revenue (Million), by End-user Industry 2025 & 2033
- Figure 44: South America 3D Printing Powder Market Volume (K Tons), by End-user Industry 2025 & 2033
- Figure 45: South America 3D Printing Powder Market Revenue Share (%), by End-user Industry 2025 & 2033
- Figure 46: South America 3D Printing Powder Market Volume Share (%), by End-user Industry 2025 & 2033
- Figure 47: South America 3D Printing Powder Market Revenue (Million), by Country 2025 & 2033
- Figure 48: South America 3D Printing Powder Market Volume (K Tons), by Country 2025 & 2033
- Figure 49: South America 3D Printing Powder Market Revenue Share (%), by Country 2025 & 2033
- Figure 50: South America 3D Printing Powder Market Volume Share (%), by Country 2025 & 2033
- Figure 51: Middle East and Africa 3D Printing Powder Market Revenue (Million), by Powder Type 2025 & 2033
- Figure 52: Middle East and Africa 3D Printing Powder Market Volume (K Tons), by Powder Type 2025 & 2033
- Figure 53: Middle East and Africa 3D Printing Powder Market Revenue Share (%), by Powder Type 2025 & 2033
- Figure 54: Middle East and Africa 3D Printing Powder Market Volume Share (%), by Powder Type 2025 & 2033
- Figure 55: Middle East and Africa 3D Printing Powder Market Revenue (Million), by End-user Industry 2025 & 2033
- Figure 56: Middle East and Africa 3D Printing Powder Market Volume (K Tons), by End-user Industry 2025 & 2033
- Figure 57: Middle East and Africa 3D Printing Powder Market Revenue Share (%), by End-user Industry 2025 & 2033
- Figure 58: Middle East and Africa 3D Printing Powder Market Volume Share (%), by End-user Industry 2025 & 2033
- Figure 59: Middle East and Africa 3D Printing Powder Market Revenue (Million), by Country 2025 & 2033
- Figure 60: Middle East and Africa 3D Printing Powder Market Volume (K Tons), by Country 2025 & 2033
- Figure 61: Middle East and Africa 3D Printing Powder Market Revenue Share (%), by Country 2025 & 2033
- Figure 62: Middle East and Africa 3D Printing Powder Market Volume Share (%), by Country 2025 & 2033
List of Tables
- Table 1: Global 3D Printing Powder Market Revenue Million Forecast, by Powder Type 2020 & 2033
- Table 2: Global 3D Printing Powder Market Volume K Tons Forecast, by Powder Type 2020 & 2033
- Table 3: Global 3D Printing Powder Market Revenue Million Forecast, by End-user Industry 2020 & 2033
- Table 4: Global 3D Printing Powder Market Volume K Tons Forecast, by End-user Industry 2020 & 2033
- Table 5: Global 3D Printing Powder Market Revenue Million Forecast, by Region 2020 & 2033
- Table 6: Global 3D Printing Powder Market Volume K Tons Forecast, by Region 2020 & 2033
- Table 7: Global 3D Printing Powder Market Revenue Million Forecast, by Powder Type 2020 & 2033
- Table 8: Global 3D Printing Powder Market Volume K Tons Forecast, by Powder Type 2020 & 2033
- Table 9: Global 3D Printing Powder Market Revenue Million Forecast, by End-user Industry 2020 & 2033
- Table 10: Global 3D Printing Powder Market Volume K Tons Forecast, by End-user Industry 2020 & 2033
- Table 11: Global 3D Printing Powder Market Revenue Million Forecast, by Country 2020 & 2033
- Table 12: Global 3D Printing Powder Market Volume K Tons Forecast, by Country 2020 & 2033
- Table 13: China 3D Printing Powder Market Revenue (Million) Forecast, by Application 2020 & 2033
- Table 14: China 3D Printing Powder Market Volume (K Tons) Forecast, by Application 2020 & 2033
- Table 15: India 3D Printing Powder Market Revenue (Million) Forecast, by Application 2020 & 2033
- Table 16: India 3D Printing Powder Market Volume (K Tons) Forecast, by Application 2020 & 2033
- Table 17: Japan 3D Printing Powder Market Revenue (Million) Forecast, by Application 2020 & 2033
- Table 18: Japan 3D Printing Powder Market Volume (K Tons) Forecast, by Application 2020 & 2033
- Table 19: South Korea 3D Printing Powder Market Revenue (Million) Forecast, by Application 2020 & 2033
- Table 20: South Korea 3D Printing Powder Market Volume (K Tons) Forecast, by Application 2020 & 2033
- Table 21: Rest of Asia Pacific 3D Printing Powder Market Revenue (Million) Forecast, by Application 2020 & 2033
- Table 22: Rest of Asia Pacific 3D Printing Powder Market Volume (K Tons) Forecast, by Application 2020 & 2033
- Table 23: Global 3D Printing Powder Market Revenue Million Forecast, by Powder Type 2020 & 2033
- Table 24: Global 3D Printing Powder Market Volume K Tons Forecast, by Powder Type 2020 & 2033
- Table 25: Global 3D Printing Powder Market Revenue Million Forecast, by End-user Industry 2020 & 2033
- Table 26: Global 3D Printing Powder Market Volume K Tons Forecast, by End-user Industry 2020 & 2033
- Table 27: Global 3D Printing Powder Market Revenue Million Forecast, by Country 2020 & 2033
- Table 28: Global 3D Printing Powder Market Volume K Tons Forecast, by Country 2020 & 2033
- Table 29: United States 3D Printing Powder Market Revenue (Million) Forecast, by Application 2020 & 2033
- Table 30: United States 3D Printing Powder Market Volume (K Tons) Forecast, by Application 2020 & 2033
- Table 31: Canada 3D Printing Powder Market Revenue (Million) Forecast, by Application 2020 & 2033
- Table 32: Canada 3D Printing Powder Market Volume (K Tons) Forecast, by Application 2020 & 2033
- Table 33: Mexico 3D Printing Powder Market Revenue (Million) Forecast, by Application 2020 & 2033
- Table 34: Mexico 3D Printing Powder Market Volume (K Tons) Forecast, by Application 2020 & 2033
- Table 35: Global 3D Printing Powder Market Revenue Million Forecast, by Powder Type 2020 & 2033
- Table 36: Global 3D Printing Powder Market Volume K Tons Forecast, by Powder Type 2020 & 2033
- Table 37: Global 3D Printing Powder Market Revenue Million Forecast, by End-user Industry 2020 & 2033
- Table 38: Global 3D Printing Powder Market Volume K Tons Forecast, by End-user Industry 2020 & 2033
- Table 39: Global 3D Printing Powder Market Revenue Million Forecast, by Country 2020 & 2033
- Table 40: Global 3D Printing Powder Market Volume K Tons Forecast, by Country 2020 & 2033
- Table 41: Germany 3D Printing Powder Market Revenue (Million) Forecast, by Application 2020 & 2033
- Table 42: Germany 3D Printing Powder Market Volume (K Tons) Forecast, by Application 2020 & 2033
- Table 43: United Kingdom 3D Printing Powder Market Revenue (Million) Forecast, by Application 2020 & 2033
- Table 44: United Kingdom 3D Printing Powder Market Volume (K Tons) Forecast, by Application 2020 & 2033
- Table 45: France 3D Printing Powder Market Revenue (Million) Forecast, by Application 2020 & 2033
- Table 46: France 3D Printing Powder Market Volume (K Tons) Forecast, by Application 2020 & 2033
- Table 47: Italy 3D Printing Powder Market Revenue (Million) Forecast, by Application 2020 & 2033
- Table 48: Italy 3D Printing Powder Market Volume (K Tons) Forecast, by Application 2020 & 2033
- Table 49: Rest of Europe 3D Printing Powder Market Revenue (Million) Forecast, by Application 2020 & 2033
- Table 50: Rest of Europe 3D Printing Powder Market Volume (K Tons) Forecast, by Application 2020 & 2033
- Table 51: Global 3D Printing Powder Market Revenue Million Forecast, by Powder Type 2020 & 2033
- Table 52: Global 3D Printing Powder Market Volume K Tons Forecast, by Powder Type 2020 & 2033
- Table 53: Global 3D Printing Powder Market Revenue Million Forecast, by End-user Industry 2020 & 2033
- Table 54: Global 3D Printing Powder Market Volume K Tons Forecast, by End-user Industry 2020 & 2033
- Table 55: Global 3D Printing Powder Market Revenue Million Forecast, by Country 2020 & 2033
- Table 56: Global 3D Printing Powder Market Volume K Tons Forecast, by Country 2020 & 2033
- Table 57: Brazil 3D Printing Powder Market Revenue (Million) Forecast, by Application 2020 & 2033
- Table 58: Brazil 3D Printing Powder Market Volume (K Tons) Forecast, by Application 2020 & 2033
- Table 59: Argentina 3D Printing Powder Market Revenue (Million) Forecast, by Application 2020 & 2033
- Table 60: Argentina 3D Printing Powder Market Volume (K Tons) Forecast, by Application 2020 & 2033
- Table 61: Rest of South America 3D Printing Powder Market Revenue (Million) Forecast, by Application 2020 & 2033
- Table 62: Rest of South America 3D Printing Powder Market Volume (K Tons) Forecast, by Application 2020 & 2033
- Table 63: Global 3D Printing Powder Market Revenue Million Forecast, by Powder Type 2020 & 2033
- Table 64: Global 3D Printing Powder Market Volume K Tons Forecast, by Powder Type 2020 & 2033
- Table 65: Global 3D Printing Powder Market Revenue Million Forecast, by End-user Industry 2020 & 2033
- Table 66: Global 3D Printing Powder Market Volume K Tons Forecast, by End-user Industry 2020 & 2033
- Table 67: Global 3D Printing Powder Market Revenue Million Forecast, by Country 2020 & 2033
- Table 68: Global 3D Printing Powder Market Volume K Tons Forecast, by Country 2020 & 2033
- Table 69: Saudi Arabia 3D Printing Powder Market Revenue (Million) Forecast, by Application 2020 & 2033
- Table 70: Saudi Arabia 3D Printing Powder Market Volume (K Tons) Forecast, by Application 2020 & 2033
- Table 71: South Africa 3D Printing Powder Market Revenue (Million) Forecast, by Application 2020 & 2033
- Table 72: South Africa 3D Printing Powder Market Volume (K Tons) Forecast, by Application 2020 & 2033
- Table 73: Rest of Middle East and Africa 3D Printing Powder Market Revenue (Million) Forecast, by Application 2020 & 2033
- Table 74: Rest of Middle East and Africa 3D Printing Powder Market Volume (K Tons) Forecast, by Application 2020 & 2033
Frequently Asked Questions
1. What is the projected Compound Annual Growth Rate (CAGR) of the 3D Printing Powder Market?
The projected CAGR is approximately > 16.50%.
2. Which companies are prominent players in the 3D Printing Powder Market?
Key companies in the market include Arkema, Sandvik AB, Höganäs AB, Evonik Industries AG, BASF SE, Metalysis, ERASTEEL, GKN Powder Metallurgy, ExOne.
3. What are the main segments of the 3D Printing Powder Market?
The market segments include Powder Type, End-user Industry.
4. Can you provide details about the market size?
The market size is estimated to be USD 2.06 Million as of 2022.
5. What are some drivers contributing to market growth?
Increasing Applications in Aerospace and Automobile Industries; Growing Demand from Medical Sector; Other Drivers.
6. What are the notable trends driving market growth?
Growing Demand from Automobile Sector.
7. Are there any restraints impacting market growth?
HIgh Material and Post Processing Cost; Hazardous in Nature.
8. Can you provide examples of recent developments in the market?
N/A
9. What pricing options are available for accessing the report?
Pricing options include single-user, multi-user, and enterprise licenses priced at USD 4750, USD 5250, and USD 8750 respectively.
10. Is the market size provided in terms of value or volume?
The market size is provided in terms of value, measured in Million and volume, measured in K Tons.
11. Are there any specific market keywords associated with the report?
Yes, the market keyword associated with the report is "3D Printing Powder Market," which aids in identifying and referencing the specific market segment covered.
12. How do I determine which pricing option suits my needs best?
The pricing options vary based on user requirements and access needs. Individual users may opt for single-user licenses, while businesses requiring broader access may choose multi-user or enterprise licenses for cost-effective access to the report.
13. Are there any additional resources or data provided in the 3D Printing Powder Market report?
While the report offers comprehensive insights, it's advisable to review the specific contents or supplementary materials provided to ascertain if additional resources or data are available.
14. How can I stay updated on further developments or reports in the 3D Printing Powder Market?
To stay informed about further developments, trends, and reports in the 3D Printing Powder Market, consider subscribing to industry newsletters, following relevant companies and organizations, or regularly checking reputable industry news sources and publications.
Methodology
Step 1 - Identification of Relevant Samples Size from Population Database


Step 2 - Approaches for Defining Global Market Size (Value, Volume* & Price*)

Note*: In applicable scenarios
Step 3 - Data Sources
Primary Research
- Web Analytics
- Survey Reports
- Research Institute
- Latest Research Reports
- Opinion Leaders
Secondary Research
- Annual Reports
- White Paper
- Latest Press Release
- Industry Association
- Paid Database
- Investor Presentations

Step 4 - Data Triangulation
Involves using different sources of information in order to increase the validity of a study
These sources are likely to be stakeholders in a program - participants, other researchers, program staff, other community members, and so on.
Then we put all data in single framework & apply various statistical tools to find out the dynamic on the market.
During the analysis stage, feedback from the stakeholder groups would be compared to determine areas of agreement as well as areas of divergence