

Key Insights
The global 3D stem cell culture market is experiencing robust growth, projected to reach an estimated $271 million by 2025, driven by a remarkable 13.2% CAGR. This significant expansion is underpinned by the increasing demand for more accurate and predictive preclinical testing models, moving away from traditional 2D cultures. The primary driver for this surge is the enhanced efficacy and reduced toxicology testing capabilities offered by 3D stem cell models, which better mimic the in vivo environment. This allows researchers to gain deeper insights into disease mechanisms, drug interactions, and regenerative medicine applications. The market is segmented into scaffold-based and scaffold-free approaches, with scaffold-based methods currently holding a dominant share due to established protocols and wider accessibility. However, scaffold-free technologies are gaining traction for their ability to preserve native cell-cell interactions and extracellular matrix architecture, promising more physiologically relevant results.
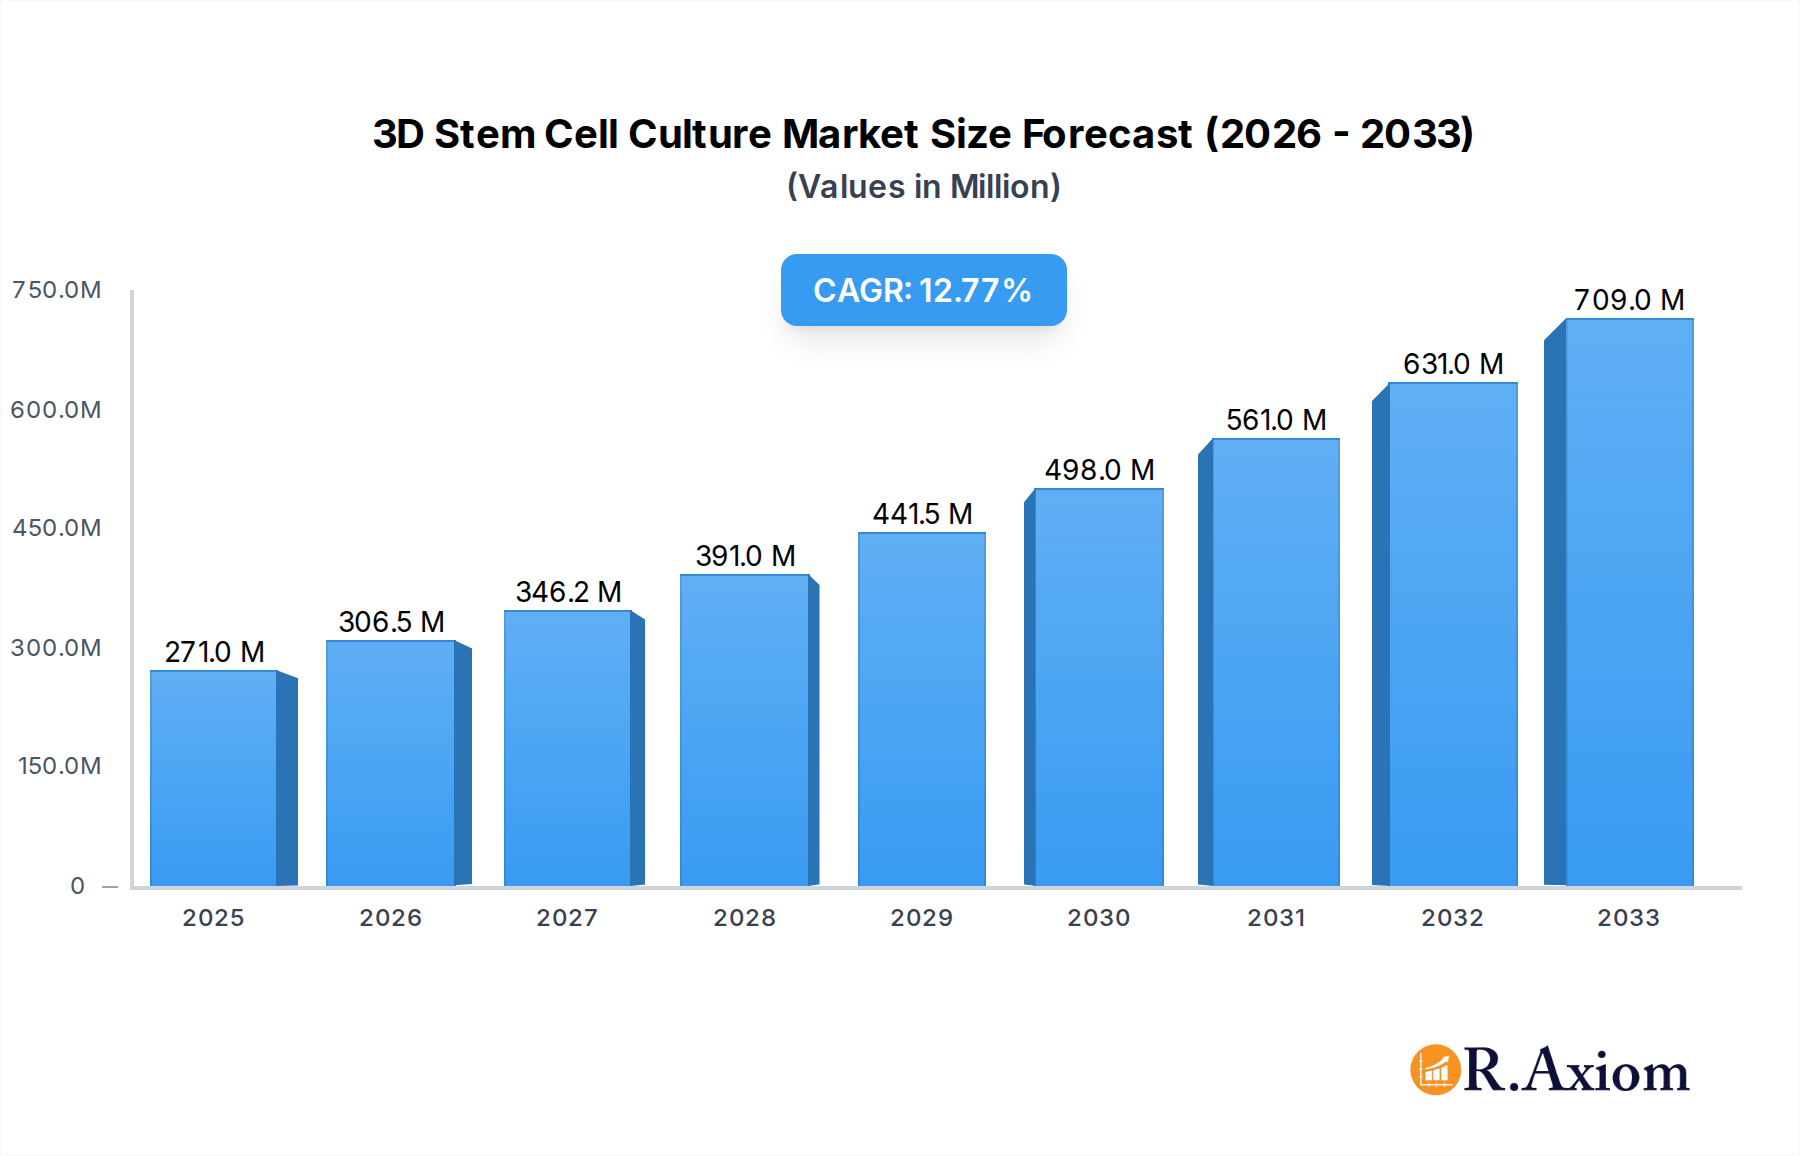
3D Stem Cell Culture Market Size (In Million)
The forecast period, from 2025 to 2033, anticipates continued innovation and adoption of 3D stem cell culture techniques. Key trends include the increasing use of these models in drug discovery and development, personalized medicine, and the burgeoning field of regenerative therapies. The ability of 3D stem cell cultures to recapitulate complex tissue structures and disease phenotypes is revolutionizing how potential therapeutics are evaluated. Emerging applications in disease modeling for neurological disorders, cardiovascular diseases, and cancer are further fueling market expansion. While the market is characterized by significant opportunities, restraints such as the high cost of advanced culture systems and the need for specialized expertise in their implementation and analysis are present. However, ongoing technological advancements and a growing understanding of the benefits of 3D cultures are expected to mitigate these challenges, ensuring sustained market growth and a transformative impact on life sciences research and healthcare.

3D Stem Cell Culture Company Market Share
3D Stem Cell Culture Market Concentration & Innovation
The 3D stem cell culture market exhibits a moderate level of concentration, with a few key players holding significant market share, estimated at over 40% combined by value for the top 5 companies. Thermo Fisher Scientific, Corning, and Merck are prominent leaders, leveraging extensive R&D investments and established distribution networks. Innovation in this sector is primarily driven by advancements in biomaterials, microfluidics, and automation, aiming to create more physiologically relevant in vitro models. The market penetration of advanced 3D stem cell culture techniques is steadily increasing, projected to reach over 35% by 2033. Regulatory frameworks, particularly those from the FDA and EMA, are evolving to accommodate the unique data generated by these models for drug development and regenerative medicine. Product substitutes, such as traditional 2D cell cultures and animal models, are gradually being displaced by the superior predictive power of 3D stem cell systems. End-user trends strongly favor models that reduce animal testing and enhance drug efficacy and toxicology prediction. Merger and acquisition (M&A) activities are significant, with estimated annual deal values exceeding 500 million, reflecting strategic consolidation and technology acquisition, with notable recent acquisitions in the organ-on-a-chip technology space valued in the tens of millions.
3D Stem Cell Culture Industry Trends & Insights
The global 3D stem cell culture market is poised for substantial growth, driven by a confluence of technological advancements, increasing demand for personalized medicine, and the urgent need for more predictive preclinical models. The Compound Annual Growth Rate (CAGR) is projected to be a robust 18.5% over the forecast period of 2025–2033, reaching an estimated market size of over 5 billion by 2033. This surge is fueled by the inherent limitations of traditional 2D cell cultures and animal models in replicating the complex cellular microenvironments and physiological responses observed in vivo. 3D stem cell cultures, including organoids and spheroids, offer a more accurate representation of human tissue architecture and function, thereby improving the reliability of efficacy and toxicology testing, a key application segment projected to grow at over 20% annually. Technological disruptions, such as the integration of artificial intelligence and machine learning for data analysis and model optimization, are further accelerating adoption. Consumer preferences are increasingly shifting towards solutions that promise faster drug development cycles, reduced attrition rates in clinical trials, and a greater ethical consideration in research. Key players are investing heavily in R&D to develop novel biomaterials, specialized bioreactors, and automated high-throughput screening platforms to meet this demand. The competitive landscape is dynamic, with both established life science giants and innovative startups vying for market leadership, particularly in specialized niche areas like disease modeling and drug screening. The market penetration of advanced 3D stem cell technologies, though still in its growth phase, is expected to exceed 50% of relevant research applications by 2033, indicating a significant transition from conventional methods.
Dominant Markets & Segments in 3D Stem Cell Culture
North America currently dominates the global 3D stem cell culture market, accounting for approximately 40% of the market share in 2025. This regional dominance is attributed to robust government funding for life sciences research, a high concentration of pharmaceutical and biotechnology companies, and a well-established ecosystem for technological innovation. The United States, in particular, is a key growth engine due to significant investments in regenerative medicine and drug discovery.
Application: Efficacy vs. Toxicology Testing
- Efficacy Testing: The application of 3D stem cell cultures for efficacy testing is experiencing rapid growth, driven by the need for more predictive models that accurately reflect drug responses in human tissues. This segment is projected to grow at a CAGR of over 19% from 2025–2033.
- Toxicology Testing: 3D stem cell models are increasingly being adopted for toxicology testing, offering a significant improvement over traditional methods by reducing animal usage and providing more relevant human data. This segment is anticipated to grow at a CAGR of approximately 18% during the same period, with an estimated market value exceeding 1.5 billion by 2033.
Leading Models
- Organoids: Organoids, which are three-dimensional self-organizing structures that mimic the architecture and function of organs, represent a leading model in the 3D stem cell culture market. Their ability to recapitulate specific organ functions makes them highly valuable for disease modeling and drug development.
- Spheroids: Spheroids, or cell aggregates grown in a non-adherent environment, are another significant model type, offering a simpler yet effective 3D microenvironment for various research applications.
Types: Scaffold-based, Scaffold-free, Others
- Scaffold-based 3D Stem Cell Culture: This type, which utilizes porous or fibrous scaffolds to support cell growth and organization, holds a substantial market share due to its versatility and ability to provide structural support. It is expected to contribute over 2 billion to the market by 2033.
- Key Drivers: Availability of diverse biomaterials (collagen, hyaluronic acid, synthetic polymers), established fabrication techniques, and applicability in tissue engineering.
- Dominance Factors: Extensive research and development, strong presence of key players like Corning and Thermo Fisher Scientific, and widespread adoption in academic and industrial research.
- Scaffold-free 3D Stem Cell Culture: This segment, which relies on cell-cell interactions and self-assembly for structure formation, is gaining traction due to its ability to create more native-like cellular structures.
- Key Drivers: Advancements in microfluidics and bioprinting technologies, reduced material-associated variability, and creation of more physiologically relevant cell-cell interactions.
- Growth Potential: Projected to witness a CAGR of over 20% from 2025–2033, driven by innovation in spheroid and organoid formation techniques.
- Others: This category includes emerging technologies and hybrid approaches that may not neatly fit into scaffold-based or scaffold-free definitions.
3D Stem Cell Culture Product Developments
Recent product developments in 3D stem cell culture are characterized by enhanced complexity and miniaturization. Companies are focusing on creating advanced organ-on-a-chip systems and sophisticated organoid models that better mimic human physiology for drug discovery and toxicology testing. Innovations include novel biomaterials for improved cell integration and differentiation, along with integrated microfluidic devices for precise control of the cellular microenvironment. These advancements offer significant competitive advantages by enabling more predictive, reproducible, and cost-effective in vitro studies, thereby accelerating the translation of research into clinical applications and reducing reliance on animal testing.
Report Scope & Segmentation Analysis
This report provides a comprehensive analysis of the 3D stem cell culture market, segmenting it across key dimensions to offer actionable insights. The segmentation includes:
- Application: The report meticulously analyzes the distinct market segments of Efficacy Testing and Toxicology Testing. Efficacy testing is projected to reach over 2.5 billion by 2033, driven by the demand for better drug response prediction. Toxicology testing is estimated to be valued at over 1.5 billion by the same year, fueled by the need for reduced animal testing.
- Leading Models: The report delves into the market share and growth potential of Leading Models such as organoids and spheroids. Organoids are expected to lead this segment, capturing over 50% of the market share by 2033.
- Types: The analysis further breaks down the market by Types, including Scaffold-based, Scaffold-free, and Other technologies. Scaffold-based culture is anticipated to maintain a dominant position, while scaffold-free technologies are projected for the highest growth rate.
Key Drivers of 3D Stem Cell Culture Growth
The growth of the 3D stem cell culture market is propelled by several key factors. Technologically, advancements in biomaterials, microfluidics, and bioprinting are enabling the creation of more sophisticated and physiologically relevant in vitro models. Economically, the increasing demand for personalized medicine and the desire to reduce the high costs and failure rates associated with drug development are significant drivers. Regulatory bodies are increasingly encouraging the use of validated 3D cell models to reduce animal testing, providing a supportive framework for market expansion. For instance, the push from agencies like the FDA to reduce animal studies in favor of in vitro alternatives directly benefits this sector.
Challenges in the 3D Stem Cell Culture Sector
Despite its promising growth, the 3D stem cell culture sector faces several challenges. Regulatory hurdles remain, as validation and standardization of these complex models for broad regulatory acceptance are still ongoing, impacting adoption rates for specific applications. Supply chain complexities for specialized reagents and custom-made biomaterials can lead to higher costs and longer lead times. Furthermore, the high initial investment required for advanced equipment and expertise presents a barrier to entry for smaller research institutions and companies. Competitive pressures from established in vitro methods and the ongoing refinement of animal models also pose challenges.
Emerging Opportunities in 3D Stem Cell Culture
Emerging opportunities in the 3D stem cell culture market are abundant. The development of patient-derived organoids for personalized drug screening and disease modeling presents a significant avenue for growth, offering tailored therapeutic strategies. Advancements in in situ monitoring and the integration of artificial intelligence for data analysis are paving the way for more efficient and predictive drug discovery pipelines. Furthermore, the expansion of 3D stem cell culture applications into areas like cosmetics testing and environmental toxicology opens up new market segments. The increasing focus on regenerative medicine and tissue engineering also provides fertile ground for innovation and market expansion, with projected market values for these applications alone reaching over 1 billion by 2033.
Leading Players in the 3D Stem Cell Culture Market
- Thermo Fisher Scientific
- Corning
- Merck
- Greiner Bio-One
- Lonza Group
- Emulate
- TissUse
- CN Bio
- TARA Biosystems
- Mimetas
- Nortis
- Reprocell Incorporated
- Jet Bio-Filtration
- InSphero AG
- 3D Biotek
Key Developments in 3D Stem Cell Culture Industry
- 2023: Launch of advanced, multi-organ-on-a-chip platforms by Emulate, enabling complex physiological interactions.
- 2023: Merck introduces new hydrogel formulations for enhanced spheroid formation and cell viability.
- 2024: CN Bio receives significant funding for the development of advanced human liver and kidney models.
- 2024: TARA Biosystems expands its portfolio of cardiac organoid models for drug screening.
- 2024: Mimetas announces a strategic partnership to commercialize its organ-on-a-plate technology for preclinical testing.
- 2024: InSphero AG receives regulatory clearance for its advanced 3D liver models in specific toxicology applications.
Strategic Outlook for 3D Stem Cell Culture Market
The strategic outlook for the 3D stem cell culture market is exceptionally bright, driven by a continuous demand for more predictive and ethically sound research tools. The market will witness further consolidation as larger players acquire innovative startups to bolster their technology portfolios. Investments in automation and AI-driven data analysis will be critical for streamlining workflows and accelerating research outcomes. The increasing regulatory acceptance and the demonstrated superiority of 3D models in recapitulating human physiology will continue to drive market penetration across pharmaceutical, biotechnological, and academic research sectors, ensuring sustained growth and innovation.
3D Stem Cell Culture Segmentation
-
1. Application
- 1.1. Efficacy vs. Toxicology Testing
- 1.2. Leading Models
-
2. Types
- 2.1. Scaffold-based
- 2.2. Scaffold-free
- 2.3. Others
3D Stem Cell Culture Segmentation By Geography
-
1. North America
- 1.1. United States
- 1.2. Canada
- 1.3. Mexico
-
2. South America
- 2.1. Brazil
- 2.2. Argentina
- 2.3. Rest of South America
-
3. Europe
- 3.1. United Kingdom
- 3.2. Germany
- 3.3. France
- 3.4. Italy
- 3.5. Spain
- 3.6. Russia
- 3.7. Benelux
- 3.8. Nordics
- 3.9. Rest of Europe
-
4. Middle East & Africa
- 4.1. Turkey
- 4.2. Israel
- 4.3. GCC
- 4.4. North Africa
- 4.5. South Africa
- 4.6. Rest of Middle East & Africa
-
5. Asia Pacific
- 5.1. China
- 5.2. India
- 5.3. Japan
- 5.4. South Korea
- 5.5. ASEAN
- 5.6. Oceania
- 5.7. Rest of Asia Pacific

3D Stem Cell Culture Regional Market Share
Geographic Coverage of 3D Stem Cell Culture
3D Stem Cell Culture REPORT HIGHLIGHTS
| Aspects | Details |
|---|---|
| Study Period | 2020-2034 |
| Base Year | 2025 |
| Estimated Year | 2026 |
| Forecast Period | 2026-2034 |
| Historical Period | 2020-2025 |
| Growth Rate | CAGR of 13.2% from 2020-2034 |
| Segmentation |
|
Table of Contents
- 1. Introduction
- 1.1. Research Scope
- 1.2. Market Segmentation
- 1.3. Research Methodology
- 1.4. Definitions and Assumptions
- 2. Executive Summary
- 2.1. Introduction
- 3. Market Dynamics
- 3.1. Introduction
- 3.2. Market Drivers
- 3.3. Market Restrains
- 3.4. Market Trends
- 4. Market Factor Analysis
- 4.1. Porters Five Forces
- 4.2. Supply/Value Chain
- 4.3. PESTEL analysis
- 4.4. Market Entropy
- 4.5. Patent/Trademark Analysis
- 5. Global 3D Stem Cell Culture Analysis, Insights and Forecast, 2020-2032
- 5.1. Market Analysis, Insights and Forecast - by Application
- 5.1.1. Efficacy vs. Toxicology Testing
- 5.1.2. Leading Models
- 5.2. Market Analysis, Insights and Forecast - by Types
- 5.2.1. Scaffold-based
- 5.2.2. Scaffold-free
- 5.2.3. Others
- 5.3. Market Analysis, Insights and Forecast - by Region
- 5.3.1. North America
- 5.3.2. South America
- 5.3.3. Europe
- 5.3.4. Middle East & Africa
- 5.3.5. Asia Pacific
- 5.1. Market Analysis, Insights and Forecast - by Application
- 6. North America 3D Stem Cell Culture Analysis, Insights and Forecast, 2020-2032
- 6.1. Market Analysis, Insights and Forecast - by Application
- 6.1.1. Efficacy vs. Toxicology Testing
- 6.1.2. Leading Models
- 6.2. Market Analysis, Insights and Forecast - by Types
- 6.2.1. Scaffold-based
- 6.2.2. Scaffold-free
- 6.2.3. Others
- 6.1. Market Analysis, Insights and Forecast - by Application
- 7. South America 3D Stem Cell Culture Analysis, Insights and Forecast, 2020-2032
- 7.1. Market Analysis, Insights and Forecast - by Application
- 7.1.1. Efficacy vs. Toxicology Testing
- 7.1.2. Leading Models
- 7.2. Market Analysis, Insights and Forecast - by Types
- 7.2.1. Scaffold-based
- 7.2.2. Scaffold-free
- 7.2.3. Others
- 7.1. Market Analysis, Insights and Forecast - by Application
- 8. Europe 3D Stem Cell Culture Analysis, Insights and Forecast, 2020-2032
- 8.1. Market Analysis, Insights and Forecast - by Application
- 8.1.1. Efficacy vs. Toxicology Testing
- 8.1.2. Leading Models
- 8.2. Market Analysis, Insights and Forecast - by Types
- 8.2.1. Scaffold-based
- 8.2.2. Scaffold-free
- 8.2.3. Others
- 8.1. Market Analysis, Insights and Forecast - by Application
- 9. Middle East & Africa 3D Stem Cell Culture Analysis, Insights and Forecast, 2020-2032
- 9.1. Market Analysis, Insights and Forecast - by Application
- 9.1.1. Efficacy vs. Toxicology Testing
- 9.1.2. Leading Models
- 9.2. Market Analysis, Insights and Forecast - by Types
- 9.2.1. Scaffold-based
- 9.2.2. Scaffold-free
- 9.2.3. Others
- 9.1. Market Analysis, Insights and Forecast - by Application
- 10. Asia Pacific 3D Stem Cell Culture Analysis, Insights and Forecast, 2020-2032
- 10.1. Market Analysis, Insights and Forecast - by Application
- 10.1.1. Efficacy vs. Toxicology Testing
- 10.1.2. Leading Models
- 10.2. Market Analysis, Insights and Forecast - by Types
- 10.2.1. Scaffold-based
- 10.2.2. Scaffold-free
- 10.2.3. Others
- 10.1. Market Analysis, Insights and Forecast - by Application
- 11. Competitive Analysis
- 11.1. Global Market Share Analysis 2025
- 11.2. Company Profiles
- 11.2.1 Thermo Fisher Scientific
- 11.2.1.1. Overview
- 11.2.1.2. Products
- 11.2.1.3. SWOT Analysis
- 11.2.1.4. Recent Developments
- 11.2.1.5. Financials (Based on Availability)
- 11.2.2 Corning
- 11.2.2.1. Overview
- 11.2.2.2. Products
- 11.2.2.3. SWOT Analysis
- 11.2.2.4. Recent Developments
- 11.2.2.5. Financials (Based on Availability)
- 11.2.3 Merck
- 11.2.3.1. Overview
- 11.2.3.2. Products
- 11.2.3.3. SWOT Analysis
- 11.2.3.4. Recent Developments
- 11.2.3.5. Financials (Based on Availability)
- 11.2.4 Greiner Bio-One
- 11.2.4.1. Overview
- 11.2.4.2. Products
- 11.2.4.3. SWOT Analysis
- 11.2.4.4. Recent Developments
- 11.2.4.5. Financials (Based on Availability)
- 11.2.5 Lonza Group
- 11.2.5.1. Overview
- 11.2.5.2. Products
- 11.2.5.3. SWOT Analysis
- 11.2.5.4. Recent Developments
- 11.2.5.5. Financials (Based on Availability)
- 11.2.6 Emulate
- 11.2.6.1. Overview
- 11.2.6.2. Products
- 11.2.6.3. SWOT Analysis
- 11.2.6.4. Recent Developments
- 11.2.6.5. Financials (Based on Availability)
- 11.2.7 TissUse
- 11.2.7.1. Overview
- 11.2.7.2. Products
- 11.2.7.3. SWOT Analysis
- 11.2.7.4. Recent Developments
- 11.2.7.5. Financials (Based on Availability)
- 11.2.8 CN Bio
- 11.2.8.1. Overview
- 11.2.8.2. Products
- 11.2.8.3. SWOT Analysis
- 11.2.8.4. Recent Developments
- 11.2.8.5. Financials (Based on Availability)
- 11.2.9 TARA Biosystems
- 11.2.9.1. Overview
- 11.2.9.2. Products
- 11.2.9.3. SWOT Analysis
- 11.2.9.4. Recent Developments
- 11.2.9.5. Financials (Based on Availability)
- 11.2.10 Mimetas
- 11.2.10.1. Overview
- 11.2.10.2. Products
- 11.2.10.3. SWOT Analysis
- 11.2.10.4. Recent Developments
- 11.2.10.5. Financials (Based on Availability)
- 11.2.11 Nortis
- 11.2.11.1. Overview
- 11.2.11.2. Products
- 11.2.11.3. SWOT Analysis
- 11.2.11.4. Recent Developments
- 11.2.11.5. Financials (Based on Availability)
- 11.2.12 Reprocell Incorporated
- 11.2.12.1. Overview
- 11.2.12.2. Products
- 11.2.12.3. SWOT Analysis
- 11.2.12.4. Recent Developments
- 11.2.12.5. Financials (Based on Availability)
- 11.2.13 Jet Bio-Filtration
- 11.2.13.1. Overview
- 11.2.13.2. Products
- 11.2.13.3. SWOT Analysis
- 11.2.13.4. Recent Developments
- 11.2.13.5. Financials (Based on Availability)
- 11.2.14 InSphero AG
- 11.2.14.1. Overview
- 11.2.14.2. Products
- 11.2.14.3. SWOT Analysis
- 11.2.14.4. Recent Developments
- 11.2.14.5. Financials (Based on Availability)
- 11.2.15 3D Biotek
- 11.2.15.1. Overview
- 11.2.15.2. Products
- 11.2.15.3. SWOT Analysis
- 11.2.15.4. Recent Developments
- 11.2.15.5. Financials (Based on Availability)
- 11.2.1 Thermo Fisher Scientific
List of Figures
- Figure 1: Global 3D Stem Cell Culture Revenue Breakdown (million, %) by Region 2025 & 2033
- Figure 2: North America 3D Stem Cell Culture Revenue (million), by Application 2025 & 2033
- Figure 3: North America 3D Stem Cell Culture Revenue Share (%), by Application 2025 & 2033
- Figure 4: North America 3D Stem Cell Culture Revenue (million), by Types 2025 & 2033
- Figure 5: North America 3D Stem Cell Culture Revenue Share (%), by Types 2025 & 2033
- Figure 6: North America 3D Stem Cell Culture Revenue (million), by Country 2025 & 2033
- Figure 7: North America 3D Stem Cell Culture Revenue Share (%), by Country 2025 & 2033
- Figure 8: South America 3D Stem Cell Culture Revenue (million), by Application 2025 & 2033
- Figure 9: South America 3D Stem Cell Culture Revenue Share (%), by Application 2025 & 2033
- Figure 10: South America 3D Stem Cell Culture Revenue (million), by Types 2025 & 2033
- Figure 11: South America 3D Stem Cell Culture Revenue Share (%), by Types 2025 & 2033
- Figure 12: South America 3D Stem Cell Culture Revenue (million), by Country 2025 & 2033
- Figure 13: South America 3D Stem Cell Culture Revenue Share (%), by Country 2025 & 2033
- Figure 14: Europe 3D Stem Cell Culture Revenue (million), by Application 2025 & 2033
- Figure 15: Europe 3D Stem Cell Culture Revenue Share (%), by Application 2025 & 2033
- Figure 16: Europe 3D Stem Cell Culture Revenue (million), by Types 2025 & 2033
- Figure 17: Europe 3D Stem Cell Culture Revenue Share (%), by Types 2025 & 2033
- Figure 18: Europe 3D Stem Cell Culture Revenue (million), by Country 2025 & 2033
- Figure 19: Europe 3D Stem Cell Culture Revenue Share (%), by Country 2025 & 2033
- Figure 20: Middle East & Africa 3D Stem Cell Culture Revenue (million), by Application 2025 & 2033
- Figure 21: Middle East & Africa 3D Stem Cell Culture Revenue Share (%), by Application 2025 & 2033
- Figure 22: Middle East & Africa 3D Stem Cell Culture Revenue (million), by Types 2025 & 2033
- Figure 23: Middle East & Africa 3D Stem Cell Culture Revenue Share (%), by Types 2025 & 2033
- Figure 24: Middle East & Africa 3D Stem Cell Culture Revenue (million), by Country 2025 & 2033
- Figure 25: Middle East & Africa 3D Stem Cell Culture Revenue Share (%), by Country 2025 & 2033
- Figure 26: Asia Pacific 3D Stem Cell Culture Revenue (million), by Application 2025 & 2033
- Figure 27: Asia Pacific 3D Stem Cell Culture Revenue Share (%), by Application 2025 & 2033
- Figure 28: Asia Pacific 3D Stem Cell Culture Revenue (million), by Types 2025 & 2033
- Figure 29: Asia Pacific 3D Stem Cell Culture Revenue Share (%), by Types 2025 & 2033
- Figure 30: Asia Pacific 3D Stem Cell Culture Revenue (million), by Country 2025 & 2033
- Figure 31: Asia Pacific 3D Stem Cell Culture Revenue Share (%), by Country 2025 & 2033
List of Tables
- Table 1: Global 3D Stem Cell Culture Revenue million Forecast, by Application 2020 & 2033
- Table 2: Global 3D Stem Cell Culture Revenue million Forecast, by Types 2020 & 2033
- Table 3: Global 3D Stem Cell Culture Revenue million Forecast, by Region 2020 & 2033
- Table 4: Global 3D Stem Cell Culture Revenue million Forecast, by Application 2020 & 2033
- Table 5: Global 3D Stem Cell Culture Revenue million Forecast, by Types 2020 & 2033
- Table 6: Global 3D Stem Cell Culture Revenue million Forecast, by Country 2020 & 2033
- Table 7: United States 3D Stem Cell Culture Revenue (million) Forecast, by Application 2020 & 2033
- Table 8: Canada 3D Stem Cell Culture Revenue (million) Forecast, by Application 2020 & 2033
- Table 9: Mexico 3D Stem Cell Culture Revenue (million) Forecast, by Application 2020 & 2033
- Table 10: Global 3D Stem Cell Culture Revenue million Forecast, by Application 2020 & 2033
- Table 11: Global 3D Stem Cell Culture Revenue million Forecast, by Types 2020 & 2033
- Table 12: Global 3D Stem Cell Culture Revenue million Forecast, by Country 2020 & 2033
- Table 13: Brazil 3D Stem Cell Culture Revenue (million) Forecast, by Application 2020 & 2033
- Table 14: Argentina 3D Stem Cell Culture Revenue (million) Forecast, by Application 2020 & 2033
- Table 15: Rest of South America 3D Stem Cell Culture Revenue (million) Forecast, by Application 2020 & 2033
- Table 16: Global 3D Stem Cell Culture Revenue million Forecast, by Application 2020 & 2033
- Table 17: Global 3D Stem Cell Culture Revenue million Forecast, by Types 2020 & 2033
- Table 18: Global 3D Stem Cell Culture Revenue million Forecast, by Country 2020 & 2033
- Table 19: United Kingdom 3D Stem Cell Culture Revenue (million) Forecast, by Application 2020 & 2033
- Table 20: Germany 3D Stem Cell Culture Revenue (million) Forecast, by Application 2020 & 2033
- Table 21: France 3D Stem Cell Culture Revenue (million) Forecast, by Application 2020 & 2033
- Table 22: Italy 3D Stem Cell Culture Revenue (million) Forecast, by Application 2020 & 2033
- Table 23: Spain 3D Stem Cell Culture Revenue (million) Forecast, by Application 2020 & 2033
- Table 24: Russia 3D Stem Cell Culture Revenue (million) Forecast, by Application 2020 & 2033
- Table 25: Benelux 3D Stem Cell Culture Revenue (million) Forecast, by Application 2020 & 2033
- Table 26: Nordics 3D Stem Cell Culture Revenue (million) Forecast, by Application 2020 & 2033
- Table 27: Rest of Europe 3D Stem Cell Culture Revenue (million) Forecast, by Application 2020 & 2033
- Table 28: Global 3D Stem Cell Culture Revenue million Forecast, by Application 2020 & 2033
- Table 29: Global 3D Stem Cell Culture Revenue million Forecast, by Types 2020 & 2033
- Table 30: Global 3D Stem Cell Culture Revenue million Forecast, by Country 2020 & 2033
- Table 31: Turkey 3D Stem Cell Culture Revenue (million) Forecast, by Application 2020 & 2033
- Table 32: Israel 3D Stem Cell Culture Revenue (million) Forecast, by Application 2020 & 2033
- Table 33: GCC 3D Stem Cell Culture Revenue (million) Forecast, by Application 2020 & 2033
- Table 34: North Africa 3D Stem Cell Culture Revenue (million) Forecast, by Application 2020 & 2033
- Table 35: South Africa 3D Stem Cell Culture Revenue (million) Forecast, by Application 2020 & 2033
- Table 36: Rest of Middle East & Africa 3D Stem Cell Culture Revenue (million) Forecast, by Application 2020 & 2033
- Table 37: Global 3D Stem Cell Culture Revenue million Forecast, by Application 2020 & 2033
- Table 38: Global 3D Stem Cell Culture Revenue million Forecast, by Types 2020 & 2033
- Table 39: Global 3D Stem Cell Culture Revenue million Forecast, by Country 2020 & 2033
- Table 40: China 3D Stem Cell Culture Revenue (million) Forecast, by Application 2020 & 2033
- Table 41: India 3D Stem Cell Culture Revenue (million) Forecast, by Application 2020 & 2033
- Table 42: Japan 3D Stem Cell Culture Revenue (million) Forecast, by Application 2020 & 2033
- Table 43: South Korea 3D Stem Cell Culture Revenue (million) Forecast, by Application 2020 & 2033
- Table 44: ASEAN 3D Stem Cell Culture Revenue (million) Forecast, by Application 2020 & 2033
- Table 45: Oceania 3D Stem Cell Culture Revenue (million) Forecast, by Application 2020 & 2033
- Table 46: Rest of Asia Pacific 3D Stem Cell Culture Revenue (million) Forecast, by Application 2020 & 2033
Frequently Asked Questions
1. What is the projected Compound Annual Growth Rate (CAGR) of the 3D Stem Cell Culture?
The projected CAGR is approximately 13.2%.
2. Which companies are prominent players in the 3D Stem Cell Culture?
Key companies in the market include Thermo Fisher Scientific, Corning, Merck, Greiner Bio-One, Lonza Group, Emulate, TissUse, CN Bio, TARA Biosystems, Mimetas, Nortis, Reprocell Incorporated, Jet Bio-Filtration, InSphero AG, 3D Biotek.
3. What are the main segments of the 3D Stem Cell Culture?
The market segments include Application, Types.
4. Can you provide details about the market size?
The market size is estimated to be USD 271 million as of 2022.
5. What are some drivers contributing to market growth?
N/A
6. What are the notable trends driving market growth?
N/A
7. Are there any restraints impacting market growth?
N/A
8. Can you provide examples of recent developments in the market?
N/A
9. What pricing options are available for accessing the report?
Pricing options include single-user, multi-user, and enterprise licenses priced at USD 4900.00, USD 7350.00, and USD 9800.00 respectively.
10. Is the market size provided in terms of value or volume?
The market size is provided in terms of value, measured in million.
11. Are there any specific market keywords associated with the report?
Yes, the market keyword associated with the report is "3D Stem Cell Culture," which aids in identifying and referencing the specific market segment covered.
12. How do I determine which pricing option suits my needs best?
The pricing options vary based on user requirements and access needs. Individual users may opt for single-user licenses, while businesses requiring broader access may choose multi-user or enterprise licenses for cost-effective access to the report.
13. Are there any additional resources or data provided in the 3D Stem Cell Culture report?
While the report offers comprehensive insights, it's advisable to review the specific contents or supplementary materials provided to ascertain if additional resources or data are available.
14. How can I stay updated on further developments or reports in the 3D Stem Cell Culture?
To stay informed about further developments, trends, and reports in the 3D Stem Cell Culture, consider subscribing to industry newsletters, following relevant companies and organizations, or regularly checking reputable industry news sources and publications.
Methodology
Step 1 - Identification of Relevant Samples Size from Population Database


Step 2 - Approaches for Defining Global Market Size (Value, Volume* & Price*)

Note*: In applicable scenarios
Step 3 - Data Sources
Primary Research
- Web Analytics
- Survey Reports
- Research Institute
- Latest Research Reports
- Opinion Leaders
Secondary Research
- Annual Reports
- White Paper
- Latest Press Release
- Industry Association
- Paid Database
- Investor Presentations

Step 4 - Data Triangulation
Involves using different sources of information in order to increase the validity of a study
These sources are likely to be stakeholders in a program - participants, other researchers, program staff, other community members, and so on.
Then we put all data in single framework & apply various statistical tools to find out the dynamic on the market.
During the analysis stage, feedback from the stakeholder groups would be compared to determine areas of agreement as well as areas of divergence