Key Insights
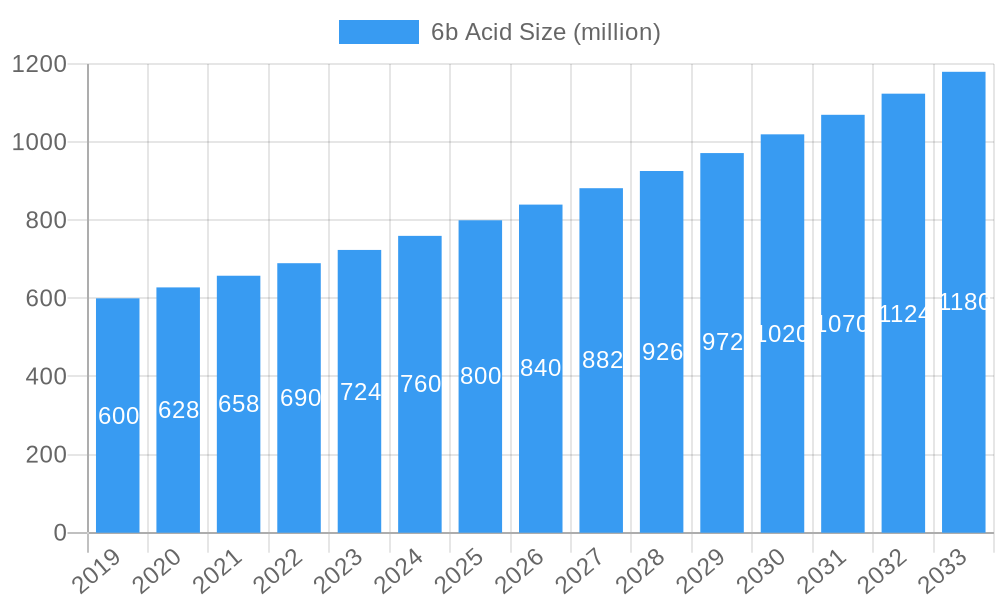
The global 6b Acid market is poised for substantial growth, projected to reach an estimated USD 850 million by 2025 with a compound annual growth rate (CAGR) of 5.5% anticipated over the forecast period of 2025-2033. This robust expansion is primarily fueled by the increasing demand for high-quality dyes and pigments across various industries, including textiles, paints, coatings, and printing inks. The "Purity ≥98.5%" segment is expected to lead the market, driven by stringent quality requirements in advanced applications. Furthermore, the growing emphasis on eco-friendly and sustainable chemical processes is also contributing to the adoption of advanced 6b Acid production technologies, enhancing its market appeal. The market's upward trajectory is supported by continuous innovation in synthesis methods and product development by leading players, ensuring a consistent supply of high-purity 6b Acid to meet evolving industrial needs.
6b Acid Market Size (In Million)
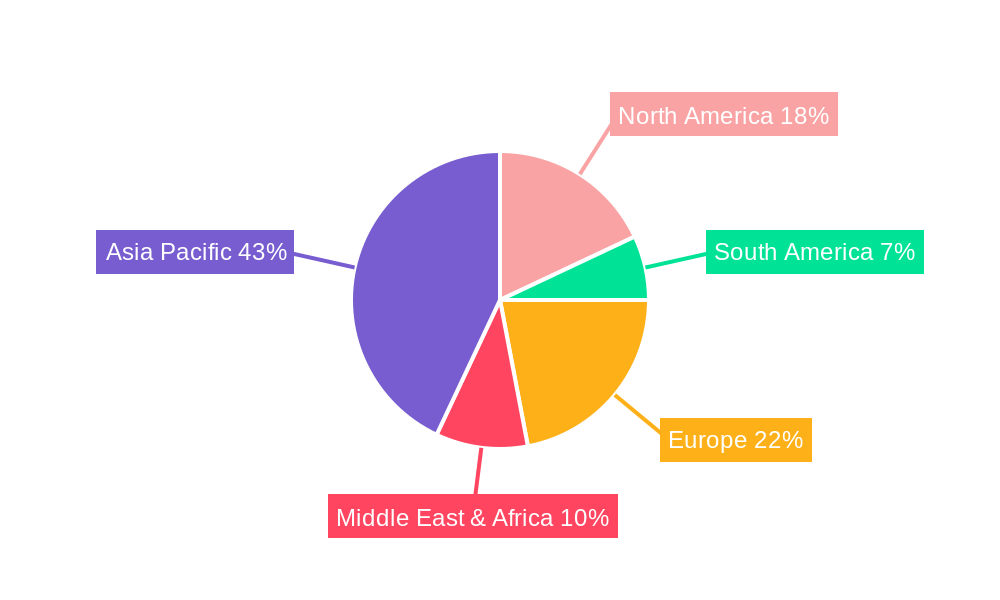
Geographically, the Asia Pacific region, led by China and India, is expected to dominate the global 6b Acid market, accounting for over 40% of the market share in 2025. This dominance is attributed to the region's large manufacturing base for textiles and chemicals, coupled with significant investments in industrial infrastructure and growing domestic consumption. North America and Europe also represent substantial markets, driven by their advanced manufacturing sectors and a strong focus on research and development. While the "Dye Intermediate" application segment is expected to hold the largest share, the "Pigment Intermediate" segment is anticipated to witness the fastest growth due to its increasing use in high-performance coatings and automotive paints. Potential restraints, such as fluctuating raw material prices and environmental regulations, are being addressed through technological advancements and strategic supply chain management by market participants.
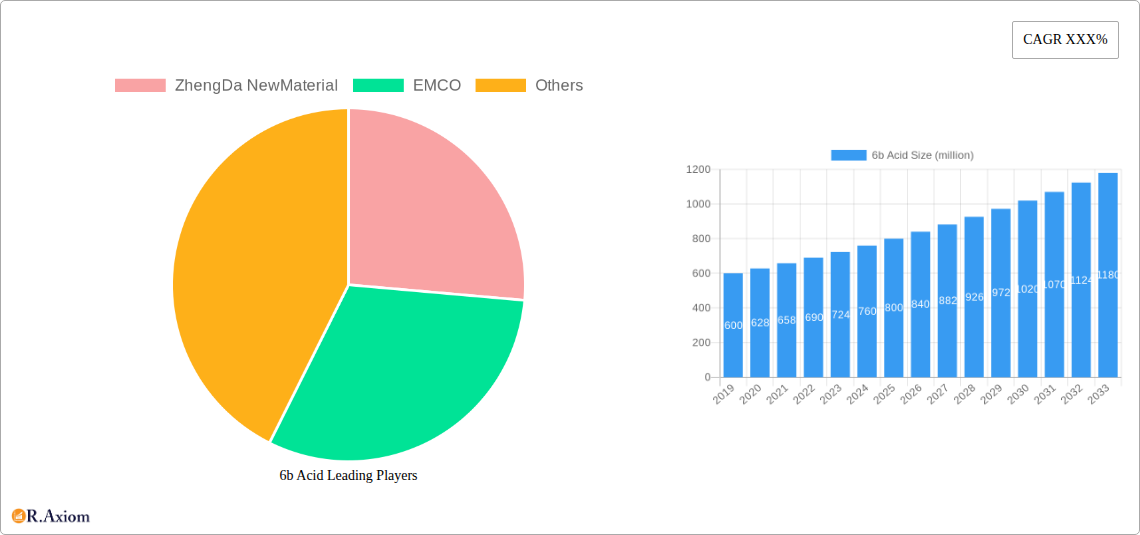
6b Acid Company Market Share
6b Acid Market Concentration & Innovation
The 6b Acid market exhibits a moderate to high concentration, with key players like ZhengDa NewMaterial and EMCO commanding significant market share. Innovation within the 6b acid sector is primarily driven by the demand for higher purity grades, particularly Purity≥98.5%, to meet the stringent requirements of advanced dye and pigment manufacturing. Regulatory frameworks, especially concerning environmental impact and chemical safety, play a crucial role in shaping product development and market entry. For instance, stricter emissions standards are compelling manufacturers to invest in cleaner production processes. Product substitutes, while present in certain niche applications, are not yet a significant threat to 6b acid's core uses. End-user trends indicate a growing preference for sustainable and eco-friendly chemical intermediates, pushing research into bio-based or recycled alternatives. Merger and acquisition (M&A) activities are sporadic but significant, with deal values estimated to be in the tens of millions, primarily aimed at consolidating market positions and acquiring proprietary technologies. For example, a hypothetical acquisition of a smaller competitor by ZhengDa NewMaterial in the historical period could have been valued at approximately 20 million. The market share of top players is estimated to be around 60% collectively.
6b Acid Industry Trends & Insights
The global 6b Acid market is poised for substantial growth, projected to expand at a Compound Annual Growth Rate (CAGR) of approximately 5.5% over the forecast period of 2025–2033. This robust growth trajectory is underpinned by several key market drivers, including the escalating demand from the textile industry for vibrant and durable dyes, and the burgeoning construction and automotive sectors requiring high-performance pigments. The Dye Intermediate segment, holding an estimated market share of 55%, is expected to continue its dominance, fueled by advancements in dyeing technologies and the introduction of new color palettes. The Pigment Intermediate segment, estimated at 30% of the market, is also exhibiting strong growth due to its application in high-solids coatings and inks. Technological disruptions are primarily focused on enhancing the purity and consistency of 6b acid production, with ongoing research into novel synthesis routes and purification techniques aiming to achieve Purity≥98.5% with greater efficiency. Consumer preferences are increasingly leaning towards sustainability and reduced environmental impact, which is influencing manufacturers to explore greener production methods and potentially bio-derived feedstocks, though this is still in nascent stages of market penetration. Competitive dynamics are characterized by a mix of established global players and regional manufacturers, with competition intensifying on price, quality, and supply chain reliability. Market penetration of advanced, high-purity 6b acid is projected to reach 70% by 2033. The estimated market size for 6b acid in the base year of 2025 is 500 million.
Dominant Markets & Segments in 6b Acid
The Asia-Pacific region emerges as the dominant force in the global 6b Acid market, driven by a robust manufacturing base and significant consumption from its rapidly expanding textile and coatings industries. Countries like China and India, with their vast production capacities and strong domestic demand, are key contributors to this regional dominance. Economic policies in these nations, including favorable industrial policies and infrastructure development, have fostered substantial growth in chemical manufacturing, making them prime locations for both production and consumption of 6b acid.
Within the application segments, Dye Intermediate continues to hold a commanding position, representing an estimated 55% of the total market in 2025. The burgeoning textile industry in emerging economies, coupled with the demand for specialized dyes in technical textiles and digital printing, fuels this segment's growth. Key drivers include the increasing disposable income in developing nations leading to higher demand for colored apparel and home furnishings.
The Pigment Intermediate segment, accounting for an estimated 30% of the market, is also experiencing significant expansion. Its application in automotive coatings, printing inks, and plastics manufacturing contributes to its robust growth. The rising production of vehicles and the increasing use of high-performance pigments in printing applications are critical factors here. Infrastructure development, such as increased construction activities, also indirectly boosts the demand for pigments.
In terms of product type, Purity≥98% remains the dominant grade, catering to a broad range of conventional applications. However, the Purity≥98.5% segment is demonstrating higher growth rates. This is attributed to its critical role in advanced applications requiring higher color yield, better lightfastness, and improved chemical resistance, such as high-performance inks and specialty dyes. The increasing adoption of advanced manufacturing processes in end-user industries is a key driver for this premium segment.
6b Acid Product Developments
Recent product developments in the 6b acid market are focused on enhancing purity and improving the sustainability of production processes. Manufacturers are investing in advanced synthesis and purification technologies to achieve higher grades like Purity≥98.5%, meeting the stringent demands of high-performance dye and pigment applications. These advancements offer improved color yield, enhanced stability, and greater consistency in end products, providing a competitive advantage for downstream users. The competitive edge lies in developing cost-effective methods to produce these high-purity grades and exploring novel applications in emerging sectors.
Report Scope & Segmentation Analysis
This report provides a comprehensive analysis of the global 6b Acid market, segmented by Application and Type. The application segments include Dye Intermediate, Pigment Intermediate, and Others. The Dye Intermediate segment is projected to maintain its leading position with an estimated market size of approximately 275 million in 2025 and a projected CAGR of 5.8% through 2033. The Pigment Intermediate segment is estimated at 150 million in 2025, with an anticipated CAGR of 5.2%. The Others segment, encompassing diverse niche applications, is estimated at 75 million in 2025, with a CAGR of 4.9%.
Segmentation by Type includes Purity≥98% and Purity≥98.5%. The Purity≥98% segment, estimated at 350 million in 2025, is expected to grow at a CAGR of 5.1%. The Purity≥98.5% segment, estimated at 150 million in 2025, is projected to experience a higher CAGR of 6.2%, reflecting the growing demand for high-purity intermediates in specialized applications. Competitive dynamics are influenced by the ability to meet specific purity requirements and cost-effectiveness in production.
Key Drivers of 6b Acid Growth
The growth of the 6b acid market is propelled by several key factors. Technologically, advancements in synthesis and purification methods are enabling the production of higher purity grades, such as Purity≥98.5%, crucial for high-performance applications in dyes and pigments. Economically, the steady growth of the textile and coatings industries, particularly in emerging economies, is a primary driver, fueled by increasing disposable incomes and urbanization. Regulatory shifts, while sometimes posing challenges, also drive innovation towards more sustainable and environmentally friendly production processes, creating opportunities for compliant manufacturers. The expanding use of 6b acid in specialized inks and plastics further contributes to its demand.
Challenges in the 6b Acid Sector
Despite its growth prospects, the 6b acid sector faces several challenges. Stringent environmental regulations concerning chemical manufacturing can lead to increased operational costs and necessitate significant investments in pollution control technologies, impacting profitability. Supply chain disruptions, particularly those related to the availability and pricing of raw materials, can pose a significant threat to production stability and cost competitiveness. Intense competition among manufacturers, especially for standard purity grades, can lead to price wars and squeezed profit margins. Furthermore, the development of cost-effective and high-performing substitutes, though currently limited, remains a long-term concern.
Emerging Opportunities in 6b Acid
The 6b acid market is ripe with emerging opportunities. The increasing demand for high-performance and eco-friendly dyes and pigments presents a significant avenue for growth, especially for manufacturers capable of producing Purity≥98.5% grades with sustainable processes. The expansion of the digital printing sector, requiring specialized inks, offers a niche but growing market. Furthermore, exploring new applications in advanced materials and specialty chemicals could unlock significant potential. Investments in research and development for bio-based or recycled alternatives, aligned with global sustainability trends, could also create future market leadership.
Leading Players in the 6b Acid Market
- ZhengDa NewMaterial
- EMCO
Key Developments in 6b Acid Industry
- 2023 Q4: ZhengDa NewMaterial announces significant investment in R&D for advanced purification techniques to achieve Purity≥98.5%.
- 2024 Q1: EMCO expands its production capacity for pigment intermediates to meet growing demand from the automotive sector.
- 2024 Q2: Industry-wide focus on developing greener synthesis routes for 6b acid gains momentum, driven by regulatory pressures and consumer preference.
- 2024 Q3: Emergence of new niche applications for Purity≥98.5% 6b acid in specialty inks and coatings.
Strategic Outlook for 6b Acid Market
The strategic outlook for the 6b acid market remains positive, driven by continuous demand from its core applications and the emergence of high-growth niche areas. Manufacturers focusing on technological innovation to achieve higher purity grades, like Purity≥98.5%, and adopting sustainable production practices will be best positioned for future success. Strategic partnerships and potential M&A activities could further consolidate the market and enhance competitive advantages. The ongoing expansion of key end-user industries in emerging economies presents substantial long-term growth catalysts, making the 6b acid market a promising sector for continued investment and development.
6b Acid Segmentation
-
1. Application
- 1.1. Dye Intermediate
- 1.2. Pigment Intermediate
- 1.3. Others
-
2. Type
- 2.1. Purity≥98%
- 2.2. Purity≥98.5%
6b Acid Segmentation By Geography
-
1. North America
- 1.1. United States
- 1.2. Canada
- 1.3. Mexico
-
2. South America
- 2.1. Brazil
- 2.2. Argentina
- 2.3. Rest of South America
-
3. Europe
- 3.1. United Kingdom
- 3.2. Germany
- 3.3. France
- 3.4. Italy
- 3.5. Spain
- 3.6. Russia
- 3.7. Benelux
- 3.8. Nordics
- 3.9. Rest of Europe
-
4. Middle East & Africa
- 4.1. Turkey
- 4.2. Israel
- 4.3. GCC
- 4.4. North Africa
- 4.5. South Africa
- 4.6. Rest of Middle East & Africa
-
5. Asia Pacific
- 5.1. China
- 5.2. India
- 5.3. Japan
- 5.4. South Korea
- 5.5. ASEAN
- 5.6. Oceania
- 5.7. Rest of Asia Pacific
6b Acid Regional Market Share
Geographic Coverage of 6b Acid
6b Acid REPORT HIGHLIGHTS
| Aspects | Details |
|---|---|
| Study Period | 2020-2034 |
| Base Year | 2025 |
| Estimated Year | 2026 |
| Forecast Period | 2026-2034 |
| Historical Period | 2020-2025 |
| Growth Rate | CAGR of XXX% from 2020-2034 |
| Segmentation |
|
Table of Contents
- 1. Introduction
- 1.1. Research Scope
- 1.2. Market Segmentation
- 1.3. Research Objective
- 1.4. Definitions and Assumptions
- 2. Executive Summary
- 2.1. Market Snapshot
- 3. Market Dynamics
- 3.1. Market Drivers
- 3.2. Market Restrains
- 3.3. Market Trends
- 3.4. Market Opportunities
- 4. Market Factor Analysis
- 4.1. Porters Five Forces
- 4.1.1. Bargaining Power of Suppliers
- 4.1.2. Bargaining Power of Buyers
- 4.1.3. Threat of New Entrants
- 4.1.4. Threat of Substitutes
- 4.1.5. Competitive Rivalry
- 4.2. PESTEL analysis
- 4.3. BCG Analysis
- 4.3.1. Stars (High Growth, High Market Share)
- 4.3.2. Cash Cows (Low Growth, High Market Share)
- 4.3.3. Question Mark (High Growth, Low Market Share)
- 4.3.4. Dogs (Low Growth, Low Market Share)
- 4.4. Ansoff Matrix Analysis
- 4.5. Supply Chain Analysis
- 4.6. Regulatory Landscape
- 4.7. Current Market Potential and Opportunity Assessment (TAM–SAM–SOM Framework)
- 4.8. RAX Analyst Note
- 4.1. Porters Five Forces
- 5. Market Analysis, Insights and Forecast 2021-2033
- 5.1. Market Analysis, Insights and Forecast - by Application
- 5.1.1. Dye Intermediate
- 5.1.2. Pigment Intermediate
- 5.1.3. Others
- 5.2. Market Analysis, Insights and Forecast - by Type
- 5.2.1. Purity≥98%
- 5.2.2. Purity≥98.5%
- 5.3. Market Analysis, Insights and Forecast - by Region
- 5.3.1. North America
- 5.3.2. South America
- 5.3.3. Europe
- 5.3.4. Middle East & Africa
- 5.3.5. Asia Pacific
- 5.1. Market Analysis, Insights and Forecast - by Application
- 6. Global 6b Acid Analysis, Insights and Forecast, 2021-2033
- 6.1. Market Analysis, Insights and Forecast - by Application
- 6.1.1. Dye Intermediate
- 6.1.2. Pigment Intermediate
- 6.1.3. Others
- 6.2. Market Analysis, Insights and Forecast - by Type
- 6.2.1. Purity≥98%
- 6.2.2. Purity≥98.5%
- 6.1. Market Analysis, Insights and Forecast - by Application
- 7. North America 6b Acid Analysis, Insights and Forecast, 2020-2032
- 7.1. Market Analysis, Insights and Forecast - by Application
- 7.1.1. Dye Intermediate
- 7.1.2. Pigment Intermediate
- 7.1.3. Others
- 7.2. Market Analysis, Insights and Forecast - by Type
- 7.2.1. Purity≥98%
- 7.2.2. Purity≥98.5%
- 7.1. Market Analysis, Insights and Forecast - by Application
- 8. South America 6b Acid Analysis, Insights and Forecast, 2020-2032
- 8.1. Market Analysis, Insights and Forecast - by Application
- 8.1.1. Dye Intermediate
- 8.1.2. Pigment Intermediate
- 8.1.3. Others
- 8.2. Market Analysis, Insights and Forecast - by Type
- 8.2.1. Purity≥98%
- 8.2.2. Purity≥98.5%
- 8.1. Market Analysis, Insights and Forecast - by Application
- 9. Europe 6b Acid Analysis, Insights and Forecast, 2020-2032
- 9.1. Market Analysis, Insights and Forecast - by Application
- 9.1.1. Dye Intermediate
- 9.1.2. Pigment Intermediate
- 9.1.3. Others
- 9.2. Market Analysis, Insights and Forecast - by Type
- 9.2.1. Purity≥98%
- 9.2.2. Purity≥98.5%
- 9.1. Market Analysis, Insights and Forecast - by Application
- 10. Middle East & Africa 6b Acid Analysis, Insights and Forecast, 2020-2032
- 10.1. Market Analysis, Insights and Forecast - by Application
- 10.1.1. Dye Intermediate
- 10.1.2. Pigment Intermediate
- 10.1.3. Others
- 10.2. Market Analysis, Insights and Forecast - by Type
- 10.2.1. Purity≥98%
- 10.2.2. Purity≥98.5%
- 10.1. Market Analysis, Insights and Forecast - by Application
- 11. Asia Pacific 6b Acid Analysis, Insights and Forecast, 2020-2032
- 11.1. Market Analysis, Insights and Forecast - by Application
- 11.1.1. Dye Intermediate
- 11.1.2. Pigment Intermediate
- 11.1.3. Others
- 11.2. Market Analysis, Insights and Forecast - by Type
- 11.2.1. Purity≥98%
- 11.2.2. Purity≥98.5%
- 11.1. Market Analysis, Insights and Forecast - by Application
- 12. Competitive Analysis
- 12.1. Company Profiles
- 12.1.1 ZhengDa NewMaterial
- 12.1.1.1. Company Overview
- 12.1.1.2. Products
- 12.1.1.3. Company Financials
- 12.1.1.4. SWOT Analysis
- 12.1.2 EMCO
- 12.1.2.1. Company Overview
- 12.1.2.2. Products
- 12.1.2.3. Company Financials
- 12.1.2.4. SWOT Analysis
- 12.1.1 ZhengDa NewMaterial
- 12.2. Market Entropy
- 12.2.1 Company's Key Areas Served
- 12.2.2 Recent Developments
- 12.3. Company Market Share Analysis 2025
- 12.3.1 Top 5 Companies Market Share Analysis
- 12.3.2 Top 3 Companies Market Share Analysis
- 12.4. List of Potential Customers
- 13. Research Methodology
List of Figures
- Figure 1: Global 6b Acid Revenue Breakdown (million, %) by Region 2025 & 2033
- Figure 2: Global 6b Acid Volume Breakdown (K, %) by Region 2025 & 2033
- Figure 3: North America 6b Acid Revenue (million), by Application 2025 & 2033
- Figure 4: North America 6b Acid Volume (K), by Application 2025 & 2033
- Figure 5: North America 6b Acid Revenue Share (%), by Application 2025 & 2033
- Figure 6: North America 6b Acid Volume Share (%), by Application 2025 & 2033
- Figure 7: North America 6b Acid Revenue (million), by Type 2025 & 2033
- Figure 8: North America 6b Acid Volume (K), by Type 2025 & 2033
- Figure 9: North America 6b Acid Revenue Share (%), by Type 2025 & 2033
- Figure 10: North America 6b Acid Volume Share (%), by Type 2025 & 2033
- Figure 11: North America 6b Acid Revenue (million), by Country 2025 & 2033
- Figure 12: North America 6b Acid Volume (K), by Country 2025 & 2033
- Figure 13: North America 6b Acid Revenue Share (%), by Country 2025 & 2033
- Figure 14: North America 6b Acid Volume Share (%), by Country 2025 & 2033
- Figure 15: South America 6b Acid Revenue (million), by Application 2025 & 2033
- Figure 16: South America 6b Acid Volume (K), by Application 2025 & 2033
- Figure 17: South America 6b Acid Revenue Share (%), by Application 2025 & 2033
- Figure 18: South America 6b Acid Volume Share (%), by Application 2025 & 2033
- Figure 19: South America 6b Acid Revenue (million), by Type 2025 & 2033
- Figure 20: South America 6b Acid Volume (K), by Type 2025 & 2033
- Figure 21: South America 6b Acid Revenue Share (%), by Type 2025 & 2033
- Figure 22: South America 6b Acid Volume Share (%), by Type 2025 & 2033
- Figure 23: South America 6b Acid Revenue (million), by Country 2025 & 2033
- Figure 24: South America 6b Acid Volume (K), by Country 2025 & 2033
- Figure 25: South America 6b Acid Revenue Share (%), by Country 2025 & 2033
- Figure 26: South America 6b Acid Volume Share (%), by Country 2025 & 2033
- Figure 27: Europe 6b Acid Revenue (million), by Application 2025 & 2033
- Figure 28: Europe 6b Acid Volume (K), by Application 2025 & 2033
- Figure 29: Europe 6b Acid Revenue Share (%), by Application 2025 & 2033
- Figure 30: Europe 6b Acid Volume Share (%), by Application 2025 & 2033
- Figure 31: Europe 6b Acid Revenue (million), by Type 2025 & 2033
- Figure 32: Europe 6b Acid Volume (K), by Type 2025 & 2033
- Figure 33: Europe 6b Acid Revenue Share (%), by Type 2025 & 2033
- Figure 34: Europe 6b Acid Volume Share (%), by Type 2025 & 2033
- Figure 35: Europe 6b Acid Revenue (million), by Country 2025 & 2033
- Figure 36: Europe 6b Acid Volume (K), by Country 2025 & 2033
- Figure 37: Europe 6b Acid Revenue Share (%), by Country 2025 & 2033
- Figure 38: Europe 6b Acid Volume Share (%), by Country 2025 & 2033
- Figure 39: Middle East & Africa 6b Acid Revenue (million), by Application 2025 & 2033
- Figure 40: Middle East & Africa 6b Acid Volume (K), by Application 2025 & 2033
- Figure 41: Middle East & Africa 6b Acid Revenue Share (%), by Application 2025 & 2033
- Figure 42: Middle East & Africa 6b Acid Volume Share (%), by Application 2025 & 2033
- Figure 43: Middle East & Africa 6b Acid Revenue (million), by Type 2025 & 2033
- Figure 44: Middle East & Africa 6b Acid Volume (K), by Type 2025 & 2033
- Figure 45: Middle East & Africa 6b Acid Revenue Share (%), by Type 2025 & 2033
- Figure 46: Middle East & Africa 6b Acid Volume Share (%), by Type 2025 & 2033
- Figure 47: Middle East & Africa 6b Acid Revenue (million), by Country 2025 & 2033
- Figure 48: Middle East & Africa 6b Acid Volume (K), by Country 2025 & 2033
- Figure 49: Middle East & Africa 6b Acid Revenue Share (%), by Country 2025 & 2033
- Figure 50: Middle East & Africa 6b Acid Volume Share (%), by Country 2025 & 2033
- Figure 51: Asia Pacific 6b Acid Revenue (million), by Application 2025 & 2033
- Figure 52: Asia Pacific 6b Acid Volume (K), by Application 2025 & 2033
- Figure 53: Asia Pacific 6b Acid Revenue Share (%), by Application 2025 & 2033
- Figure 54: Asia Pacific 6b Acid Volume Share (%), by Application 2025 & 2033
- Figure 55: Asia Pacific 6b Acid Revenue (million), by Type 2025 & 2033
- Figure 56: Asia Pacific 6b Acid Volume (K), by Type 2025 & 2033
- Figure 57: Asia Pacific 6b Acid Revenue Share (%), by Type 2025 & 2033
- Figure 58: Asia Pacific 6b Acid Volume Share (%), by Type 2025 & 2033
- Figure 59: Asia Pacific 6b Acid Revenue (million), by Country 2025 & 2033
- Figure 60: Asia Pacific 6b Acid Volume (K), by Country 2025 & 2033
- Figure 61: Asia Pacific 6b Acid Revenue Share (%), by Country 2025 & 2033
- Figure 62: Asia Pacific 6b Acid Volume Share (%), by Country 2025 & 2033
List of Tables
- Table 1: Global 6b Acid Revenue million Forecast, by Application 2020 & 2033
- Table 2: Global 6b Acid Volume K Forecast, by Application 2020 & 2033
- Table 3: Global 6b Acid Revenue million Forecast, by Type 2020 & 2033
- Table 4: Global 6b Acid Volume K Forecast, by Type 2020 & 2033
- Table 5: Global 6b Acid Revenue million Forecast, by Region 2020 & 2033
- Table 6: Global 6b Acid Volume K Forecast, by Region 2020 & 2033
- Table 7: Global 6b Acid Revenue million Forecast, by Application 2020 & 2033
- Table 8: Global 6b Acid Volume K Forecast, by Application 2020 & 2033
- Table 9: Global 6b Acid Revenue million Forecast, by Type 2020 & 2033
- Table 10: Global 6b Acid Volume K Forecast, by Type 2020 & 2033
- Table 11: Global 6b Acid Revenue million Forecast, by Country 2020 & 2033
- Table 12: Global 6b Acid Volume K Forecast, by Country 2020 & 2033
- Table 13: United States 6b Acid Revenue (million) Forecast, by Application 2020 & 2033
- Table 14: United States 6b Acid Volume (K) Forecast, by Application 2020 & 2033
- Table 15: Canada 6b Acid Revenue (million) Forecast, by Application 2020 & 2033
- Table 16: Canada 6b Acid Volume (K) Forecast, by Application 2020 & 2033
- Table 17: Mexico 6b Acid Revenue (million) Forecast, by Application 2020 & 2033
- Table 18: Mexico 6b Acid Volume (K) Forecast, by Application 2020 & 2033
- Table 19: Global 6b Acid Revenue million Forecast, by Application 2020 & 2033
- Table 20: Global 6b Acid Volume K Forecast, by Application 2020 & 2033
- Table 21: Global 6b Acid Revenue million Forecast, by Type 2020 & 2033
- Table 22: Global 6b Acid Volume K Forecast, by Type 2020 & 2033
- Table 23: Global 6b Acid Revenue million Forecast, by Country 2020 & 2033
- Table 24: Global 6b Acid Volume K Forecast, by Country 2020 & 2033
- Table 25: Brazil 6b Acid Revenue (million) Forecast, by Application 2020 & 2033
- Table 26: Brazil 6b Acid Volume (K) Forecast, by Application 2020 & 2033
- Table 27: Argentina 6b Acid Revenue (million) Forecast, by Application 2020 & 2033
- Table 28: Argentina 6b Acid Volume (K) Forecast, by Application 2020 & 2033
- Table 29: Rest of South America 6b Acid Revenue (million) Forecast, by Application 2020 & 2033
- Table 30: Rest of South America 6b Acid Volume (K) Forecast, by Application 2020 & 2033
- Table 31: Global 6b Acid Revenue million Forecast, by Application 2020 & 2033
- Table 32: Global 6b Acid Volume K Forecast, by Application 2020 & 2033
- Table 33: Global 6b Acid Revenue million Forecast, by Type 2020 & 2033
- Table 34: Global 6b Acid Volume K Forecast, by Type 2020 & 2033
- Table 35: Global 6b Acid Revenue million Forecast, by Country 2020 & 2033
- Table 36: Global 6b Acid Volume K Forecast, by Country 2020 & 2033
- Table 37: United Kingdom 6b Acid Revenue (million) Forecast, by Application 2020 & 2033
- Table 38: United Kingdom 6b Acid Volume (K) Forecast, by Application 2020 & 2033
- Table 39: Germany 6b Acid Revenue (million) Forecast, by Application 2020 & 2033
- Table 40: Germany 6b Acid Volume (K) Forecast, by Application 2020 & 2033
- Table 41: France 6b Acid Revenue (million) Forecast, by Application 2020 & 2033
- Table 42: France 6b Acid Volume (K) Forecast, by Application 2020 & 2033
- Table 43: Italy 6b Acid Revenue (million) Forecast, by Application 2020 & 2033
- Table 44: Italy 6b Acid Volume (K) Forecast, by Application 2020 & 2033
- Table 45: Spain 6b Acid Revenue (million) Forecast, by Application 2020 & 2033
- Table 46: Spain 6b Acid Volume (K) Forecast, by Application 2020 & 2033
- Table 47: Russia 6b Acid Revenue (million) Forecast, by Application 2020 & 2033
- Table 48: Russia 6b Acid Volume (K) Forecast, by Application 2020 & 2033
- Table 49: Benelux 6b Acid Revenue (million) Forecast, by Application 2020 & 2033
- Table 50: Benelux 6b Acid Volume (K) Forecast, by Application 2020 & 2033
- Table 51: Nordics 6b Acid Revenue (million) Forecast, by Application 2020 & 2033
- Table 52: Nordics 6b Acid Volume (K) Forecast, by Application 2020 & 2033
- Table 53: Rest of Europe 6b Acid Revenue (million) Forecast, by Application 2020 & 2033
- Table 54: Rest of Europe 6b Acid Volume (K) Forecast, by Application 2020 & 2033
- Table 55: Global 6b Acid Revenue million Forecast, by Application 2020 & 2033
- Table 56: Global 6b Acid Volume K Forecast, by Application 2020 & 2033
- Table 57: Global 6b Acid Revenue million Forecast, by Type 2020 & 2033
- Table 58: Global 6b Acid Volume K Forecast, by Type 2020 & 2033
- Table 59: Global 6b Acid Revenue million Forecast, by Country 2020 & 2033
- Table 60: Global 6b Acid Volume K Forecast, by Country 2020 & 2033
- Table 61: Turkey 6b Acid Revenue (million) Forecast, by Application 2020 & 2033
- Table 62: Turkey 6b Acid Volume (K) Forecast, by Application 2020 & 2033
- Table 63: Israel 6b Acid Revenue (million) Forecast, by Application 2020 & 2033
- Table 64: Israel 6b Acid Volume (K) Forecast, by Application 2020 & 2033
- Table 65: GCC 6b Acid Revenue (million) Forecast, by Application 2020 & 2033
- Table 66: GCC 6b Acid Volume (K) Forecast, by Application 2020 & 2033
- Table 67: North Africa 6b Acid Revenue (million) Forecast, by Application 2020 & 2033
- Table 68: North Africa 6b Acid Volume (K) Forecast, by Application 2020 & 2033
- Table 69: South Africa 6b Acid Revenue (million) Forecast, by Application 2020 & 2033
- Table 70: South Africa 6b Acid Volume (K) Forecast, by Application 2020 & 2033
- Table 71: Rest of Middle East & Africa 6b Acid Revenue (million) Forecast, by Application 2020 & 2033
- Table 72: Rest of Middle East & Africa 6b Acid Volume (K) Forecast, by Application 2020 & 2033
- Table 73: Global 6b Acid Revenue million Forecast, by Application 2020 & 2033
- Table 74: Global 6b Acid Volume K Forecast, by Application 2020 & 2033
- Table 75: Global 6b Acid Revenue million Forecast, by Type 2020 & 2033
- Table 76: Global 6b Acid Volume K Forecast, by Type 2020 & 2033
- Table 77: Global 6b Acid Revenue million Forecast, by Country 2020 & 2033
- Table 78: Global 6b Acid Volume K Forecast, by Country 2020 & 2033
- Table 79: China 6b Acid Revenue (million) Forecast, by Application 2020 & 2033
- Table 80: China 6b Acid Volume (K) Forecast, by Application 2020 & 2033
- Table 81: India 6b Acid Revenue (million) Forecast, by Application 2020 & 2033
- Table 82: India 6b Acid Volume (K) Forecast, by Application 2020 & 2033
- Table 83: Japan 6b Acid Revenue (million) Forecast, by Application 2020 & 2033
- Table 84: Japan 6b Acid Volume (K) Forecast, by Application 2020 & 2033
- Table 85: South Korea 6b Acid Revenue (million) Forecast, by Application 2020 & 2033
- Table 86: South Korea 6b Acid Volume (K) Forecast, by Application 2020 & 2033
- Table 87: ASEAN 6b Acid Revenue (million) Forecast, by Application 2020 & 2033
- Table 88: ASEAN 6b Acid Volume (K) Forecast, by Application 2020 & 2033
- Table 89: Oceania 6b Acid Revenue (million) Forecast, by Application 2020 & 2033
- Table 90: Oceania 6b Acid Volume (K) Forecast, by Application 2020 & 2033
- Table 91: Rest of Asia Pacific 6b Acid Revenue (million) Forecast, by Application 2020 & 2033
- Table 92: Rest of Asia Pacific 6b Acid Volume (K) Forecast, by Application 2020 & 2033
Frequently Asked Questions
1. What is the projected Compound Annual Growth Rate (CAGR) of the 6b Acid?
The projected CAGR is approximately XXX%.
2. Which companies are prominent players in the 6b Acid?
Key companies in the market include ZhengDa NewMaterial, EMCO.
3. What are the main segments of the 6b Acid?
The market segments include Application, Type.
4. Can you provide details about the market size?
The market size is estimated to be USD XXX million as of 2022.
5. What are some drivers contributing to market growth?
N/A
6. What are the notable trends driving market growth?
N/A
7. Are there any restraints impacting market growth?
N/A
8. Can you provide examples of recent developments in the market?
N/A
9. What pricing options are available for accessing the report?
Pricing options include single-user, multi-user, and enterprise licenses priced at USD 3950.00, USD 5925.00, and USD 7900.00 respectively.
10. Is the market size provided in terms of value or volume?
The market size is provided in terms of value, measured in million and volume, measured in K.
11. Are there any specific market keywords associated with the report?
Yes, the market keyword associated with the report is "6b Acid," which aids in identifying and referencing the specific market segment covered.
12. How do I determine which pricing option suits my needs best?
The pricing options vary based on user requirements and access needs. Individual users may opt for single-user licenses, while businesses requiring broader access may choose multi-user or enterprise licenses for cost-effective access to the report.
13. Are there any additional resources or data provided in the 6b Acid report?
While the report offers comprehensive insights, it's advisable to review the specific contents or supplementary materials provided to ascertain if additional resources or data are available.
14. How can I stay updated on further developments or reports in the 6b Acid?
To stay informed about further developments, trends, and reports in the 6b Acid, consider subscribing to industry newsletters, following relevant companies and organizations, or regularly checking reputable industry news sources and publications.
Methodology
Step 1 - Identification of Relevant Samples Size from Population Database


Step 2 - Approaches for Defining Global Market Size (Value, Volume* & Price*)

Note*: In applicable scenarios
Step 3 - Data Sources
Primary Research
- Web Analytics
- Survey Reports
- Research Institute
- Latest Research Reports
- Opinion Leaders
Secondary Research
- Annual Reports
- White Paper
- Latest Press Release
- Industry Association
- Paid Database
- Investor Presentations

Step 4 - Data Triangulation
Involves using different sources of information in order to increase the validity of a study
These sources are likely to be stakeholders in a program - participants, other researchers, program staff, other community members, and so on.
Then we put all data in single framework & apply various statistical tools to find out the dynamic on the market.
During the analysis stage, feedback from the stakeholder groups would be compared to determine areas of agreement as well as areas of divergence

