
Key Insights
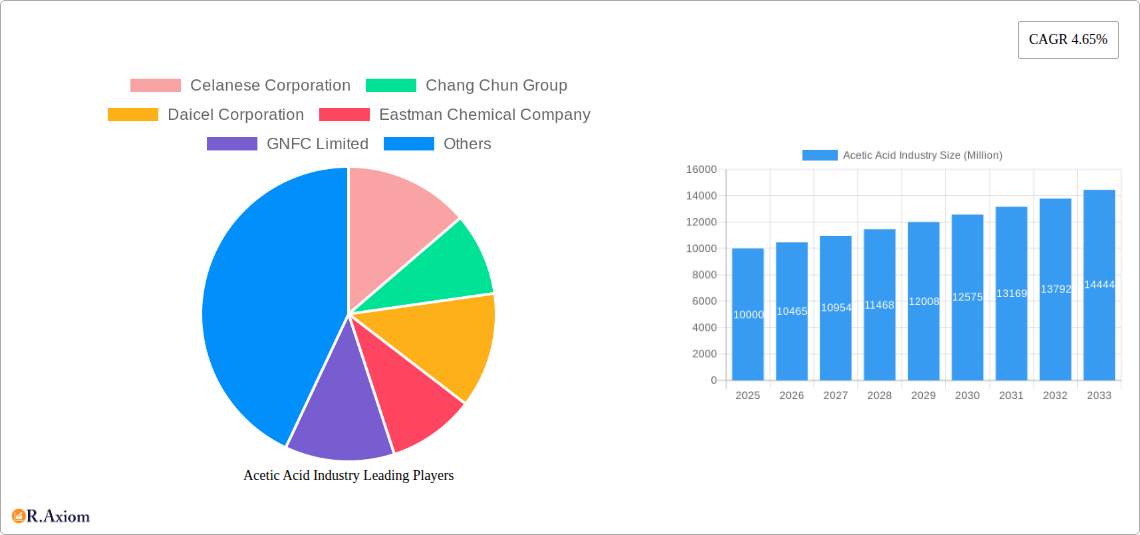
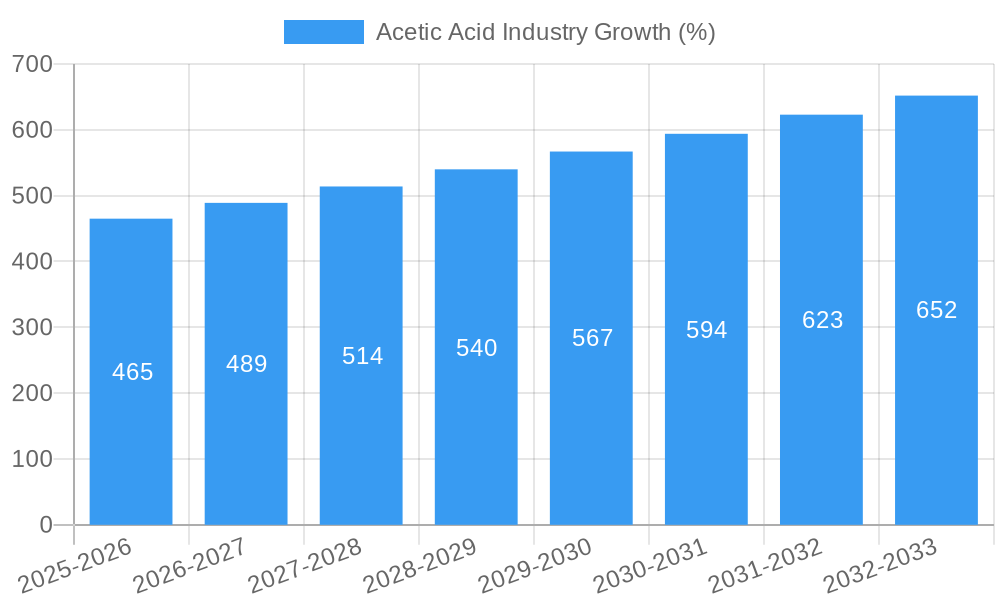
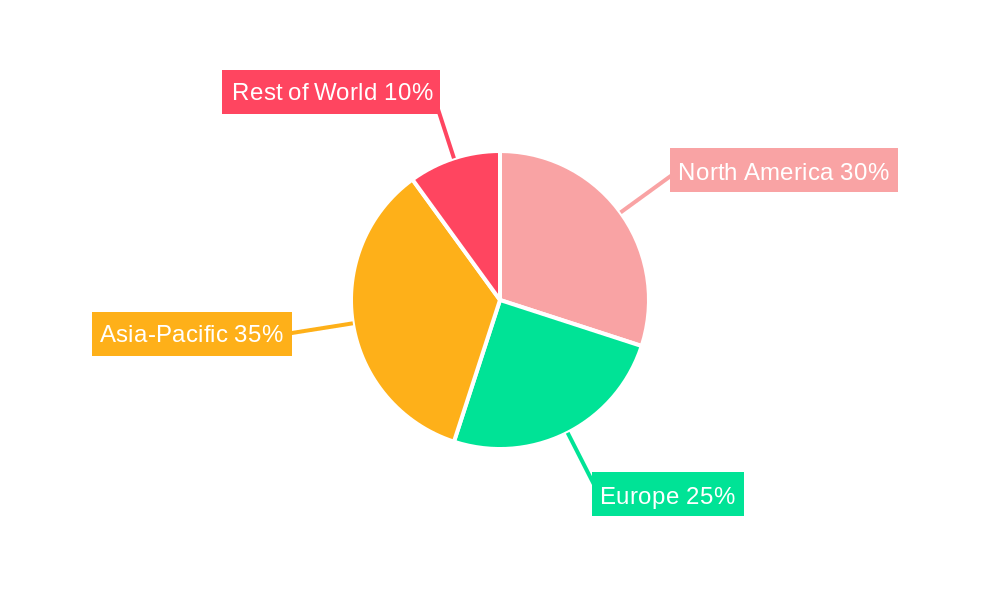
The global acetic acid market, valued at approximately $10 billion in 2025, is projected to experience steady growth, driven by robust demand from key applications like vinyl acetate monomer (VAM) production, acetic anhydride manufacturing, and the burgeoning use in the pharmaceutical and food industries. A compound annual growth rate (CAGR) of 4.65% from 2025 to 2033 suggests a market size exceeding $14 billion by 2033. This growth is fueled by increasing industrialization, particularly in developing economies, and the expanding use of acetic acid as a versatile chemical intermediate in various manufacturing processes. The market is segmented geographically, with North America and Asia-Pacific regions expected to dominate due to significant industrial activity and established manufacturing bases. Competitive dynamics within the industry are intense, with major players such as Celanese Corporation, Eastman Chemical Company, and others constantly striving for market share through capacity expansions, technological advancements, and strategic partnerships. While challenges exist, such as fluctuating raw material prices and environmental regulations, the fundamental demand for acetic acid across diverse sectors promises sustained growth over the forecast period. Technological advancements aimed at improving production efficiency and reducing environmental impact are further shaping the industry landscape, attracting significant investment and boosting production capacities.
The primary restraints on market growth are primarily linked to the volatility of crude oil prices, since acetic acid production is often linked to petrochemical feedstocks. Stringent environmental regulations related to emissions and waste disposal also impose limitations on the industry. However, continuous innovation and the adoption of sustainable production methods, such as bio-based acetic acid production, are gradually mitigating these concerns. The emergence of biodegradable plastics and the expanding use of acetic acid in the green chemistry domain present significant opportunities for market expansion. Further segmentation of the market based on application and end-use industry provides insights into specific growth drivers and potential bottlenecks. Detailed regional analysis offers a granular understanding of market dynamics, allowing stakeholders to effectively strategize and optimize their market positioning. Future growth hinges upon the ability of manufacturers to adopt sustainable practices, innovate in production methods, and cater to the specific needs of diverse market segments.
Acetic Acid Industry: A Comprehensive Market Report (2019-2033)
This detailed report provides a comprehensive analysis of the global acetic acid industry, covering market trends, competitive landscape, growth drivers, and future outlook from 2019 to 2033. The study period encompasses the historical period (2019-2024), the base year (2025), and the forecast period (2025-2033). This report is crucial for industry stakeholders, investors, and researchers seeking actionable insights into this dynamic market.
Acetic Acid Industry Market Concentration & Innovation
The global acetic acid market exhibits a moderately concentrated structure, with several major players holding significant market share. Celanese Corporation, Eastman Chemical Company, and Ineos are among the leading producers, collectively accounting for an estimated xx% of the global market in 2025. Market share dynamics are influenced by factors such as production capacity, technological advancements, and geographic reach.
Innovation in the acetic acid industry is driven by the need for sustainable and cost-effective production methods. This includes advancements in carbon capture and utilization technologies, as exemplified by Hebei Kingboard Energy Development Co., Ltd.'s recent USD 3.6 Billion investment in a carbon-neutral acetic acid facility. Regulatory frameworks, particularly those focusing on environmental sustainability, play a significant role in shaping innovation. The increasing demand for bio-based acetic acid presents a compelling opportunity for innovative players.
Product substitutes, such as other organic acids, pose a competitive challenge. However, acetic acid's versatile applications and established market position continue to bolster its demand. Mergers and acquisitions (M&A) activities have been relatively moderate in recent years, with deal values averaging xx Million USD annually during 2019-2024. Future M&A activity is anticipated to center around strategic expansions, technological acquisitions and geographical diversification.
Acetic Acid Industry Industry Trends & Insights
The global acetic acid market is projected to experience a Compound Annual Growth Rate (CAGR) of xx% during the forecast period (2025-2033). This growth is primarily fueled by the expanding demand from key end-use sectors, particularly the chemical industry and the food and beverage sector. Technological advancements in production processes, leading to higher efficiency and lower costs, are further contributing to market expansion. Market penetration in emerging economies is also a significant driver, as these regions witness rapid industrialization and increasing consumption of acetic acid-based products.
Consumer preferences are shifting towards sustainable and environmentally friendly products, prompting manufacturers to adopt greener production methods. This trend is driving the adoption of bio-based acetic acid and the development of carbon-neutral production processes. The competitive dynamics are characterized by intense price competition, with major players focusing on innovation, efficiency improvements, and cost optimization to maintain their market share.
Dominant Markets & Segments in Acetic Acid Industry
The Asia-Pacific region, particularly China, dominates the global acetic acid market, accounting for approximately xx% of the global consumption in 2025. This dominance is attributable to several key drivers:
- Rapid Industrialization: The region's robust industrial growth fuels demand across various sectors.
- Favorable Government Policies: Supportive economic policies and infrastructure development contribute significantly.
- Low Production Costs: The availability of raw materials and relatively lower labor costs enhance competitiveness.
The dominance of the Asia-Pacific region is expected to continue throughout the forecast period, although other regions, driven by expanding industrial activities and rising consumption, will demonstrate notable growth. Specific growth analysis within these regions highlights strong potential for market expansion outside of Asia, albeit at a slower pace.
Acetic Acid Industry Product Developments
Recent product developments in the acetic acid industry center on enhancing product purity, improving process efficiency, and developing sustainable production methods. The integration of carbon capture and utilization technologies is a key focus area. Innovations are geared towards enhancing the versatility of acetic acid in various applications, catering to the evolving needs of end-use sectors and prioritizing environmentally conscious production methods.
Report Scope & Segmentation Analysis
This report segments the acetic acid market by:
By Type: Glacial acetic acid, diluted acetic acid, others. Each segment exhibits unique growth projections and competitive dynamics reflecting varying end-use applications and manufacturing processes. Glacial acetic acid holds the largest share owing to its purity and wide range of uses.
By Application: Textiles, food and beverage, pharmaceuticals, adhesives, solvents, and others. Market size for each segment is influenced by end-use demands and economic trends within these sectors. The solvent application is growing rapidly, driven by various industrial processes.
By Region: North America, Europe, Asia-Pacific, South America, and the Middle East & Africa. Regional variations in production capacity, industrial activities, and regulatory frameworks create diverse growth landscapes within each area.
Key Drivers of Acetic Acid Industry Growth
Several factors are driving the growth of the acetic acid industry:
- Expanding Industrial Activities: Increasing industrialization globally fuels demand across diverse sectors.
- Technological Advancements: Innovations in production methods enhance efficiency and reduce costs.
- Government Support: Favorable economic policies and infrastructure investments support market expansion.
Challenges in the Acetic Acid Industry Sector
The acetic acid industry faces several challenges:
- Fluctuating Raw Material Prices: Volatility in the prices of raw materials, such as natural gas and ethanol, impacts production costs.
- Environmental Regulations: Stringent environmental regulations necessitate investment in cleaner production technologies.
- Intense Competition: The market's competitive landscape necessitates continuous innovation and cost optimization.
Emerging Opportunities in Acetic Acid Industry
Emerging opportunities include:
- Bio-based Acetic Acid: The growing demand for sustainable products drives the adoption of bio-based acetic acid.
- New Applications: Exploration of novel applications in emerging sectors, like bioplastics and biofuels, offers significant potential.
- Market Expansion in Developing Economies: Growing industrialization in emerging markets presents significant growth opportunities.
Leading Players in the Acetic Acid Industry Market
- Celanese Corporation (Celanese Corporation)
- Chang Chun Group
- Daicel Corporation (Daicel Corporation)
- Eastman Chemical Company (Eastman Chemical Company)
- GNFC Limited
- INEOS (INEOS)
- Jiangsu SOPO (Group) Co Ltd
- Kingboard Holdings Limited
- LyondellBasell Industries Holdings BV (LyondellBasell Industries Holdings BV)
- Mitsubishi Chemical Corporation (Mitsubishi Chemical Corporation)
- PetroChina Company Limited (PetroChina Company Limited)
- Sabic (Sabic)
- Shandong Hualu-Hengsheng Chemical Co Ltd
- Shanghai Huayi Holding Group Co Ltd
- Sipchem Company
- Svensk Etanolkemi AB (SEKAB)
- Tanfac Industries Ltd
- Yankuang Group
Key Developments in Acetic Acid Industry Industry
- June 2022: Hebei Kingboard Energy Development Co., Ltd. commenced construction of a 29,80 Million tons/year acetic acid facility, part of a larger USD 3.6 Billion carbon-neutral project.
- January 2023: Kingboard Holdings Limited's Hebei unit submitted an environmental impact report for an acetic acid expansion and transformation project.
Strategic Outlook for Acetic Acid Industry Market
The acetic acid market is poised for continued growth, driven by technological advancements, expanding industrial activities, and the increasing adoption of sustainable production methods. The focus on bio-based acetic acid and carbon-neutral production will shape future market dynamics, attracting new investments and technological innovations. Opportunities exist in emerging markets and the development of novel applications, contributing to a positive long-term outlook.
Acetic Acid Industry Segmentation
-
1. Derivative
- 1.1. Vinyl Acetate Monomer (VAM)
- 1.2. Purified Terephthalic Acid (PTA)
- 1.3. Ethyl Acetate
- 1.4. Acetic Anhydride
- 1.5. Other Derivatives
-
2. Application
- 2.1. Plastics and Polymers
- 2.2. Food and Beverage
- 2.3. Adhesives, Paints, and Coatings
- 2.4. Textile
- 2.5. Medical
- 2.6. Other Applications
Acetic Acid Industry Segmentation By Geography
-
1. Asia Pacific
- 1.1. China
- 1.2. India
- 1.3. Japan
- 1.4. South Korea
- 1.5. Rest of Asia Pacific
-
2. North America
- 2.1. United States
- 2.2. Canada
- 2.3. Mexico
-
3. Europe
- 3.1. Germany
- 3.2. United Kingdom
- 3.3. Italy
- 3.4. France
- 3.5. Rest of Europe
-
4. South America
- 4.1. Brazil
- 4.2. Argentina
- 4.3. Rest of South America
-
5. Middle East and Africa
- 5.1. Saudi Arabia
- 5.2. South Africa
- 5.3. Rest of Middle East and Africa
Acetic Acid Industry REPORT HIGHLIGHTS
| Aspects | Details |
|---|---|
| Study Period | 2019-2033 |
| Base Year | 2024 |
| Estimated Year | 2025 |
| Forecast Period | 2025-2033 |
| Historical Period | 2019-2024 |
| Growth Rate | CAGR of 4.65% from 2019-2033 |
| Segmentation |
|
Table of Contents
- 1. Introduction
- 1.1. Research Scope
- 1.2. Market Segmentation
- 1.3. Research Methodology
- 1.4. Definitions and Assumptions
- 2. Executive Summary
- 2.1. Introduction
- 3. Market Dynamics
- 3.1. Introduction
- 3.2. Market Drivers
- 3.2.1. Increasing Demand for Vinyl Acetate Monomer (VAM); Increasing Demand from the Textile and Packaging Industry; Increasing Use of Ester Solvents in the Paints and Coating Industry
- 3.3. Market Restrains
- 3.3.1. Increasing Demand for Vinyl Acetate Monomer (VAM); Increasing Demand from the Textile and Packaging Industry; Increasing Use of Ester Solvents in the Paints and Coating Industry
- 3.4. Market Trends
- 3.4.1 Increasing Applications in the Adhesives
- 3.4.2 Paints
- 3.4.3 and Coatings Industry
- 4. Market Factor Analysis
- 4.1. Porters Five Forces
- 4.2. Supply/Value Chain
- 4.3. PESTEL analysis
- 4.4. Market Entropy
- 4.5. Patent/Trademark Analysis
- 5. Global Acetic Acid Industry Analysis, Insights and Forecast, 2019-2031
- 5.1. Market Analysis, Insights and Forecast - by Derivative
- 5.1.1. Vinyl Acetate Monomer (VAM)
- 5.1.2. Purified Terephthalic Acid (PTA)
- 5.1.3. Ethyl Acetate
- 5.1.4. Acetic Anhydride
- 5.1.5. Other Derivatives
- 5.2. Market Analysis, Insights and Forecast - by Application
- 5.2.1. Plastics and Polymers
- 5.2.2. Food and Beverage
- 5.2.3. Adhesives, Paints, and Coatings
- 5.2.4. Textile
- 5.2.5. Medical
- 5.2.6. Other Applications
- 5.3. Market Analysis, Insights and Forecast - by Region
- 5.3.1. Asia Pacific
- 5.3.2. North America
- 5.3.3. Europe
- 5.3.4. South America
- 5.3.5. Middle East and Africa
- 5.1. Market Analysis, Insights and Forecast - by Derivative
- 6. Asia Pacific Acetic Acid Industry Analysis, Insights and Forecast, 2019-2031
- 6.1. Market Analysis, Insights and Forecast - by Derivative
- 6.1.1. Vinyl Acetate Monomer (VAM)
- 6.1.2. Purified Terephthalic Acid (PTA)
- 6.1.3. Ethyl Acetate
- 6.1.4. Acetic Anhydride
- 6.1.5. Other Derivatives
- 6.2. Market Analysis, Insights and Forecast - by Application
- 6.2.1. Plastics and Polymers
- 6.2.2. Food and Beverage
- 6.2.3. Adhesives, Paints, and Coatings
- 6.2.4. Textile
- 6.2.5. Medical
- 6.2.6. Other Applications
- 6.1. Market Analysis, Insights and Forecast - by Derivative
- 7. North America Acetic Acid Industry Analysis, Insights and Forecast, 2019-2031
- 7.1. Market Analysis, Insights and Forecast - by Derivative
- 7.1.1. Vinyl Acetate Monomer (VAM)
- 7.1.2. Purified Terephthalic Acid (PTA)
- 7.1.3. Ethyl Acetate
- 7.1.4. Acetic Anhydride
- 7.1.5. Other Derivatives
- 7.2. Market Analysis, Insights and Forecast - by Application
- 7.2.1. Plastics and Polymers
- 7.2.2. Food and Beverage
- 7.2.3. Adhesives, Paints, and Coatings
- 7.2.4. Textile
- 7.2.5. Medical
- 7.2.6. Other Applications
- 7.1. Market Analysis, Insights and Forecast - by Derivative
- 8. Europe Acetic Acid Industry Analysis, Insights and Forecast, 2019-2031
- 8.1. Market Analysis, Insights and Forecast - by Derivative
- 8.1.1. Vinyl Acetate Monomer (VAM)
- 8.1.2. Purified Terephthalic Acid (PTA)
- 8.1.3. Ethyl Acetate
- 8.1.4. Acetic Anhydride
- 8.1.5. Other Derivatives
- 8.2. Market Analysis, Insights and Forecast - by Application
- 8.2.1. Plastics and Polymers
- 8.2.2. Food and Beverage
- 8.2.3. Adhesives, Paints, and Coatings
- 8.2.4. Textile
- 8.2.5. Medical
- 8.2.6. Other Applications
- 8.1. Market Analysis, Insights and Forecast - by Derivative
- 9. South America Acetic Acid Industry Analysis, Insights and Forecast, 2019-2031
- 9.1. Market Analysis, Insights and Forecast - by Derivative
- 9.1.1. Vinyl Acetate Monomer (VAM)
- 9.1.2. Purified Terephthalic Acid (PTA)
- 9.1.3. Ethyl Acetate
- 9.1.4. Acetic Anhydride
- 9.1.5. Other Derivatives
- 9.2. Market Analysis, Insights and Forecast - by Application
- 9.2.1. Plastics and Polymers
- 9.2.2. Food and Beverage
- 9.2.3. Adhesives, Paints, and Coatings
- 9.2.4. Textile
- 9.2.5. Medical
- 9.2.6. Other Applications
- 9.1. Market Analysis, Insights and Forecast - by Derivative
- 10. Middle East and Africa Acetic Acid Industry Analysis, Insights and Forecast, 2019-2031
- 10.1. Market Analysis, Insights and Forecast - by Derivative
- 10.1.1. Vinyl Acetate Monomer (VAM)
- 10.1.2. Purified Terephthalic Acid (PTA)
- 10.1.3. Ethyl Acetate
- 10.1.4. Acetic Anhydride
- 10.1.5. Other Derivatives
- 10.2. Market Analysis, Insights and Forecast - by Application
- 10.2.1. Plastics and Polymers
- 10.2.2. Food and Beverage
- 10.2.3. Adhesives, Paints, and Coatings
- 10.2.4. Textile
- 10.2.5. Medical
- 10.2.6. Other Applications
- 10.1. Market Analysis, Insights and Forecast - by Derivative
- 11. Competitive Analysis
- 11.1. Global Market Share Analysis 2024
- 11.2. Company Profiles
- 11.2.1 Celanese Corporation
- 11.2.1.1. Overview
- 11.2.1.2. Products
- 11.2.1.3. SWOT Analysis
- 11.2.1.4. Recent Developments
- 11.2.1.5. Financials (Based on Availability)
- 11.2.2 Chang Chun Group
- 11.2.2.1. Overview
- 11.2.2.2. Products
- 11.2.2.3. SWOT Analysis
- 11.2.2.4. Recent Developments
- 11.2.2.5. Financials (Based on Availability)
- 11.2.3 Daicel Corporation
- 11.2.3.1. Overview
- 11.2.3.2. Products
- 11.2.3.3. SWOT Analysis
- 11.2.3.4. Recent Developments
- 11.2.3.5. Financials (Based on Availability)
- 11.2.4 Eastman Chemical Company
- 11.2.4.1. Overview
- 11.2.4.2. Products
- 11.2.4.3. SWOT Analysis
- 11.2.4.4. Recent Developments
- 11.2.4.5. Financials (Based on Availability)
- 11.2.5 GNFC Limited
- 11.2.5.1. Overview
- 11.2.5.2. Products
- 11.2.5.3. SWOT Analysis
- 11.2.5.4. Recent Developments
- 11.2.5.5. Financials (Based on Availability)
- 11.2.6 INEOS
- 11.2.6.1. Overview
- 11.2.6.2. Products
- 11.2.6.3. SWOT Analysis
- 11.2.6.4. Recent Developments
- 11.2.6.5. Financials (Based on Availability)
- 11.2.7 Jiangsu SOPO (Group) Co Ltd
- 11.2.7.1. Overview
- 11.2.7.2. Products
- 11.2.7.3. SWOT Analysis
- 11.2.7.4. Recent Developments
- 11.2.7.5. Financials (Based on Availability)
- 11.2.8 Kingboard Holdings Limited
- 11.2.8.1. Overview
- 11.2.8.2. Products
- 11.2.8.3. SWOT Analysis
- 11.2.8.4. Recent Developments
- 11.2.8.5. Financials (Based on Availability)
- 11.2.9 LyondellBasell Industries Holdings BV
- 11.2.9.1. Overview
- 11.2.9.2. Products
- 11.2.9.3. SWOT Analysis
- 11.2.9.4. Recent Developments
- 11.2.9.5. Financials (Based on Availability)
- 11.2.10 Mitsubishi Chemical Corporation
- 11.2.10.1. Overview
- 11.2.10.2. Products
- 11.2.10.3. SWOT Analysis
- 11.2.10.4. Recent Developments
- 11.2.10.5. Financials (Based on Availability)
- 11.2.11 PetroChina Company Limited
- 11.2.11.1. Overview
- 11.2.11.2. Products
- 11.2.11.3. SWOT Analysis
- 11.2.11.4. Recent Developments
- 11.2.11.5. Financials (Based on Availability)
- 11.2.12 Sabic
- 11.2.12.1. Overview
- 11.2.12.2. Products
- 11.2.12.3. SWOT Analysis
- 11.2.12.4. Recent Developments
- 11.2.12.5. Financials (Based on Availability)
- 11.2.13 Shandong Hualu-Hengsheng Chemical Co Ltd
- 11.2.13.1. Overview
- 11.2.13.2. Products
- 11.2.13.3. SWOT Analysis
- 11.2.13.4. Recent Developments
- 11.2.13.5. Financials (Based on Availability)
- 11.2.14 Shanghai Huayi Holding Group Co Ltd
- 11.2.14.1. Overview
- 11.2.14.2. Products
- 11.2.14.3. SWOT Analysis
- 11.2.14.4. Recent Developments
- 11.2.14.5. Financials (Based on Availability)
- 11.2.15 Sipchem Company
- 11.2.15.1. Overview
- 11.2.15.2. Products
- 11.2.15.3. SWOT Analysis
- 11.2.15.4. Recent Developments
- 11.2.15.5. Financials (Based on Availability)
- 11.2.16 Svensk Etanolkemi AB (SEKAB)
- 11.2.16.1. Overview
- 11.2.16.2. Products
- 11.2.16.3. SWOT Analysis
- 11.2.16.4. Recent Developments
- 11.2.16.5. Financials (Based on Availability)
- 11.2.17 Tanfac Industries Ltd
- 11.2.17.1. Overview
- 11.2.17.2. Products
- 11.2.17.3. SWOT Analysis
- 11.2.17.4. Recent Developments
- 11.2.17.5. Financials (Based on Availability)
- 11.2.18 Yankuang Group*List Not Exhaustive
- 11.2.18.1. Overview
- 11.2.18.2. Products
- 11.2.18.3. SWOT Analysis
- 11.2.18.4. Recent Developments
- 11.2.18.5. Financials (Based on Availability)
- 11.2.1 Celanese Corporation
List of Figures
- Figure 1: Global Acetic Acid Industry Revenue Breakdown (Million, %) by Region 2024 & 2032
- Figure 2: Asia Pacific Acetic Acid Industry Revenue (Million), by Derivative 2024 & 2032
- Figure 3: Asia Pacific Acetic Acid Industry Revenue Share (%), by Derivative 2024 & 2032
- Figure 4: Asia Pacific Acetic Acid Industry Revenue (Million), by Application 2024 & 2032
- Figure 5: Asia Pacific Acetic Acid Industry Revenue Share (%), by Application 2024 & 2032
- Figure 6: Asia Pacific Acetic Acid Industry Revenue (Million), by Country 2024 & 2032
- Figure 7: Asia Pacific Acetic Acid Industry Revenue Share (%), by Country 2024 & 2032
- Figure 8: North America Acetic Acid Industry Revenue (Million), by Derivative 2024 & 2032
- Figure 9: North America Acetic Acid Industry Revenue Share (%), by Derivative 2024 & 2032
- Figure 10: North America Acetic Acid Industry Revenue (Million), by Application 2024 & 2032
- Figure 11: North America Acetic Acid Industry Revenue Share (%), by Application 2024 & 2032
- Figure 12: North America Acetic Acid Industry Revenue (Million), by Country 2024 & 2032
- Figure 13: North America Acetic Acid Industry Revenue Share (%), by Country 2024 & 2032
- Figure 14: Europe Acetic Acid Industry Revenue (Million), by Derivative 2024 & 2032
- Figure 15: Europe Acetic Acid Industry Revenue Share (%), by Derivative 2024 & 2032
- Figure 16: Europe Acetic Acid Industry Revenue (Million), by Application 2024 & 2032
- Figure 17: Europe Acetic Acid Industry Revenue Share (%), by Application 2024 & 2032
- Figure 18: Europe Acetic Acid Industry Revenue (Million), by Country 2024 & 2032
- Figure 19: Europe Acetic Acid Industry Revenue Share (%), by Country 2024 & 2032
- Figure 20: South America Acetic Acid Industry Revenue (Million), by Derivative 2024 & 2032
- Figure 21: South America Acetic Acid Industry Revenue Share (%), by Derivative 2024 & 2032
- Figure 22: South America Acetic Acid Industry Revenue (Million), by Application 2024 & 2032
- Figure 23: South America Acetic Acid Industry Revenue Share (%), by Application 2024 & 2032
- Figure 24: South America Acetic Acid Industry Revenue (Million), by Country 2024 & 2032
- Figure 25: South America Acetic Acid Industry Revenue Share (%), by Country 2024 & 2032
- Figure 26: Middle East and Africa Acetic Acid Industry Revenue (Million), by Derivative 2024 & 2032
- Figure 27: Middle East and Africa Acetic Acid Industry Revenue Share (%), by Derivative 2024 & 2032
- Figure 28: Middle East and Africa Acetic Acid Industry Revenue (Million), by Application 2024 & 2032
- Figure 29: Middle East and Africa Acetic Acid Industry Revenue Share (%), by Application 2024 & 2032
- Figure 30: Middle East and Africa Acetic Acid Industry Revenue (Million), by Country 2024 & 2032
- Figure 31: Middle East and Africa Acetic Acid Industry Revenue Share (%), by Country 2024 & 2032
List of Tables
- Table 1: Global Acetic Acid Industry Revenue Million Forecast, by Region 2019 & 2032
- Table 2: Global Acetic Acid Industry Revenue Million Forecast, by Derivative 2019 & 2032
- Table 3: Global Acetic Acid Industry Revenue Million Forecast, by Application 2019 & 2032
- Table 4: Global Acetic Acid Industry Revenue Million Forecast, by Region 2019 & 2032
- Table 5: Global Acetic Acid Industry Revenue Million Forecast, by Derivative 2019 & 2032
- Table 6: Global Acetic Acid Industry Revenue Million Forecast, by Application 2019 & 2032
- Table 7: Global Acetic Acid Industry Revenue Million Forecast, by Country 2019 & 2032
- Table 8: China Acetic Acid Industry Revenue (Million) Forecast, by Application 2019 & 2032
- Table 9: India Acetic Acid Industry Revenue (Million) Forecast, by Application 2019 & 2032
- Table 10: Japan Acetic Acid Industry Revenue (Million) Forecast, by Application 2019 & 2032
- Table 11: South Korea Acetic Acid Industry Revenue (Million) Forecast, by Application 2019 & 2032
- Table 12: Rest of Asia Pacific Acetic Acid Industry Revenue (Million) Forecast, by Application 2019 & 2032
- Table 13: Global Acetic Acid Industry Revenue Million Forecast, by Derivative 2019 & 2032
- Table 14: Global Acetic Acid Industry Revenue Million Forecast, by Application 2019 & 2032
- Table 15: Global Acetic Acid Industry Revenue Million Forecast, by Country 2019 & 2032
- Table 16: United States Acetic Acid Industry Revenue (Million) Forecast, by Application 2019 & 2032
- Table 17: Canada Acetic Acid Industry Revenue (Million) Forecast, by Application 2019 & 2032
- Table 18: Mexico Acetic Acid Industry Revenue (Million) Forecast, by Application 2019 & 2032
- Table 19: Global Acetic Acid Industry Revenue Million Forecast, by Derivative 2019 & 2032
- Table 20: Global Acetic Acid Industry Revenue Million Forecast, by Application 2019 & 2032
- Table 21: Global Acetic Acid Industry Revenue Million Forecast, by Country 2019 & 2032
- Table 22: Germany Acetic Acid Industry Revenue (Million) Forecast, by Application 2019 & 2032
- Table 23: United Kingdom Acetic Acid Industry Revenue (Million) Forecast, by Application 2019 & 2032
- Table 24: Italy Acetic Acid Industry Revenue (Million) Forecast, by Application 2019 & 2032
- Table 25: France Acetic Acid Industry Revenue (Million) Forecast, by Application 2019 & 2032
- Table 26: Rest of Europe Acetic Acid Industry Revenue (Million) Forecast, by Application 2019 & 2032
- Table 27: Global Acetic Acid Industry Revenue Million Forecast, by Derivative 2019 & 2032
- Table 28: Global Acetic Acid Industry Revenue Million Forecast, by Application 2019 & 2032
- Table 29: Global Acetic Acid Industry Revenue Million Forecast, by Country 2019 & 2032
- Table 30: Brazil Acetic Acid Industry Revenue (Million) Forecast, by Application 2019 & 2032
- Table 31: Argentina Acetic Acid Industry Revenue (Million) Forecast, by Application 2019 & 2032
- Table 32: Rest of South America Acetic Acid Industry Revenue (Million) Forecast, by Application 2019 & 2032
- Table 33: Global Acetic Acid Industry Revenue Million Forecast, by Derivative 2019 & 2032
- Table 34: Global Acetic Acid Industry Revenue Million Forecast, by Application 2019 & 2032
- Table 35: Global Acetic Acid Industry Revenue Million Forecast, by Country 2019 & 2032
- Table 36: Saudi Arabia Acetic Acid Industry Revenue (Million) Forecast, by Application 2019 & 2032
- Table 37: South Africa Acetic Acid Industry Revenue (Million) Forecast, by Application 2019 & 2032
- Table 38: Rest of Middle East and Africa Acetic Acid Industry Revenue (Million) Forecast, by Application 2019 & 2032
Frequently Asked Questions
1. What is the projected Compound Annual Growth Rate (CAGR) of the Acetic Acid Industry?
The projected CAGR is approximately 4.65%.
2. Which companies are prominent players in the Acetic Acid Industry?
Key companies in the market include Celanese Corporation, Chang Chun Group, Daicel Corporation, Eastman Chemical Company, GNFC Limited, INEOS, Jiangsu SOPO (Group) Co Ltd, Kingboard Holdings Limited, LyondellBasell Industries Holdings BV, Mitsubishi Chemical Corporation, PetroChina Company Limited, Sabic, Shandong Hualu-Hengsheng Chemical Co Ltd, Shanghai Huayi Holding Group Co Ltd, Sipchem Company, Svensk Etanolkemi AB (SEKAB), Tanfac Industries Ltd, Yankuang Group*List Not Exhaustive.
3. What are the main segments of the Acetic Acid Industry?
The market segments include Derivative, Application.
4. Can you provide details about the market size?
The market size is estimated to be USD XX Million as of 2022.
5. What are some drivers contributing to market growth?
Increasing Demand for Vinyl Acetate Monomer (VAM); Increasing Demand from the Textile and Packaging Industry; Increasing Use of Ester Solvents in the Paints and Coating Industry.
6. What are the notable trends driving market growth?
Increasing Applications in the Adhesives. Paints. and Coatings Industry.
7. Are there any restraints impacting market growth?
Increasing Demand for Vinyl Acetate Monomer (VAM); Increasing Demand from the Textile and Packaging Industry; Increasing Use of Ester Solvents in the Paints and Coating Industry.
8. Can you provide examples of recent developments in the market?
January 2023: Kingboard Holdings Limited announced that the company's unit, Hebei Kingboard Energy Development Co., Ltd., plans to submit the "Environmental Impact Report of Hebei Kingboard Energy Development Co., Ltd. Acetic Acid Expansion and Transformation Project" for approval, and the entire content of the environmental impact study is accessible.
9. What pricing options are available for accessing the report?
Pricing options include single-user, multi-user, and enterprise licenses priced at USD 4750, USD 5250, and USD 8750 respectively.
10. Is the market size provided in terms of value or volume?
The market size is provided in terms of value, measured in Million.
11. Are there any specific market keywords associated with the report?
Yes, the market keyword associated with the report is "Acetic Acid Industry," which aids in identifying and referencing the specific market segment covered.
12. How do I determine which pricing option suits my needs best?
The pricing options vary based on user requirements and access needs. Individual users may opt for single-user licenses, while businesses requiring broader access may choose multi-user or enterprise licenses for cost-effective access to the report.
13. Are there any additional resources or data provided in the Acetic Acid Industry report?
While the report offers comprehensive insights, it's advisable to review the specific contents or supplementary materials provided to ascertain if additional resources or data are available.
14. How can I stay updated on further developments or reports in the Acetic Acid Industry?
To stay informed about further developments, trends, and reports in the Acetic Acid Industry, consider subscribing to industry newsletters, following relevant companies and organizations, or regularly checking reputable industry news sources and publications.
Methodology
Step 1 - Identification of Relevant Samples Size from Population Database


Step 2 - Approaches for Defining Global Market Size (Value, Volume* & Price*)

Note*: In applicable scenarios
Step 3 - Data Sources
Primary Research
- Web Analytics
- Survey Reports
- Research Institute
- Latest Research Reports
- Opinion Leaders
Secondary Research
- Annual Reports
- White Paper
- Latest Press Release
- Industry Association
- Paid Database
- Investor Presentations

Step 4 - Data Triangulation
Involves using different sources of information in order to increase the validity of a study
These sources are likely to be stakeholders in a program - participants, other researchers, program staff, other community members, and so on.
Then we put all data in single framework & apply various statistical tools to find out the dynamic on the market.
During the analysis stage, feedback from the stakeholder groups would be compared to determine areas of agreement as well as areas of divergence


