

Key Insights
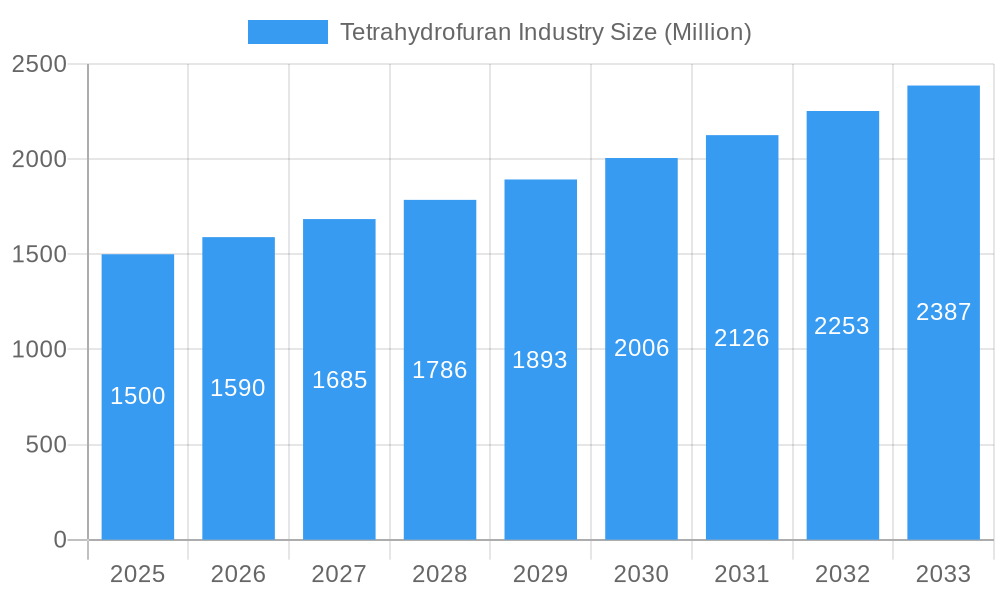
The Tetrahydrofuran (THF) market, valued at approximately $1 million in 2025, is projected to experience robust growth, exhibiting a compound annual growth rate (CAGR) of 4.07% from 2025 to 2033. This expansion is driven by escalating demand from key end-user industries including polymers, textiles, and pharmaceuticals, where THF is a critical solvent and intermediate. The increasing adoption of Polytetramethylene Ether Glycol (PTMEG), a primary THF application, particularly in polyurethanes for elastomers and fibers, further fuels market growth. Emerging trends like sustainable manufacturing and the emphasis on bio-based materials are influencing the market, encouraging eco-friendly production methods and product diversification. However, raw material price volatility and stringent environmental regulations present challenges. The Asia-Pacific region, led by China and India, is expected to dominate due to rapid industrialization and rising consumption in these high-growth economies. Intense competition among major players such as BASF SE, Mitsubishi Chemical Corporation, and Ashland, alongside regional participants, drives innovation and price competitiveness. Market segmentation by application (PTMEG, solvent, others) and end-user industry (polymers, textiles, pharmaceuticals, paints and coatings, others) offers a granular view of market dynamics. Continued growth in the polymer and pharmaceutical sectors will solidify THF’s position as a vital industrial chemical throughout the forecast period.
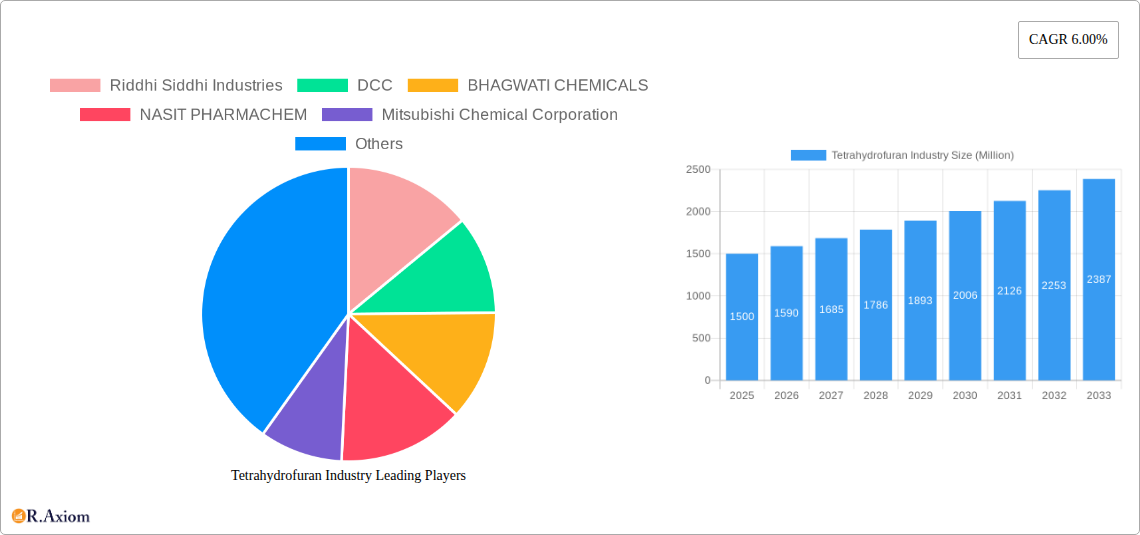
Tetrahydrofuran Industry Market Size (In Million)
Regional dominance is shifting, with the Asia-Pacific market leading due to its expanding industrial landscape and burgeoning demand. North America and Europe, while retaining significant market share, are anticipated to exhibit slower growth rates compared to Asia-Pacific. The competitive environment is dynamic, characterized by established multinational corporations and regional players. Strategic partnerships, technological advancements, and acquisitions are expected to shape the market. The forecast period will see an increased focus on sustainability, driving demand for environmentally friendly production processes and alternative raw materials, necessitating investments in R&D for innovative production technologies and efficient THF applications.
Tetrahydrofuran Industry Company Market Share
Tetrahydrofuran (THF) Industry Market Report: 2019-2033
This comprehensive report provides a detailed analysis of the global Tetrahydrofuran (THF) industry, offering invaluable insights for stakeholders across the value chain. Covering the period 2019-2033, with a focus on 2025, this report examines market dynamics, competitive landscapes, and future growth potential. The report leverages extensive primary and secondary research to deliver actionable intelligence, crucial for strategic decision-making in this dynamic sector.
Tetrahydrofuran Industry Market Concentration & Innovation
The Tetrahydrofuran (THF) market exhibits a moderately concentrated structure, with key players like Mitsubishi Chemical Corporation, BASF SE, and Ashland holding significant market share. The exact market share distribution is dynamic and fluctuates based on production capacity, pricing strategies, and regional demand, however, it is estimated that the top five players collectively account for approximately xx% of the global market in 2025. Innovation in the THF industry is driven by the increasing demand for high-purity THF and the development of new applications, particularly in the lithium-ion battery sector. Stringent environmental regulations are also fostering innovation in sustainable THF production methods.
- Market Share: The top 5 companies hold approximately xx% of the global market (2025).
- M&A Activity: The industry has witnessed several mergers and acquisitions (M&A) activities in recent years, with deal values ranging from xx Million to xx Million USD. These activities reflect the consolidation trend and the efforts to expand market presence.
- Regulatory Landscape: Regulations concerning chemical safety and environmental protection significantly influence the industry, shaping production processes and product quality standards.
- Product Substitutes: While limited, alternative solvents exist; however, THF's unique properties maintain its dominance in many applications.
- End-User Trends: The growing demand for lithium-ion batteries and specialized polymers continues to fuel growth in the THF market.
Tetrahydrofuran Industry Industry Trends & Insights
The global THF market is experiencing robust growth, projected to reach xx Million USD by 2033, exhibiting a Compound Annual Growth Rate (CAGR) of xx% during the forecast period (2025-2033). This expansion is fueled by several key factors, including increasing demand from various end-user industries, particularly the polymer, pharmaceutical, and paints & coatings sectors. Technological advancements in THF production, leading to higher purity and efficiency, contribute to this growth. Moreover, the rising adoption of lithium-ion batteries across diverse applications, including electric vehicles and consumer electronics, significantly boosts the demand for THF as a solvent in battery manufacturing. Competitive dynamics are characterized by intense rivalry among established players and the emergence of new entrants in certain regional markets. Market penetration strategies, particularly in developing economies, are crucial for growth.
Dominant Markets & Segments in Tetrahydrofuran Industry
The Asia-Pacific region currently dominates the global THF market, driven by robust industrial growth, expanding manufacturing sectors, and a burgeoning demand for consumer goods. China, in particular, represents a significant market due to its substantial polymer and textile industries.
Key Drivers for Asia-Pacific Dominance:
- Rapid industrialization and urbanization
- Expanding consumer base and rising disposable incomes
- Government support for manufacturing and chemical industries
- Development of extensive infrastructure for chemical production and distribution
Dominant Segments:
- End-User Industry: The Polymer segment holds the largest market share, fueled by the rising demand for various polymer types across numerous applications.
- Application: The Solvent application dominates the market, largely due to THF’s versatile solvency characteristics in numerous industrial processes.
Within these segments, countries like China, India, and South Korea exhibit robust growth, supported by their respective economic policies.
Tetrahydrofuran Industry Product Developments
Recent advancements focus on improving THF's purity, enhancing its performance in specific applications, and developing sustainable production methods. This includes the introduction of high-purity THF grades specifically designed for sensitive applications, like pharmaceuticals and electronic components. These developments are enhancing THF's competitive advantage in various markets, securing its position as a key chemical intermediate.
Report Scope & Segmentation Analysis
This report segments the THF market based on End-User Industry (Polymer, Textile, Pharmaceutical, Paints and Coatings, Other End-User Industries) and Application (Polytetramethylene Ether Glycol (PTMEG), Solvent, Other Applications). Each segment is analyzed in terms of market size, growth projections, and competitive dynamics. For instance, the Polymer segment is projected to experience significant growth due to the increasing demand for various polymer applications, while the Solvent segment's growth will be driven by increasing adoption in battery manufacturing. The report provides detailed insights into each segment's specific market drivers, challenges, and opportunities.
Key Drivers of Tetrahydrofuran Industry Growth
Several factors fuel the growth of the THF industry. These include the rising demand from diverse end-use sectors like polymers, pharmaceuticals, and lithium-ion batteries, coupled with continuous technological advancements enhancing THF production efficiency and purity. Furthermore, supportive government policies in key regions facilitate industry expansion and investment.
Challenges in the Tetrahydrofuran Industry Sector
Challenges include fluctuating raw material prices, stringent environmental regulations, and intense competition from existing and new market players. Supply chain disruptions and potential health and safety concerns also pose challenges to the industry's continued growth. The overall impact of these challenges on industry profits and production is estimated at xx Million USD annually in lost revenue.
Emerging Opportunities in Tetrahydrofuran Industry
Emerging opportunities lie in the expanding lithium-ion battery market and the growing demand for high-performance polymers. The development of sustainable THF production methods and the exploration of new applications across diverse industries also offer significant growth potential.
Leading Players in the Tetrahydrofuran Industry Market
- Riddhi Siddhi Industries
- DCC
- BHAGWATI CHEMICALS
- NASIT PHARMACHEM
- Mitsubishi Chemical Corporation
- Banner Chemicals Limited
- Shenyang East Chemical Science-Tech Co Ltd
- Ashland
- Hefei TNJ Chemical Industry Co Ltd
- BASF SE
- Sipchem Company
- REE ATHARVA LIFESCIENCE PVT LTD
- Henan GP Chemicals Co Ltd
Key Developments in Tetrahydrofuran Industry Industry
- October 2022: Wuhan University's development of a new ether-based electrolyte using THF and DIPE for Lithium-sulfur batteries significantly impacts the THF market by creating a new high-growth application, improving battery performance, and potentially driving higher demand for high-purity THF. This innovation is projected to increase the market demand for THF in the battery sector by xx Million USD by 2030.
Strategic Outlook for Tetrahydrofuran Industry Market
The THF market is poised for substantial growth, driven by the expanding demand from key sectors, ongoing technological advancements, and strategic investments from leading players. The industry's future success hinges on adapting to evolving regulations, navigating supply chain complexities, and capitalizing on emerging opportunities in high-growth markets. The strategic focus should be on innovation, sustainability, and securing a strong foothold in emerging economies.
Tetrahydrofuran Industry Segmentation
-
1. Application
- 1.1. Polytetramethylene Ether Glycol (PTMEG)
- 1.2. Solvent
- 1.3. Other Applications
-
2. End-User Industry
- 2.1. Polymer
- 2.2. Textile
- 2.3. Pharmaceutical
- 2.4. Paints and Coatings
- 2.5. Other End-User Industries
Tetrahydrofuran Industry Segmentation By Geography
-
1. Asia Pacific
- 1.1. China
- 1.2. India
- 1.3. Japan
- 1.4. South Korea
- 1.5. Southeast Asia
- 1.6. Australia
- 1.7. Rest of Asia Pacific
-
2. North America
- 2.1. United States
- 2.2. Canada
- 2.3. Mexico
-
3. Europe
- 3.1. Germany
- 3.2. United Kingdom
- 3.3. Italy
- 3.4. France
- 3.5. Rest of Europe
-
4. South America
- 4.1. Brazil
- 4.2. Argentina
- 4.3. Rest of South America
-
5. Middle East and Africa
- 5.1. Saudi Arabia
- 5.2. South Africa
- 5.3. Rest of Middle East and Africa
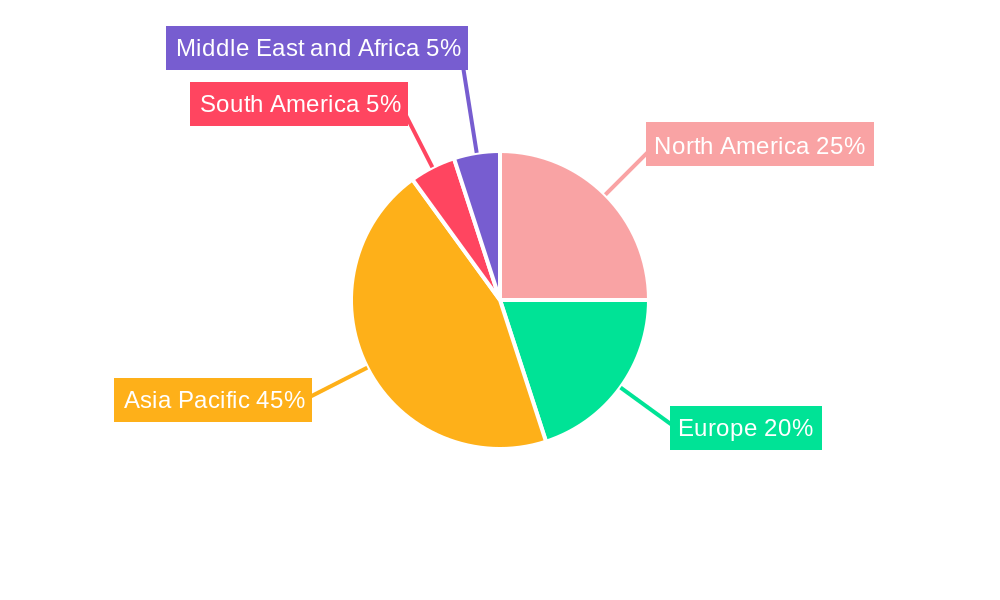
Tetrahydrofuran Industry Regional Market Share
Geographic Coverage of Tetrahydrofuran Industry
Tetrahydrofuran Industry REPORT HIGHLIGHTS
| Aspects | Details |
|---|---|
| Study Period | 2020-2034 |
| Base Year | 2025 |
| Estimated Year | 2026 |
| Forecast Period | 2026-2034 |
| Historical Period | 2020-2025 |
| Growth Rate | CAGR of 4.07% from 2020-2034 |
| Segmentation |
|
Table of Contents
- 1. Introduction
- 1.1. Research Scope
- 1.2. Market Segmentation
- 1.3. Research Objective
- 1.4. Definitions and Assumptions
- 2. Executive Summary
- 2.1. Market Snapshot
- 3. Market Dynamics
- 3.1. Market Drivers
- 3.2. Market Restrains
- 3.3. Market Trends
- 3.4. Market Opportunities
- 4. Market Factor Analysis
- 4.1. Porters Five Forces
- 4.1.1. Bargaining Power of Suppliers
- 4.1.2. Bargaining Power of Buyers
- 4.1.3. Threat of New Entrants
- 4.1.4. Threat of Substitutes
- 4.1.5. Competitive Rivalry
- 4.2. PESTEL analysis
- 4.3. BCG Analysis
- 4.3.1. Stars (High Growth, High Market Share)
- 4.3.2. Cash Cows (Low Growth, High Market Share)
- 4.3.3. Question Mark (High Growth, Low Market Share)
- 4.3.4. Dogs (Low Growth, Low Market Share)
- 4.4. Ansoff Matrix Analysis
- 4.5. Supply Chain Analysis
- 4.6. Regulatory Landscape
- 4.7. Current Market Potential and Opportunity Assessment (TAM–SAM–SOM Framework)
- 4.8. RAX Analyst Note
- 4.1. Porters Five Forces
- 5. Market Analysis, Insights and Forecast 2021-2033
- 5.1. Market Analysis, Insights and Forecast - by Application
- 5.1.1. Polytetramethylene Ether Glycol (PTMEG)
- 5.1.2. Solvent
- 5.1.3. Other Applications
- 5.2. Market Analysis, Insights and Forecast - by End-User Industry
- 5.2.1. Polymer
- 5.2.2. Textile
- 5.2.3. Pharmaceutical
- 5.2.4. Paints and Coatings
- 5.2.5. Other End-User Industries
- 5.3. Market Analysis, Insights and Forecast - by Region
- 5.3.1. Asia Pacific
- 5.3.2. North America
- 5.3.3. Europe
- 5.3.4. South America
- 5.3.5. Middle East and Africa
- 5.1. Market Analysis, Insights and Forecast - by Application
- 6. Global Tetrahydrofuran Industry Analysis, Insights and Forecast, 2021-2033
- 6.1. Market Analysis, Insights and Forecast - by Application
- 6.1.1. Polytetramethylene Ether Glycol (PTMEG)
- 6.1.2. Solvent
- 6.1.3. Other Applications
- 6.2. Market Analysis, Insights and Forecast - by End-User Industry
- 6.2.1. Polymer
- 6.2.2. Textile
- 6.2.3. Pharmaceutical
- 6.2.4. Paints and Coatings
- 6.2.5. Other End-User Industries
- 6.1. Market Analysis, Insights and Forecast - by Application
- 7. Asia Pacific Tetrahydrofuran Industry Analysis, Insights and Forecast, 2020-2032
- 7.1. Market Analysis, Insights and Forecast - by Application
- 7.1.1. Polytetramethylene Ether Glycol (PTMEG)
- 7.1.2. Solvent
- 7.1.3. Other Applications
- 7.2. Market Analysis, Insights and Forecast - by End-User Industry
- 7.2.1. Polymer
- 7.2.2. Textile
- 7.2.3. Pharmaceutical
- 7.2.4. Paints and Coatings
- 7.2.5. Other End-User Industries
- 7.1. Market Analysis, Insights and Forecast - by Application
- 8. North America Tetrahydrofuran Industry Analysis, Insights and Forecast, 2020-2032
- 8.1. Market Analysis, Insights and Forecast - by Application
- 8.1.1. Polytetramethylene Ether Glycol (PTMEG)
- 8.1.2. Solvent
- 8.1.3. Other Applications
- 8.2. Market Analysis, Insights and Forecast - by End-User Industry
- 8.2.1. Polymer
- 8.2.2. Textile
- 8.2.3. Pharmaceutical
- 8.2.4. Paints and Coatings
- 8.2.5. Other End-User Industries
- 8.1. Market Analysis, Insights and Forecast - by Application
- 9. Europe Tetrahydrofuran Industry Analysis, Insights and Forecast, 2020-2032
- 9.1. Market Analysis, Insights and Forecast - by Application
- 9.1.1. Polytetramethylene Ether Glycol (PTMEG)
- 9.1.2. Solvent
- 9.1.3. Other Applications
- 9.2. Market Analysis, Insights and Forecast - by End-User Industry
- 9.2.1. Polymer
- 9.2.2. Textile
- 9.2.3. Pharmaceutical
- 9.2.4. Paints and Coatings
- 9.2.5. Other End-User Industries
- 9.1. Market Analysis, Insights and Forecast - by Application
- 10. South America Tetrahydrofuran Industry Analysis, Insights and Forecast, 2020-2032
- 10.1. Market Analysis, Insights and Forecast - by Application
- 10.1.1. Polytetramethylene Ether Glycol (PTMEG)
- 10.1.2. Solvent
- 10.1.3. Other Applications
- 10.2. Market Analysis, Insights and Forecast - by End-User Industry
- 10.2.1. Polymer
- 10.2.2. Textile
- 10.2.3. Pharmaceutical
- 10.2.4. Paints and Coatings
- 10.2.5. Other End-User Industries
- 10.1. Market Analysis, Insights and Forecast - by Application
- 11. Middle East and Africa Tetrahydrofuran Industry Analysis, Insights and Forecast, 2020-2032
- 11.1. Market Analysis, Insights and Forecast - by Application
- 11.1.1. Polytetramethylene Ether Glycol (PTMEG)
- 11.1.2. Solvent
- 11.1.3. Other Applications
- 11.2. Market Analysis, Insights and Forecast - by End-User Industry
- 11.2.1. Polymer
- 11.2.2. Textile
- 11.2.3. Pharmaceutical
- 11.2.4. Paints and Coatings
- 11.2.5. Other End-User Industries
- 11.1. Market Analysis, Insights and Forecast - by Application
- 12. Competitive Analysis
- 12.1. Company Profiles
- 12.1.1 Riddhi Siddhi Industries
- 12.1.1.1. Company Overview
- 12.1.1.2. Products
- 12.1.1.3. Company Financials
- 12.1.1.4. SWOT Analysis
- 12.1.2 DCC
- 12.1.2.1. Company Overview
- 12.1.2.2. Products
- 12.1.2.3. Company Financials
- 12.1.2.4. SWOT Analysis
- 12.1.3 BHAGWATI CHEMICALS
- 12.1.3.1. Company Overview
- 12.1.3.2. Products
- 12.1.3.3. Company Financials
- 12.1.3.4. SWOT Analysis
- 12.1.4 NASIT PHARMACHEM
- 12.1.4.1. Company Overview
- 12.1.4.2. Products
- 12.1.4.3. Company Financials
- 12.1.4.4. SWOT Analysis
- 12.1.5 Mitsubishi Chemical Corporation
- 12.1.5.1. Company Overview
- 12.1.5.2. Products
- 12.1.5.3. Company Financials
- 12.1.5.4. SWOT Analysis
- 12.1.6 Banner Chemicals Limited
- 12.1.6.1. Company Overview
- 12.1.6.2. Products
- 12.1.6.3. Company Financials
- 12.1.6.4. SWOT Analysis
- 12.1.7 Shenyang East Chemical Science-Tech Co Ltd
- 12.1.7.1. Company Overview
- 12.1.7.2. Products
- 12.1.7.3. Company Financials
- 12.1.7.4. SWOT Analysis
- 12.1.8 Ashland
- 12.1.8.1. Company Overview
- 12.1.8.2. Products
- 12.1.8.3. Company Financials
- 12.1.8.4. SWOT Analysis
- 12.1.9 Hefei TNJ Chemical Industry Co Ltd
- 12.1.9.1. Company Overview
- 12.1.9.2. Products
- 12.1.9.3. Company Financials
- 12.1.9.4. SWOT Analysis
- 12.1.10 BASF SE
- 12.1.10.1. Company Overview
- 12.1.10.2. Products
- 12.1.10.3. Company Financials
- 12.1.10.4. SWOT Analysis
- 12.1.11 Sipchem Company
- 12.1.11.1. Company Overview
- 12.1.11.2. Products
- 12.1.11.3. Company Financials
- 12.1.11.4. SWOT Analysis
- 12.1.12 REE ATHARVA LIFESCIENCE PVT LTD
- 12.1.12.1. Company Overview
- 12.1.12.2. Products
- 12.1.12.3. Company Financials
- 12.1.12.4. SWOT Analysis
- 12.1.13 Henan GP Chemicals Co Ltd
- 12.1.13.1. Company Overview
- 12.1.13.2. Products
- 12.1.13.3. Company Financials
- 12.1.13.4. SWOT Analysis
- 12.1.1 Riddhi Siddhi Industries
- 12.2. Market Entropy
- 12.2.1 Company's Key Areas Served
- 12.2.2 Recent Developments
- 12.3. Company Market Share Analysis 2025
- 12.3.1 Top 5 Companies Market Share Analysis
- 12.3.2 Top 3 Companies Market Share Analysis
- 12.4. List of Potential Customers
- 13. Research Methodology
List of Figures
- Figure 1: Global Tetrahydrofuran Industry Revenue Breakdown (million, %) by Region 2025 & 2033
- Figure 2: Global Tetrahydrofuran Industry Volume Breakdown (K Tons, %) by Region 2025 & 2033
- Figure 3: Asia Pacific Tetrahydrofuran Industry Revenue (million), by Application 2025 & 2033
- Figure 4: Asia Pacific Tetrahydrofuran Industry Volume (K Tons), by Application 2025 & 2033
- Figure 5: Asia Pacific Tetrahydrofuran Industry Revenue Share (%), by Application 2025 & 2033
- Figure 6: Asia Pacific Tetrahydrofuran Industry Volume Share (%), by Application 2025 & 2033
- Figure 7: Asia Pacific Tetrahydrofuran Industry Revenue (million), by End-User Industry 2025 & 2033
- Figure 8: Asia Pacific Tetrahydrofuran Industry Volume (K Tons), by End-User Industry 2025 & 2033
- Figure 9: Asia Pacific Tetrahydrofuran Industry Revenue Share (%), by End-User Industry 2025 & 2033
- Figure 10: Asia Pacific Tetrahydrofuran Industry Volume Share (%), by End-User Industry 2025 & 2033
- Figure 11: Asia Pacific Tetrahydrofuran Industry Revenue (million), by Country 2025 & 2033
- Figure 12: Asia Pacific Tetrahydrofuran Industry Volume (K Tons), by Country 2025 & 2033
- Figure 13: Asia Pacific Tetrahydrofuran Industry Revenue Share (%), by Country 2025 & 2033
- Figure 14: Asia Pacific Tetrahydrofuran Industry Volume Share (%), by Country 2025 & 2033
- Figure 15: North America Tetrahydrofuran Industry Revenue (million), by Application 2025 & 2033
- Figure 16: North America Tetrahydrofuran Industry Volume (K Tons), by Application 2025 & 2033
- Figure 17: North America Tetrahydrofuran Industry Revenue Share (%), by Application 2025 & 2033
- Figure 18: North America Tetrahydrofuran Industry Volume Share (%), by Application 2025 & 2033
- Figure 19: North America Tetrahydrofuran Industry Revenue (million), by End-User Industry 2025 & 2033
- Figure 20: North America Tetrahydrofuran Industry Volume (K Tons), by End-User Industry 2025 & 2033
- Figure 21: North America Tetrahydrofuran Industry Revenue Share (%), by End-User Industry 2025 & 2033
- Figure 22: North America Tetrahydrofuran Industry Volume Share (%), by End-User Industry 2025 & 2033
- Figure 23: North America Tetrahydrofuran Industry Revenue (million), by Country 2025 & 2033
- Figure 24: North America Tetrahydrofuran Industry Volume (K Tons), by Country 2025 & 2033
- Figure 25: North America Tetrahydrofuran Industry Revenue Share (%), by Country 2025 & 2033
- Figure 26: North America Tetrahydrofuran Industry Volume Share (%), by Country 2025 & 2033
- Figure 27: Europe Tetrahydrofuran Industry Revenue (million), by Application 2025 & 2033
- Figure 28: Europe Tetrahydrofuran Industry Volume (K Tons), by Application 2025 & 2033
- Figure 29: Europe Tetrahydrofuran Industry Revenue Share (%), by Application 2025 & 2033
- Figure 30: Europe Tetrahydrofuran Industry Volume Share (%), by Application 2025 & 2033
- Figure 31: Europe Tetrahydrofuran Industry Revenue (million), by End-User Industry 2025 & 2033
- Figure 32: Europe Tetrahydrofuran Industry Volume (K Tons), by End-User Industry 2025 & 2033
- Figure 33: Europe Tetrahydrofuran Industry Revenue Share (%), by End-User Industry 2025 & 2033
- Figure 34: Europe Tetrahydrofuran Industry Volume Share (%), by End-User Industry 2025 & 2033
- Figure 35: Europe Tetrahydrofuran Industry Revenue (million), by Country 2025 & 2033
- Figure 36: Europe Tetrahydrofuran Industry Volume (K Tons), by Country 2025 & 2033
- Figure 37: Europe Tetrahydrofuran Industry Revenue Share (%), by Country 2025 & 2033
- Figure 38: Europe Tetrahydrofuran Industry Volume Share (%), by Country 2025 & 2033
- Figure 39: South America Tetrahydrofuran Industry Revenue (million), by Application 2025 & 2033
- Figure 40: South America Tetrahydrofuran Industry Volume (K Tons), by Application 2025 & 2033
- Figure 41: South America Tetrahydrofuran Industry Revenue Share (%), by Application 2025 & 2033
- Figure 42: South America Tetrahydrofuran Industry Volume Share (%), by Application 2025 & 2033
- Figure 43: South America Tetrahydrofuran Industry Revenue (million), by End-User Industry 2025 & 2033
- Figure 44: South America Tetrahydrofuran Industry Volume (K Tons), by End-User Industry 2025 & 2033
- Figure 45: South America Tetrahydrofuran Industry Revenue Share (%), by End-User Industry 2025 & 2033
- Figure 46: South America Tetrahydrofuran Industry Volume Share (%), by End-User Industry 2025 & 2033
- Figure 47: South America Tetrahydrofuran Industry Revenue (million), by Country 2025 & 2033
- Figure 48: South America Tetrahydrofuran Industry Volume (K Tons), by Country 2025 & 2033
- Figure 49: South America Tetrahydrofuran Industry Revenue Share (%), by Country 2025 & 2033
- Figure 50: South America Tetrahydrofuran Industry Volume Share (%), by Country 2025 & 2033
- Figure 51: Middle East and Africa Tetrahydrofuran Industry Revenue (million), by Application 2025 & 2033
- Figure 52: Middle East and Africa Tetrahydrofuran Industry Volume (K Tons), by Application 2025 & 2033
- Figure 53: Middle East and Africa Tetrahydrofuran Industry Revenue Share (%), by Application 2025 & 2033
- Figure 54: Middle East and Africa Tetrahydrofuran Industry Volume Share (%), by Application 2025 & 2033
- Figure 55: Middle East and Africa Tetrahydrofuran Industry Revenue (million), by End-User Industry 2025 & 2033
- Figure 56: Middle East and Africa Tetrahydrofuran Industry Volume (K Tons), by End-User Industry 2025 & 2033
- Figure 57: Middle East and Africa Tetrahydrofuran Industry Revenue Share (%), by End-User Industry 2025 & 2033
- Figure 58: Middle East and Africa Tetrahydrofuran Industry Volume Share (%), by End-User Industry 2025 & 2033
- Figure 59: Middle East and Africa Tetrahydrofuran Industry Revenue (million), by Country 2025 & 2033
- Figure 60: Middle East and Africa Tetrahydrofuran Industry Volume (K Tons), by Country 2025 & 2033
- Figure 61: Middle East and Africa Tetrahydrofuran Industry Revenue Share (%), by Country 2025 & 2033
- Figure 62: Middle East and Africa Tetrahydrofuran Industry Volume Share (%), by Country 2025 & 2033
List of Tables
- Table 1: Global Tetrahydrofuran Industry Revenue million Forecast, by Application 2020 & 2033
- Table 2: Global Tetrahydrofuran Industry Volume K Tons Forecast, by Application 2020 & 2033
- Table 3: Global Tetrahydrofuran Industry Revenue million Forecast, by End-User Industry 2020 & 2033
- Table 4: Global Tetrahydrofuran Industry Volume K Tons Forecast, by End-User Industry 2020 & 2033
- Table 5: Global Tetrahydrofuran Industry Revenue million Forecast, by Region 2020 & 2033
- Table 6: Global Tetrahydrofuran Industry Volume K Tons Forecast, by Region 2020 & 2033
- Table 7: Global Tetrahydrofuran Industry Revenue million Forecast, by Application 2020 & 2033
- Table 8: Global Tetrahydrofuran Industry Volume K Tons Forecast, by Application 2020 & 2033
- Table 9: Global Tetrahydrofuran Industry Revenue million Forecast, by End-User Industry 2020 & 2033
- Table 10: Global Tetrahydrofuran Industry Volume K Tons Forecast, by End-User Industry 2020 & 2033
- Table 11: Global Tetrahydrofuran Industry Revenue million Forecast, by Country 2020 & 2033
- Table 12: Global Tetrahydrofuran Industry Volume K Tons Forecast, by Country 2020 & 2033
- Table 13: China Tetrahydrofuran Industry Revenue (million) Forecast, by Application 2020 & 2033
- Table 14: China Tetrahydrofuran Industry Volume (K Tons) Forecast, by Application 2020 & 2033
- Table 15: India Tetrahydrofuran Industry Revenue (million) Forecast, by Application 2020 & 2033
- Table 16: India Tetrahydrofuran Industry Volume (K Tons) Forecast, by Application 2020 & 2033
- Table 17: Japan Tetrahydrofuran Industry Revenue (million) Forecast, by Application 2020 & 2033
- Table 18: Japan Tetrahydrofuran Industry Volume (K Tons) Forecast, by Application 2020 & 2033
- Table 19: South Korea Tetrahydrofuran Industry Revenue (million) Forecast, by Application 2020 & 2033
- Table 20: South Korea Tetrahydrofuran Industry Volume (K Tons) Forecast, by Application 2020 & 2033
- Table 21: Southeast Asia Tetrahydrofuran Industry Revenue (million) Forecast, by Application 2020 & 2033
- Table 22: Southeast Asia Tetrahydrofuran Industry Volume (K Tons) Forecast, by Application 2020 & 2033
- Table 23: Australia Tetrahydrofuran Industry Revenue (million) Forecast, by Application 2020 & 2033
- Table 24: Australia Tetrahydrofuran Industry Volume (K Tons) Forecast, by Application 2020 & 2033
- Table 25: Rest of Asia Pacific Tetrahydrofuran Industry Revenue (million) Forecast, by Application 2020 & 2033
- Table 26: Rest of Asia Pacific Tetrahydrofuran Industry Volume (K Tons) Forecast, by Application 2020 & 2033
- Table 27: Global Tetrahydrofuran Industry Revenue million Forecast, by Application 2020 & 2033
- Table 28: Global Tetrahydrofuran Industry Volume K Tons Forecast, by Application 2020 & 2033
- Table 29: Global Tetrahydrofuran Industry Revenue million Forecast, by End-User Industry 2020 & 2033
- Table 30: Global Tetrahydrofuran Industry Volume K Tons Forecast, by End-User Industry 2020 & 2033
- Table 31: Global Tetrahydrofuran Industry Revenue million Forecast, by Country 2020 & 2033
- Table 32: Global Tetrahydrofuran Industry Volume K Tons Forecast, by Country 2020 & 2033
- Table 33: United States Tetrahydrofuran Industry Revenue (million) Forecast, by Application 2020 & 2033
- Table 34: United States Tetrahydrofuran Industry Volume (K Tons) Forecast, by Application 2020 & 2033
- Table 35: Canada Tetrahydrofuran Industry Revenue (million) Forecast, by Application 2020 & 2033
- Table 36: Canada Tetrahydrofuran Industry Volume (K Tons) Forecast, by Application 2020 & 2033
- Table 37: Mexico Tetrahydrofuran Industry Revenue (million) Forecast, by Application 2020 & 2033
- Table 38: Mexico Tetrahydrofuran Industry Volume (K Tons) Forecast, by Application 2020 & 2033
- Table 39: Global Tetrahydrofuran Industry Revenue million Forecast, by Application 2020 & 2033
- Table 40: Global Tetrahydrofuran Industry Volume K Tons Forecast, by Application 2020 & 2033
- Table 41: Global Tetrahydrofuran Industry Revenue million Forecast, by End-User Industry 2020 & 2033
- Table 42: Global Tetrahydrofuran Industry Volume K Tons Forecast, by End-User Industry 2020 & 2033
- Table 43: Global Tetrahydrofuran Industry Revenue million Forecast, by Country 2020 & 2033
- Table 44: Global Tetrahydrofuran Industry Volume K Tons Forecast, by Country 2020 & 2033
- Table 45: Germany Tetrahydrofuran Industry Revenue (million) Forecast, by Application 2020 & 2033
- Table 46: Germany Tetrahydrofuran Industry Volume (K Tons) Forecast, by Application 2020 & 2033
- Table 47: United Kingdom Tetrahydrofuran Industry Revenue (million) Forecast, by Application 2020 & 2033
- Table 48: United Kingdom Tetrahydrofuran Industry Volume (K Tons) Forecast, by Application 2020 & 2033
- Table 49: Italy Tetrahydrofuran Industry Revenue (million) Forecast, by Application 2020 & 2033
- Table 50: Italy Tetrahydrofuran Industry Volume (K Tons) Forecast, by Application 2020 & 2033
- Table 51: France Tetrahydrofuran Industry Revenue (million) Forecast, by Application 2020 & 2033
- Table 52: France Tetrahydrofuran Industry Volume (K Tons) Forecast, by Application 2020 & 2033
- Table 53: Rest of Europe Tetrahydrofuran Industry Revenue (million) Forecast, by Application 2020 & 2033
- Table 54: Rest of Europe Tetrahydrofuran Industry Volume (K Tons) Forecast, by Application 2020 & 2033
- Table 55: Global Tetrahydrofuran Industry Revenue million Forecast, by Application 2020 & 2033
- Table 56: Global Tetrahydrofuran Industry Volume K Tons Forecast, by Application 2020 & 2033
- Table 57: Global Tetrahydrofuran Industry Revenue million Forecast, by End-User Industry 2020 & 2033
- Table 58: Global Tetrahydrofuran Industry Volume K Tons Forecast, by End-User Industry 2020 & 2033
- Table 59: Global Tetrahydrofuran Industry Revenue million Forecast, by Country 2020 & 2033
- Table 60: Global Tetrahydrofuran Industry Volume K Tons Forecast, by Country 2020 & 2033
- Table 61: Brazil Tetrahydrofuran Industry Revenue (million) Forecast, by Application 2020 & 2033
- Table 62: Brazil Tetrahydrofuran Industry Volume (K Tons) Forecast, by Application 2020 & 2033
- Table 63: Argentina Tetrahydrofuran Industry Revenue (million) Forecast, by Application 2020 & 2033
- Table 64: Argentina Tetrahydrofuran Industry Volume (K Tons) Forecast, by Application 2020 & 2033
- Table 65: Rest of South America Tetrahydrofuran Industry Revenue (million) Forecast, by Application 2020 & 2033
- Table 66: Rest of South America Tetrahydrofuran Industry Volume (K Tons) Forecast, by Application 2020 & 2033
- Table 67: Global Tetrahydrofuran Industry Revenue million Forecast, by Application 2020 & 2033
- Table 68: Global Tetrahydrofuran Industry Volume K Tons Forecast, by Application 2020 & 2033
- Table 69: Global Tetrahydrofuran Industry Revenue million Forecast, by End-User Industry 2020 & 2033
- Table 70: Global Tetrahydrofuran Industry Volume K Tons Forecast, by End-User Industry 2020 & 2033
- Table 71: Global Tetrahydrofuran Industry Revenue million Forecast, by Country 2020 & 2033
- Table 72: Global Tetrahydrofuran Industry Volume K Tons Forecast, by Country 2020 & 2033
- Table 73: Saudi Arabia Tetrahydrofuran Industry Revenue (million) Forecast, by Application 2020 & 2033
- Table 74: Saudi Arabia Tetrahydrofuran Industry Volume (K Tons) Forecast, by Application 2020 & 2033
- Table 75: South Africa Tetrahydrofuran Industry Revenue (million) Forecast, by Application 2020 & 2033
- Table 76: South Africa Tetrahydrofuran Industry Volume (K Tons) Forecast, by Application 2020 & 2033
- Table 77: Rest of Middle East and Africa Tetrahydrofuran Industry Revenue (million) Forecast, by Application 2020 & 2033
- Table 78: Rest of Middle East and Africa Tetrahydrofuran Industry Volume (K Tons) Forecast, by Application 2020 & 2033
Frequently Asked Questions
1. What is the projected Compound Annual Growth Rate (CAGR) of the Tetrahydrofuran Industry?
The projected CAGR is approximately 4.07%.
2. Which companies are prominent players in the Tetrahydrofuran Industry?
Key companies in the market include Riddhi Siddhi Industries, DCC, BHAGWATI CHEMICALS, NASIT PHARMACHEM, Mitsubishi Chemical Corporation, Banner Chemicals Limited, Shenyang East Chemical Science-Tech Co Ltd, Ashland, Hefei TNJ Chemical Industry Co Ltd, BASF SE, Sipchem Company, REE ATHARVA LIFESCIENCE PVT LTD, Henan GP Chemicals Co Ltd.
3. What are the main segments of the Tetrahydrofuran Industry?
The market segments include Application, End-User Industry.
4. Can you provide details about the market size?
The market size is estimated to be USD 1 million as of 2022.
5. What are some drivers contributing to market growth?
Growing Demand for Spandex from the Textile Industry; Increasing Demand for PVC Manufacturing.
6. What are the notable trends driving market growth?
Increasing Demand from the Paints and Coatings Industry.
7. Are there any restraints impacting market growth?
Availability of Close Substitutes; Hazardous Nature (Highly Flammable and Health Hazard) of THF.
8. Can you provide examples of recent developments in the market?
October 2022: Wuhan University developed a new ether-based electrolyte with the help of tetrahydrofuran (THF) and di-isopropyl ether (DIPE) Lithium-sulfur batteries (LSBs). The new electrolyte effectively inhibits the dissolution of lithium polysulfides and the self-discharge effect. LiFSI can be used as the co-salt in the electrolyte to improve the ionic conductivity and inhibit the side reaction on the Li metal anode.
9. What pricing options are available for accessing the report?
Pricing options include single-user, multi-user, and enterprise licenses priced at USD 4750, USD 5250, and USD 8750 respectively.
10. Is the market size provided in terms of value or volume?
The market size is provided in terms of value, measured in million and volume, measured in K Tons.
11. Are there any specific market keywords associated with the report?
Yes, the market keyword associated with the report is "Tetrahydrofuran Industry," which aids in identifying and referencing the specific market segment covered.
12. How do I determine which pricing option suits my needs best?
The pricing options vary based on user requirements and access needs. Individual users may opt for single-user licenses, while businesses requiring broader access may choose multi-user or enterprise licenses for cost-effective access to the report.
13. Are there any additional resources or data provided in the Tetrahydrofuran Industry report?
While the report offers comprehensive insights, it's advisable to review the specific contents or supplementary materials provided to ascertain if additional resources or data are available.
14. How can I stay updated on further developments or reports in the Tetrahydrofuran Industry?
To stay informed about further developments, trends, and reports in the Tetrahydrofuran Industry, consider subscribing to industry newsletters, following relevant companies and organizations, or regularly checking reputable industry news sources and publications.
Methodology
Step 1 - Identification of Relevant Samples Size from Population Database


Step 2 - Approaches for Defining Global Market Size (Value, Volume* & Price*)

Note*: In applicable scenarios
Step 3 - Data Sources
Primary Research
- Web Analytics
- Survey Reports
- Research Institute
- Latest Research Reports
- Opinion Leaders
Secondary Research
- Annual Reports
- White Paper
- Latest Press Release
- Industry Association
- Paid Database
- Investor Presentations

Step 4 - Data Triangulation
Involves using different sources of information in order to increase the validity of a study
These sources are likely to be stakeholders in a program - participants, other researchers, program staff, other community members, and so on.
Then we put all data in single framework & apply various statistical tools to find out the dynamic on the market.
During the analysis stage, feedback from the stakeholder groups would be compared to determine areas of agreement as well as areas of divergence