

Key Insights
The acid polishing additive market is poised for significant expansion, propelled by escalating demand across key sectors such as semiconductor manufacturing and metal finishing. This growth is primarily driven by the imperative for superior surface quality and enhanced polishing process efficiency. Innovations in additive formulations, yielding improved polishing performance and reduced environmental footprints, are further accelerating market momentum. Based on current industry trajectories and the competitive landscape featuring major enterprises, the market size for 2025 is estimated at $10.7 billion, with a projected Compound Annual Growth Rate (CAGR) of 11.21%. While precise data for the base year is under review, current indicators suggest a substantial market foundation. Anticipated growth will contend with challenges such as volatile raw material costs and stringent environmental regulations affecting additive composition. The market is segmented by additive type (organic, inorganic), application (metal polishing, semiconductor wafer polishing), and geography. Leading market participants are actively pursuing R&D and strategic alliances to bolster their market standing and offer customized solutions.
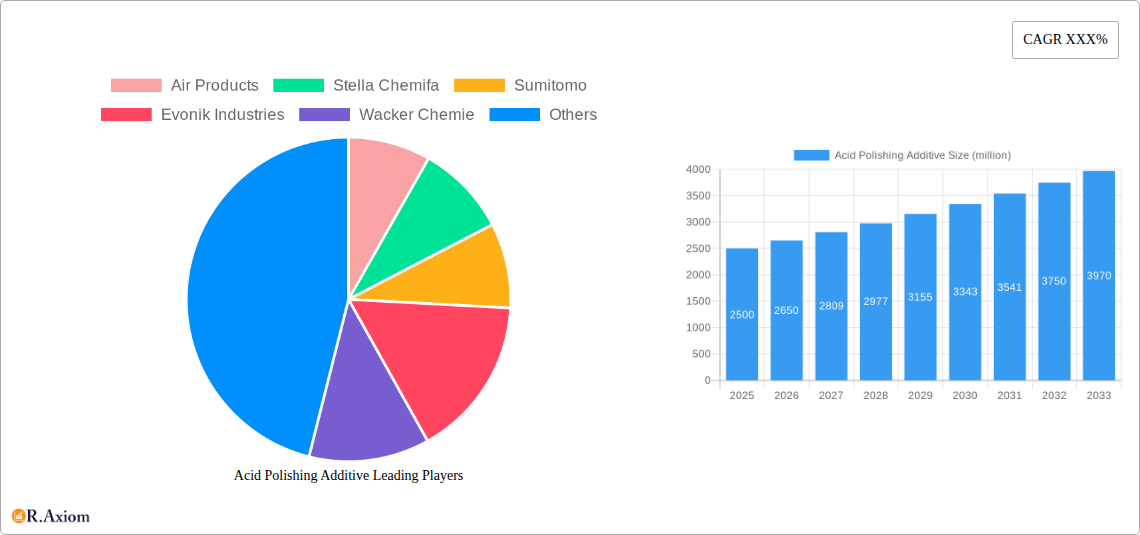
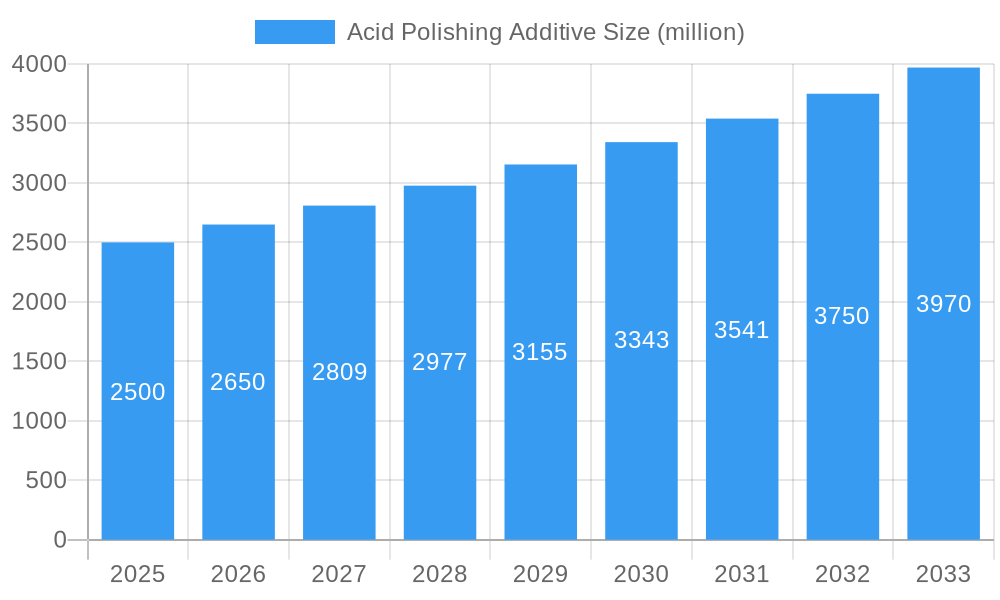
Acid Polishing Additive Market Size (In Billion)
The competitive arena is populated by established global corporations and dynamic regional contenders. The presence of industry leaders like Air Products, Sumitomo, and Evonik Industries underscores advanced technological capabilities and robust distribution channels. Concurrently, the emergence of Chinese manufacturers, including Topone Technology and Shichuang Energy, highlights a growing segment of agile suppliers addressing localized market needs. Future market development will be shaped by advancements in sustainable additives, increased automation in polishing operations, and the integration of new applications in advanced materials. Comprehensive market analysis should further scrutinize regional market shares and the influence of evolving industrial standards on product demand to provide a definitive outlook on long-term growth prospects.
Acid Polishing Additive Company Market Share
Acid Polishing Additive Market Report: A Comprehensive Analysis (2019-2033)
This comprehensive report provides an in-depth analysis of the global Acid Polishing Additive market, offering invaluable insights for industry stakeholders, investors, and strategic decision-makers. The study covers the period from 2019 to 2033, with a base year of 2025 and a forecast period spanning 2025-2033. The report utilizes a robust methodology, incorporating both historical data (2019-2024) and future projections, to deliver a nuanced understanding of market dynamics. The market size is predicted to reach xx million by 2033.
Acid Polishing Additive Market Concentration & Innovation
The global acid polishing additive market exhibits a moderately concentrated landscape, with key players like Air Products, Stella Chemifa, Sumitomo, Evonik Industries, Wacker Chemie, and Mitsubishi Chemical holding significant market share. The combined market share of the top five players is estimated at xx%, with Air Products leading the pack at an estimated xx% in 2025. Innovation is a key driver, fueled by the demand for enhanced polishing performance, environmentally friendly formulations, and cost-effective solutions. Regulatory frameworks, particularly concerning environmental regulations and worker safety, significantly influence market developments. The market sees continuous introduction of substitutes, driving competition and prompting innovation in existing formulations. End-user trends, particularly in the electronics and automotive sectors, are shaping demand for specific additive properties. M&A activity is relatively low but presents opportunities for market consolidation, with estimated M&A deal values totaling xx million in the past five years.
- Market Concentration: Top 5 players hold approximately xx% market share in 2025.
- Innovation Drivers: Demand for improved performance, eco-friendly options, and cost reduction.
- Regulatory Impact: Stringent environmental and safety regulations are shaping product development.
- Product Substitutes: The emergence of alternative polishing methods and additives influences market competition.
- End-User Trends: Growth in electronics and automotive industries drives demand for specialized additives.
- M&A Activity: Total M&A deal value (2020-2024) estimated at xx million.
Acid Polishing Additive Industry Trends & Insights
The global acid polishing additive market is projected to experience significant growth during the forecast period (2025-2033), with a Compound Annual Growth Rate (CAGR) of xx%. This growth is primarily driven by the increasing demand from various end-use industries, notably electronics manufacturing, automotive, and aerospace. Technological advancements, such as the development of more efficient and environmentally friendly additives, are further contributing to market expansion. Consumer preferences are shifting towards sustainable and high-performance solutions, pushing manufacturers to innovate. Competitive dynamics are intense, with established players focusing on product diversification and strategic partnerships to maintain market share. Market penetration is expected to increase significantly, particularly in developing economies witnessing rapid industrialization. Technological disruptions, such as the introduction of advanced materials and automation in polishing processes, are creating both challenges and opportunities for market participants.
Dominant Markets & Segments in Acid Polishing Additive
The Asia-Pacific region is currently the dominant market for acid polishing additives, driven by robust growth in electronics manufacturing and automotive industries in countries like China, South Korea, and Japan. The high concentration of manufacturing facilities in these regions contributes significantly to the high demand.
- Key Drivers in Asia-Pacific:
- Rapid industrialization and economic growth.
- Significant investments in manufacturing infrastructure.
- High demand from electronics and automotive sectors.
- Dominance Analysis: The region's established manufacturing base, coupled with supportive government policies and favorable economic conditions, makes it the leading market for acid polishing additives. Its dominance is expected to continue throughout the forecast period.
Acid Polishing Additive Product Developments
Recent product innovations focus on improving polishing efficiency, reducing environmental impact, and enhancing surface finish quality. New additives are being developed with enhanced corrosion inhibitors, providing better protection for the workpiece during the polishing process. These innovations address the market need for eco-friendly and high-performance solutions. The trend is towards additives with improved compatibility with various materials, extending their applicability across a broader range of industries.
Report Scope & Segmentation Analysis
This report segments the acid polishing additive market based on type (e.g., inorganic, organic), application (e.g., metals, plastics), and region (e.g., North America, Europe, Asia-Pacific). Each segment’s growth projections, market sizes, and competitive dynamics are analyzed in detail. The market is expected to witness significant growth across all segments, driven by specific industry trends and technological advancements.
Key Drivers of Acid Polishing Additive Growth
The growth of the acid polishing additive market is propelled by several factors: the increasing demand from the electronics and automotive industries, advancements in additive technology leading to improved efficiency and performance, and supportive government policies promoting industrial growth and environmental sustainability. Furthermore, the growing adoption of advanced polishing techniques is boosting market growth.
Challenges in the Acid Polishing Additive Sector
The acid polishing additive sector faces challenges such as stringent environmental regulations, volatility in raw material prices, and intense competition. These factors can impact production costs, profitability, and market share. Supply chain disruptions can also lead to production delays and increased costs.
Emerging Opportunities in Acid Polishing Additive
Emerging opportunities lie in the development of eco-friendly and high-performance additives, catering to the growing demand for sustainable solutions. Expansion into new applications, such as 3D printing and medical devices, presents significant growth potential. Furthermore, the increasing adoption of automation in polishing processes creates opportunities for specialized additives.
Leading Players in the Acid Polishing Additive Market
- Air Products
- Stella Chemifa
- Sumitomo
- Evonik Industries
- Wacker Chemie
- Mitsubishi Chemical
- Topone Technology
- SunFonergy Technology
- Shichuang Energy
- Xiaochen Technology
- Feilu New Energy
- Benshan New Material
Key Developments in Acid Polishing Additive Industry
- June 2023: Air Products announced the launch of a new, eco-friendly acid polishing additive.
- March 2022: Sumitomo Chemical acquired a smaller competitor, expanding its market share.
- October 2021: Evonik Industries invested in R&D to develop next-generation acid polishing additives. (Further details on specific developments will be added to the final report.)
Strategic Outlook for Acid Polishing Additive Market
The acid polishing additive market is poised for continued growth, driven by technological advancements, increasing industrialization, and the growing demand for high-performance and environmentally friendly solutions. Strategic partnerships, investments in R&D, and expansion into new markets will be key to success in this competitive landscape. The market is expected to see further consolidation as major players seek to strengthen their market positions.
Acid Polishing Additive Segmentation
-
1. Application
- 1.1. Monocrystalline Silicon Solar Cells
- 1.2. Polycrystalline Silicon Solar Cells
-
2. Type
- 2.1. Surface Cleaner
- 2.2. Surfactants
- 2.3. Others
Acid Polishing Additive Segmentation By Geography
-
1. North America
- 1.1. United States
- 1.2. Canada
- 1.3. Mexico
-
2. South America
- 2.1. Brazil
- 2.2. Argentina
- 2.3. Rest of South America
-
3. Europe
- 3.1. United Kingdom
- 3.2. Germany
- 3.3. France
- 3.4. Italy
- 3.5. Spain
- 3.6. Russia
- 3.7. Benelux
- 3.8. Nordics
- 3.9. Rest of Europe
-
4. Middle East & Africa
- 4.1. Turkey
- 4.2. Israel
- 4.3. GCC
- 4.4. North Africa
- 4.5. South Africa
- 4.6. Rest of Middle East & Africa
-
5. Asia Pacific
- 5.1. China
- 5.2. India
- 5.3. Japan
- 5.4. South Korea
- 5.5. ASEAN
- 5.6. Oceania
- 5.7. Rest of Asia Pacific
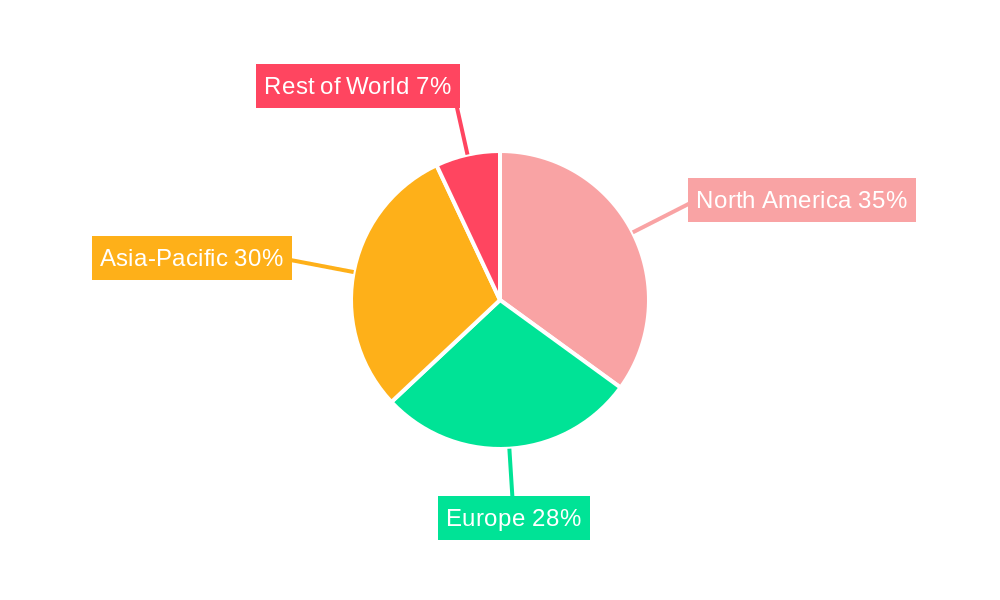
Acid Polishing Additive Regional Market Share
Geographic Coverage of Acid Polishing Additive
Acid Polishing Additive REPORT HIGHLIGHTS
| Aspects | Details |
|---|---|
| Study Period | 2020-2034 |
| Base Year | 2025 |
| Estimated Year | 2026 |
| Forecast Period | 2026-2034 |
| Historical Period | 2020-2025 |
| Growth Rate | CAGR of 11.21% from 2020-2034 |
| Segmentation |
|
Table of Contents
- 1. Introduction
- 1.1. Research Scope
- 1.2. Market Segmentation
- 1.3. Research Objective
- 1.4. Definitions and Assumptions
- 2. Executive Summary
- 2.1. Market Snapshot
- 3. Market Dynamics
- 3.1. Market Drivers
- 3.2. Market Restrains
- 3.3. Market Trends
- 3.4. Market Opportunities
- 4. Market Factor Analysis
- 4.1. Porters Five Forces
- 4.1.1. Bargaining Power of Suppliers
- 4.1.2. Bargaining Power of Buyers
- 4.1.3. Threat of New Entrants
- 4.1.4. Threat of Substitutes
- 4.1.5. Competitive Rivalry
- 4.2. PESTEL analysis
- 4.3. BCG Analysis
- 4.3.1. Stars (High Growth, High Market Share)
- 4.3.2. Cash Cows (Low Growth, High Market Share)
- 4.3.3. Question Mark (High Growth, Low Market Share)
- 4.3.4. Dogs (Low Growth, Low Market Share)
- 4.4. Ansoff Matrix Analysis
- 4.5. Supply Chain Analysis
- 4.6. Regulatory Landscape
- 4.7. Current Market Potential and Opportunity Assessment (TAM–SAM–SOM Framework)
- 4.8. RAX Analyst Note
- 4.1. Porters Five Forces
- 5. Market Analysis, Insights and Forecast 2021-2033
- 5.1. Market Analysis, Insights and Forecast - by Application
- 5.1.1. Monocrystalline Silicon Solar Cells
- 5.1.2. Polycrystalline Silicon Solar Cells
- 5.2. Market Analysis, Insights and Forecast - by Type
- 5.2.1. Surface Cleaner
- 5.2.2. Surfactants
- 5.2.3. Others
- 5.3. Market Analysis, Insights and Forecast - by Region
- 5.3.1. North America
- 5.3.2. South America
- 5.3.3. Europe
- 5.3.4. Middle East & Africa
- 5.3.5. Asia Pacific
- 5.1. Market Analysis, Insights and Forecast - by Application
- 6. Global Acid Polishing Additive Analysis, Insights and Forecast, 2021-2033
- 6.1. Market Analysis, Insights and Forecast - by Application
- 6.1.1. Monocrystalline Silicon Solar Cells
- 6.1.2. Polycrystalline Silicon Solar Cells
- 6.2. Market Analysis, Insights and Forecast - by Type
- 6.2.1. Surface Cleaner
- 6.2.2. Surfactants
- 6.2.3. Others
- 6.1. Market Analysis, Insights and Forecast - by Application
- 7. North America Acid Polishing Additive Analysis, Insights and Forecast, 2020-2032
- 7.1. Market Analysis, Insights and Forecast - by Application
- 7.1.1. Monocrystalline Silicon Solar Cells
- 7.1.2. Polycrystalline Silicon Solar Cells
- 7.2. Market Analysis, Insights and Forecast - by Type
- 7.2.1. Surface Cleaner
- 7.2.2. Surfactants
- 7.2.3. Others
- 7.1. Market Analysis, Insights and Forecast - by Application
- 8. South America Acid Polishing Additive Analysis, Insights and Forecast, 2020-2032
- 8.1. Market Analysis, Insights and Forecast - by Application
- 8.1.1. Monocrystalline Silicon Solar Cells
- 8.1.2. Polycrystalline Silicon Solar Cells
- 8.2. Market Analysis, Insights and Forecast - by Type
- 8.2.1. Surface Cleaner
- 8.2.2. Surfactants
- 8.2.3. Others
- 8.1. Market Analysis, Insights and Forecast - by Application
- 9. Europe Acid Polishing Additive Analysis, Insights and Forecast, 2020-2032
- 9.1. Market Analysis, Insights and Forecast - by Application
- 9.1.1. Monocrystalline Silicon Solar Cells
- 9.1.2. Polycrystalline Silicon Solar Cells
- 9.2. Market Analysis, Insights and Forecast - by Type
- 9.2.1. Surface Cleaner
- 9.2.2. Surfactants
- 9.2.3. Others
- 9.1. Market Analysis, Insights and Forecast - by Application
- 10. Middle East & Africa Acid Polishing Additive Analysis, Insights and Forecast, 2020-2032
- 10.1. Market Analysis, Insights and Forecast - by Application
- 10.1.1. Monocrystalline Silicon Solar Cells
- 10.1.2. Polycrystalline Silicon Solar Cells
- 10.2. Market Analysis, Insights and Forecast - by Type
- 10.2.1. Surface Cleaner
- 10.2.2. Surfactants
- 10.2.3. Others
- 10.1. Market Analysis, Insights and Forecast - by Application
- 11. Asia Pacific Acid Polishing Additive Analysis, Insights and Forecast, 2020-2032
- 11.1. Market Analysis, Insights and Forecast - by Application
- 11.1.1. Monocrystalline Silicon Solar Cells
- 11.1.2. Polycrystalline Silicon Solar Cells
- 11.2. Market Analysis, Insights and Forecast - by Type
- 11.2.1. Surface Cleaner
- 11.2.2. Surfactants
- 11.2.3. Others
- 11.1. Market Analysis, Insights and Forecast - by Application
- 12. Competitive Analysis
- 12.1. Company Profiles
- 12.1.1 Air Products
- 12.1.1.1. Company Overview
- 12.1.1.2. Products
- 12.1.1.3. Company Financials
- 12.1.1.4. SWOT Analysis
- 12.1.2 Stella Chemifa
- 12.1.2.1. Company Overview
- 12.1.2.2. Products
- 12.1.2.3. Company Financials
- 12.1.2.4. SWOT Analysis
- 12.1.3 Sumitomo
- 12.1.3.1. Company Overview
- 12.1.3.2. Products
- 12.1.3.3. Company Financials
- 12.1.3.4. SWOT Analysis
- 12.1.4 Evonik Industries
- 12.1.4.1. Company Overview
- 12.1.4.2. Products
- 12.1.4.3. Company Financials
- 12.1.4.4. SWOT Analysis
- 12.1.5 Wacker Chemie
- 12.1.5.1. Company Overview
- 12.1.5.2. Products
- 12.1.5.3. Company Financials
- 12.1.5.4. SWOT Analysis
- 12.1.6 Mitsubishi Chemical
- 12.1.6.1. Company Overview
- 12.1.6.2. Products
- 12.1.6.3. Company Financials
- 12.1.6.4. SWOT Analysis
- 12.1.7 Topone Technology
- 12.1.7.1. Company Overview
- 12.1.7.2. Products
- 12.1.7.3. Company Financials
- 12.1.7.4. SWOT Analysis
- 12.1.8 SunFonergy Technology
- 12.1.8.1. Company Overview
- 12.1.8.2. Products
- 12.1.8.3. Company Financials
- 12.1.8.4. SWOT Analysis
- 12.1.9 Shichuang Energy
- 12.1.9.1. Company Overview
- 12.1.9.2. Products
- 12.1.9.3. Company Financials
- 12.1.9.4. SWOT Analysis
- 12.1.10 Xiaochen Technology
- 12.1.10.1. Company Overview
- 12.1.10.2. Products
- 12.1.10.3. Company Financials
- 12.1.10.4. SWOT Analysis
- 12.1.11 Feilu New Energy
- 12.1.11.1. Company Overview
- 12.1.11.2. Products
- 12.1.11.3. Company Financials
- 12.1.11.4. SWOT Analysis
- 12.1.12 Benshan New Material
- 12.1.12.1. Company Overview
- 12.1.12.2. Products
- 12.1.12.3. Company Financials
- 12.1.12.4. SWOT Analysis
- 12.1.1 Air Products
- 12.2. Market Entropy
- 12.2.1 Company's Key Areas Served
- 12.2.2 Recent Developments
- 12.3. Company Market Share Analysis 2025
- 12.3.1 Top 5 Companies Market Share Analysis
- 12.3.2 Top 3 Companies Market Share Analysis
- 12.4. List of Potential Customers
- 13. Research Methodology
List of Figures
- Figure 1: Global Acid Polishing Additive Revenue Breakdown (billion, %) by Region 2025 & 2033
- Figure 2: Global Acid Polishing Additive Volume Breakdown (K, %) by Region 2025 & 2033
- Figure 3: North America Acid Polishing Additive Revenue (billion), by Application 2025 & 2033
- Figure 4: North America Acid Polishing Additive Volume (K), by Application 2025 & 2033
- Figure 5: North America Acid Polishing Additive Revenue Share (%), by Application 2025 & 2033
- Figure 6: North America Acid Polishing Additive Volume Share (%), by Application 2025 & 2033
- Figure 7: North America Acid Polishing Additive Revenue (billion), by Type 2025 & 2033
- Figure 8: North America Acid Polishing Additive Volume (K), by Type 2025 & 2033
- Figure 9: North America Acid Polishing Additive Revenue Share (%), by Type 2025 & 2033
- Figure 10: North America Acid Polishing Additive Volume Share (%), by Type 2025 & 2033
- Figure 11: North America Acid Polishing Additive Revenue (billion), by Country 2025 & 2033
- Figure 12: North America Acid Polishing Additive Volume (K), by Country 2025 & 2033
- Figure 13: North America Acid Polishing Additive Revenue Share (%), by Country 2025 & 2033
- Figure 14: North America Acid Polishing Additive Volume Share (%), by Country 2025 & 2033
- Figure 15: South America Acid Polishing Additive Revenue (billion), by Application 2025 & 2033
- Figure 16: South America Acid Polishing Additive Volume (K), by Application 2025 & 2033
- Figure 17: South America Acid Polishing Additive Revenue Share (%), by Application 2025 & 2033
- Figure 18: South America Acid Polishing Additive Volume Share (%), by Application 2025 & 2033
- Figure 19: South America Acid Polishing Additive Revenue (billion), by Type 2025 & 2033
- Figure 20: South America Acid Polishing Additive Volume (K), by Type 2025 & 2033
- Figure 21: South America Acid Polishing Additive Revenue Share (%), by Type 2025 & 2033
- Figure 22: South America Acid Polishing Additive Volume Share (%), by Type 2025 & 2033
- Figure 23: South America Acid Polishing Additive Revenue (billion), by Country 2025 & 2033
- Figure 24: South America Acid Polishing Additive Volume (K), by Country 2025 & 2033
- Figure 25: South America Acid Polishing Additive Revenue Share (%), by Country 2025 & 2033
- Figure 26: South America Acid Polishing Additive Volume Share (%), by Country 2025 & 2033
- Figure 27: Europe Acid Polishing Additive Revenue (billion), by Application 2025 & 2033
- Figure 28: Europe Acid Polishing Additive Volume (K), by Application 2025 & 2033
- Figure 29: Europe Acid Polishing Additive Revenue Share (%), by Application 2025 & 2033
- Figure 30: Europe Acid Polishing Additive Volume Share (%), by Application 2025 & 2033
- Figure 31: Europe Acid Polishing Additive Revenue (billion), by Type 2025 & 2033
- Figure 32: Europe Acid Polishing Additive Volume (K), by Type 2025 & 2033
- Figure 33: Europe Acid Polishing Additive Revenue Share (%), by Type 2025 & 2033
- Figure 34: Europe Acid Polishing Additive Volume Share (%), by Type 2025 & 2033
- Figure 35: Europe Acid Polishing Additive Revenue (billion), by Country 2025 & 2033
- Figure 36: Europe Acid Polishing Additive Volume (K), by Country 2025 & 2033
- Figure 37: Europe Acid Polishing Additive Revenue Share (%), by Country 2025 & 2033
- Figure 38: Europe Acid Polishing Additive Volume Share (%), by Country 2025 & 2033
- Figure 39: Middle East & Africa Acid Polishing Additive Revenue (billion), by Application 2025 & 2033
- Figure 40: Middle East & Africa Acid Polishing Additive Volume (K), by Application 2025 & 2033
- Figure 41: Middle East & Africa Acid Polishing Additive Revenue Share (%), by Application 2025 & 2033
- Figure 42: Middle East & Africa Acid Polishing Additive Volume Share (%), by Application 2025 & 2033
- Figure 43: Middle East & Africa Acid Polishing Additive Revenue (billion), by Type 2025 & 2033
- Figure 44: Middle East & Africa Acid Polishing Additive Volume (K), by Type 2025 & 2033
- Figure 45: Middle East & Africa Acid Polishing Additive Revenue Share (%), by Type 2025 & 2033
- Figure 46: Middle East & Africa Acid Polishing Additive Volume Share (%), by Type 2025 & 2033
- Figure 47: Middle East & Africa Acid Polishing Additive Revenue (billion), by Country 2025 & 2033
- Figure 48: Middle East & Africa Acid Polishing Additive Volume (K), by Country 2025 & 2033
- Figure 49: Middle East & Africa Acid Polishing Additive Revenue Share (%), by Country 2025 & 2033
- Figure 50: Middle East & Africa Acid Polishing Additive Volume Share (%), by Country 2025 & 2033
- Figure 51: Asia Pacific Acid Polishing Additive Revenue (billion), by Application 2025 & 2033
- Figure 52: Asia Pacific Acid Polishing Additive Volume (K), by Application 2025 & 2033
- Figure 53: Asia Pacific Acid Polishing Additive Revenue Share (%), by Application 2025 & 2033
- Figure 54: Asia Pacific Acid Polishing Additive Volume Share (%), by Application 2025 & 2033
- Figure 55: Asia Pacific Acid Polishing Additive Revenue (billion), by Type 2025 & 2033
- Figure 56: Asia Pacific Acid Polishing Additive Volume (K), by Type 2025 & 2033
- Figure 57: Asia Pacific Acid Polishing Additive Revenue Share (%), by Type 2025 & 2033
- Figure 58: Asia Pacific Acid Polishing Additive Volume Share (%), by Type 2025 & 2033
- Figure 59: Asia Pacific Acid Polishing Additive Revenue (billion), by Country 2025 & 2033
- Figure 60: Asia Pacific Acid Polishing Additive Volume (K), by Country 2025 & 2033
- Figure 61: Asia Pacific Acid Polishing Additive Revenue Share (%), by Country 2025 & 2033
- Figure 62: Asia Pacific Acid Polishing Additive Volume Share (%), by Country 2025 & 2033
List of Tables
- Table 1: Global Acid Polishing Additive Revenue billion Forecast, by Application 2020 & 2033
- Table 2: Global Acid Polishing Additive Volume K Forecast, by Application 2020 & 2033
- Table 3: Global Acid Polishing Additive Revenue billion Forecast, by Type 2020 & 2033
- Table 4: Global Acid Polishing Additive Volume K Forecast, by Type 2020 & 2033
- Table 5: Global Acid Polishing Additive Revenue billion Forecast, by Region 2020 & 2033
- Table 6: Global Acid Polishing Additive Volume K Forecast, by Region 2020 & 2033
- Table 7: Global Acid Polishing Additive Revenue billion Forecast, by Application 2020 & 2033
- Table 8: Global Acid Polishing Additive Volume K Forecast, by Application 2020 & 2033
- Table 9: Global Acid Polishing Additive Revenue billion Forecast, by Type 2020 & 2033
- Table 10: Global Acid Polishing Additive Volume K Forecast, by Type 2020 & 2033
- Table 11: Global Acid Polishing Additive Revenue billion Forecast, by Country 2020 & 2033
- Table 12: Global Acid Polishing Additive Volume K Forecast, by Country 2020 & 2033
- Table 13: United States Acid Polishing Additive Revenue (billion) Forecast, by Application 2020 & 2033
- Table 14: United States Acid Polishing Additive Volume (K) Forecast, by Application 2020 & 2033
- Table 15: Canada Acid Polishing Additive Revenue (billion) Forecast, by Application 2020 & 2033
- Table 16: Canada Acid Polishing Additive Volume (K) Forecast, by Application 2020 & 2033
- Table 17: Mexico Acid Polishing Additive Revenue (billion) Forecast, by Application 2020 & 2033
- Table 18: Mexico Acid Polishing Additive Volume (K) Forecast, by Application 2020 & 2033
- Table 19: Global Acid Polishing Additive Revenue billion Forecast, by Application 2020 & 2033
- Table 20: Global Acid Polishing Additive Volume K Forecast, by Application 2020 & 2033
- Table 21: Global Acid Polishing Additive Revenue billion Forecast, by Type 2020 & 2033
- Table 22: Global Acid Polishing Additive Volume K Forecast, by Type 2020 & 2033
- Table 23: Global Acid Polishing Additive Revenue billion Forecast, by Country 2020 & 2033
- Table 24: Global Acid Polishing Additive Volume K Forecast, by Country 2020 & 2033
- Table 25: Brazil Acid Polishing Additive Revenue (billion) Forecast, by Application 2020 & 2033
- Table 26: Brazil Acid Polishing Additive Volume (K) Forecast, by Application 2020 & 2033
- Table 27: Argentina Acid Polishing Additive Revenue (billion) Forecast, by Application 2020 & 2033
- Table 28: Argentina Acid Polishing Additive Volume (K) Forecast, by Application 2020 & 2033
- Table 29: Rest of South America Acid Polishing Additive Revenue (billion) Forecast, by Application 2020 & 2033
- Table 30: Rest of South America Acid Polishing Additive Volume (K) Forecast, by Application 2020 & 2033
- Table 31: Global Acid Polishing Additive Revenue billion Forecast, by Application 2020 & 2033
- Table 32: Global Acid Polishing Additive Volume K Forecast, by Application 2020 & 2033
- Table 33: Global Acid Polishing Additive Revenue billion Forecast, by Type 2020 & 2033
- Table 34: Global Acid Polishing Additive Volume K Forecast, by Type 2020 & 2033
- Table 35: Global Acid Polishing Additive Revenue billion Forecast, by Country 2020 & 2033
- Table 36: Global Acid Polishing Additive Volume K Forecast, by Country 2020 & 2033
- Table 37: United Kingdom Acid Polishing Additive Revenue (billion) Forecast, by Application 2020 & 2033
- Table 38: United Kingdom Acid Polishing Additive Volume (K) Forecast, by Application 2020 & 2033
- Table 39: Germany Acid Polishing Additive Revenue (billion) Forecast, by Application 2020 & 2033
- Table 40: Germany Acid Polishing Additive Volume (K) Forecast, by Application 2020 & 2033
- Table 41: France Acid Polishing Additive Revenue (billion) Forecast, by Application 2020 & 2033
- Table 42: France Acid Polishing Additive Volume (K) Forecast, by Application 2020 & 2033
- Table 43: Italy Acid Polishing Additive Revenue (billion) Forecast, by Application 2020 & 2033
- Table 44: Italy Acid Polishing Additive Volume (K) Forecast, by Application 2020 & 2033
- Table 45: Spain Acid Polishing Additive Revenue (billion) Forecast, by Application 2020 & 2033
- Table 46: Spain Acid Polishing Additive Volume (K) Forecast, by Application 2020 & 2033
- Table 47: Russia Acid Polishing Additive Revenue (billion) Forecast, by Application 2020 & 2033
- Table 48: Russia Acid Polishing Additive Volume (K) Forecast, by Application 2020 & 2033
- Table 49: Benelux Acid Polishing Additive Revenue (billion) Forecast, by Application 2020 & 2033
- Table 50: Benelux Acid Polishing Additive Volume (K) Forecast, by Application 2020 & 2033
- Table 51: Nordics Acid Polishing Additive Revenue (billion) Forecast, by Application 2020 & 2033
- Table 52: Nordics Acid Polishing Additive Volume (K) Forecast, by Application 2020 & 2033
- Table 53: Rest of Europe Acid Polishing Additive Revenue (billion) Forecast, by Application 2020 & 2033
- Table 54: Rest of Europe Acid Polishing Additive Volume (K) Forecast, by Application 2020 & 2033
- Table 55: Global Acid Polishing Additive Revenue billion Forecast, by Application 2020 & 2033
- Table 56: Global Acid Polishing Additive Volume K Forecast, by Application 2020 & 2033
- Table 57: Global Acid Polishing Additive Revenue billion Forecast, by Type 2020 & 2033
- Table 58: Global Acid Polishing Additive Volume K Forecast, by Type 2020 & 2033
- Table 59: Global Acid Polishing Additive Revenue billion Forecast, by Country 2020 & 2033
- Table 60: Global Acid Polishing Additive Volume K Forecast, by Country 2020 & 2033
- Table 61: Turkey Acid Polishing Additive Revenue (billion) Forecast, by Application 2020 & 2033
- Table 62: Turkey Acid Polishing Additive Volume (K) Forecast, by Application 2020 & 2033
- Table 63: Israel Acid Polishing Additive Revenue (billion) Forecast, by Application 2020 & 2033
- Table 64: Israel Acid Polishing Additive Volume (K) Forecast, by Application 2020 & 2033
- Table 65: GCC Acid Polishing Additive Revenue (billion) Forecast, by Application 2020 & 2033
- Table 66: GCC Acid Polishing Additive Volume (K) Forecast, by Application 2020 & 2033
- Table 67: North Africa Acid Polishing Additive Revenue (billion) Forecast, by Application 2020 & 2033
- Table 68: North Africa Acid Polishing Additive Volume (K) Forecast, by Application 2020 & 2033
- Table 69: South Africa Acid Polishing Additive Revenue (billion) Forecast, by Application 2020 & 2033
- Table 70: South Africa Acid Polishing Additive Volume (K) Forecast, by Application 2020 & 2033
- Table 71: Rest of Middle East & Africa Acid Polishing Additive Revenue (billion) Forecast, by Application 2020 & 2033
- Table 72: Rest of Middle East & Africa Acid Polishing Additive Volume (K) Forecast, by Application 2020 & 2033
- Table 73: Global Acid Polishing Additive Revenue billion Forecast, by Application 2020 & 2033
- Table 74: Global Acid Polishing Additive Volume K Forecast, by Application 2020 & 2033
- Table 75: Global Acid Polishing Additive Revenue billion Forecast, by Type 2020 & 2033
- Table 76: Global Acid Polishing Additive Volume K Forecast, by Type 2020 & 2033
- Table 77: Global Acid Polishing Additive Revenue billion Forecast, by Country 2020 & 2033
- Table 78: Global Acid Polishing Additive Volume K Forecast, by Country 2020 & 2033
- Table 79: China Acid Polishing Additive Revenue (billion) Forecast, by Application 2020 & 2033
- Table 80: China Acid Polishing Additive Volume (K) Forecast, by Application 2020 & 2033
- Table 81: India Acid Polishing Additive Revenue (billion) Forecast, by Application 2020 & 2033
- Table 82: India Acid Polishing Additive Volume (K) Forecast, by Application 2020 & 2033
- Table 83: Japan Acid Polishing Additive Revenue (billion) Forecast, by Application 2020 & 2033
- Table 84: Japan Acid Polishing Additive Volume (K) Forecast, by Application 2020 & 2033
- Table 85: South Korea Acid Polishing Additive Revenue (billion) Forecast, by Application 2020 & 2033
- Table 86: South Korea Acid Polishing Additive Volume (K) Forecast, by Application 2020 & 2033
- Table 87: ASEAN Acid Polishing Additive Revenue (billion) Forecast, by Application 2020 & 2033
- Table 88: ASEAN Acid Polishing Additive Volume (K) Forecast, by Application 2020 & 2033
- Table 89: Oceania Acid Polishing Additive Revenue (billion) Forecast, by Application 2020 & 2033
- Table 90: Oceania Acid Polishing Additive Volume (K) Forecast, by Application 2020 & 2033
- Table 91: Rest of Asia Pacific Acid Polishing Additive Revenue (billion) Forecast, by Application 2020 & 2033
- Table 92: Rest of Asia Pacific Acid Polishing Additive Volume (K) Forecast, by Application 2020 & 2033
Frequently Asked Questions
1. What is the projected Compound Annual Growth Rate (CAGR) of the Acid Polishing Additive?
The projected CAGR is approximately 11.21%.
2. Which companies are prominent players in the Acid Polishing Additive?
Key companies in the market include Air Products, Stella Chemifa, Sumitomo, Evonik Industries, Wacker Chemie, Mitsubishi Chemical, Topone Technology, SunFonergy Technology, Shichuang Energy, Xiaochen Technology, Feilu New Energy, Benshan New Material.
3. What are the main segments of the Acid Polishing Additive?
The market segments include Application, Type.
4. Can you provide details about the market size?
The market size is estimated to be USD 10.7 billion as of 2022.
5. What are some drivers contributing to market growth?
N/A
6. What are the notable trends driving market growth?
N/A
7. Are there any restraints impacting market growth?
N/A
8. Can you provide examples of recent developments in the market?
N/A
9. What pricing options are available for accessing the report?
Pricing options include single-user, multi-user, and enterprise licenses priced at USD 3950.00, USD 5925.00, and USD 7900.00 respectively.
10. Is the market size provided in terms of value or volume?
The market size is provided in terms of value, measured in billion and volume, measured in K.
11. Are there any specific market keywords associated with the report?
Yes, the market keyword associated with the report is "Acid Polishing Additive," which aids in identifying and referencing the specific market segment covered.
12. How do I determine which pricing option suits my needs best?
The pricing options vary based on user requirements and access needs. Individual users may opt for single-user licenses, while businesses requiring broader access may choose multi-user or enterprise licenses for cost-effective access to the report.
13. Are there any additional resources or data provided in the Acid Polishing Additive report?
While the report offers comprehensive insights, it's advisable to review the specific contents or supplementary materials provided to ascertain if additional resources or data are available.
14. How can I stay updated on further developments or reports in the Acid Polishing Additive?
To stay informed about further developments, trends, and reports in the Acid Polishing Additive, consider subscribing to industry newsletters, following relevant companies and organizations, or regularly checking reputable industry news sources and publications.
Methodology
Step 1 - Identification of Relevant Samples Size from Population Database


Step 2 - Approaches for Defining Global Market Size (Value, Volume* & Price*)

Note*: In applicable scenarios
Step 3 - Data Sources
Primary Research
- Web Analytics
- Survey Reports
- Research Institute
- Latest Research Reports
- Opinion Leaders
Secondary Research
- Annual Reports
- White Paper
- Latest Press Release
- Industry Association
- Paid Database
- Investor Presentations

Step 4 - Data Triangulation
Involves using different sources of information in order to increase the validity of a study
These sources are likely to be stakeholders in a program - participants, other researchers, program staff, other community members, and so on.
Then we put all data in single framework & apply various statistical tools to find out the dynamic on the market.
During the analysis stage, feedback from the stakeholder groups would be compared to determine areas of agreement as well as areas of divergence